Bear Cave 2 (Bull Allowed)

Shorts
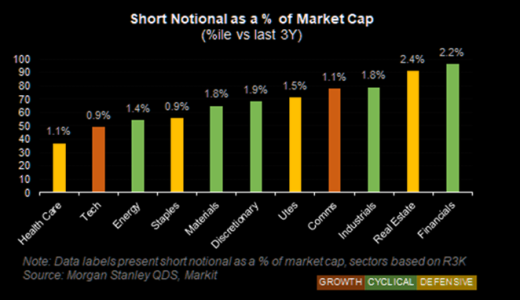
MS Securities Lending estimates investors added shorts street wide on the order of $27-30bn at the single-name level and $6-9bn at the index level. Single-name shorts as a % of market cap now sits above average at 1.4% (75th %ile vs the last 3Y) vs ETF shorts that remain around median levels at 1.5% (59th %ile vs the last 3Y), per Markit. Across Russell 3000 single-names, Cyclical sectors made up the majority of the short additions. Financials shorts, in particular, stood out in March totaling over $10bn – Financials short interest as a % of market cap is now the highest amongst the sectors at 2.2% (96th %ile vs the last 3Y, per Markit). Shorts across Growth and Defensive single-names mostly netted out to flat on the month.
 

Attachments

  • a.png
    a.png
    88.7 KB · Views: 49
We shall see how it all plays out as we enter May......

Say hello to put hate
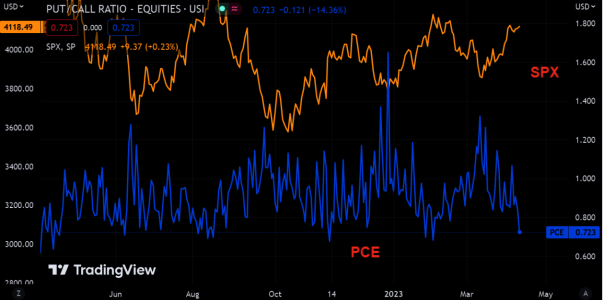
Who needs puts when the market never sells off...Put call ratio moving sharply lower. The crowd loves loading up on puts when the market makes a local low...and vice versa.
https://themarketear.com/newsfeed/cEaYpXnuy9
 

Attachments

  • a.png
    a.png
    181 KB · Views: 50
I remain flat....


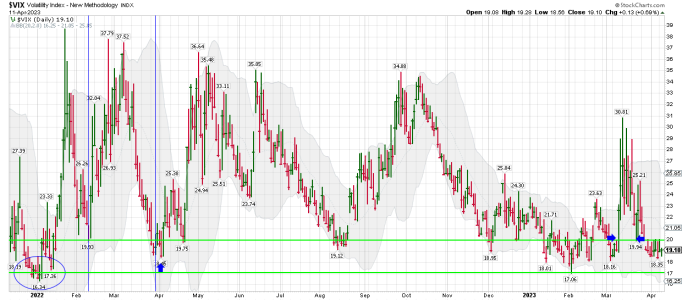
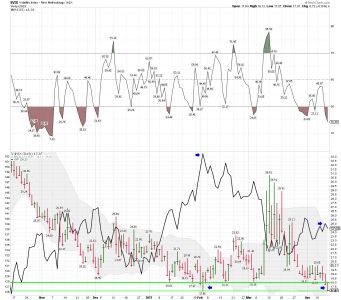
A small comment from Kaplan about the VIX:

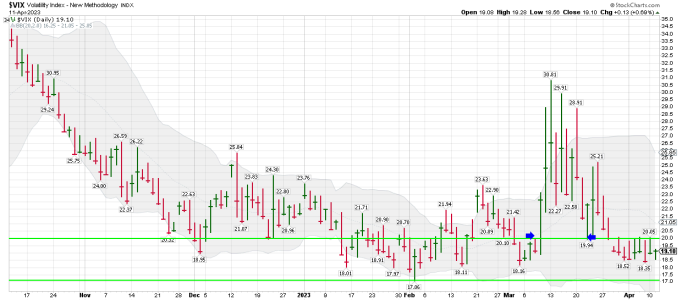
VIX keeps repeatedly sliding down to 19 or lower.


Without exception, every single trading day since March 30, 2023 has seen VIX fall to 19.00 or below, touching 18.35 on April 6. During the 2007-2009 bear market mentioned just above, VIX slid to 18.64 in August 2008, after which the S&P 500 lost about 43% of its value before Thanksgiving. I expect a very similar percentage pullback during the next several months as QQQ probably bottoms below 190.
https://truecontrarian-sjk.blogspot.com/
 

Attachments

  • a.png
    a.png
    84.5 KB · Views: 51
  • a.png
    a.png
    42.8 KB · Views: 52
  • a.png
    a.png
    45.9 KB · Views: 52
  • a.png
    a.png
    45.7 KB · Views: 51
  • a.png
    a.png
    29.1 KB · Views: 52
A Historic Pullback Is Driving the Next Market Shift
Clint Brewer | Apr 12, 2023 | Market Minute | 3 min read
Record Retrenchment
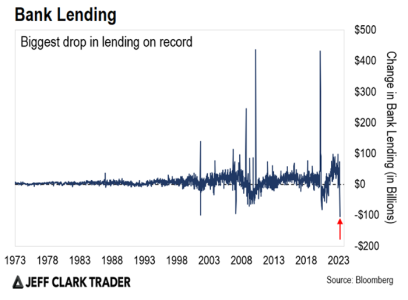
On the chart below, you can see the rate of change in U.S. commercial bank loans and leases.

During the last two weeks of March, this figure plunged by nearly $105 billion (red arrow)…
This drop eclipses anything we’ve ever seen – even during the 2008 financial crisis.

And since less capital is available to help grow the economy, this sharp pullback is turbocharging the Fed’s efforts to slow activity.

But even the Fed and its hundreds of PhD economists didn’t see this one coming… which is why the Fed is likely done raising rates until a clearer picture of the bank crisis fallout emerges.

As a trader, here’s what that means for you… Initially, Fed pauses are cheered because 85% of the time, stocks move higher over the next three months.

But these pauses are also a sign that something is breaking in the capital markets. And eventually, that catches up to the economy and stock market.

So we can expect more volatility, with quick changes in direction to the upside and downside.

But if we stay tactical in our trading approach, that means this market will offer plenty of opportunities ahead.

Best regards,

Clint Brewer
https://www.jeffclarktrader.com/market-minute/a-historic-pullback-is-driving-the-next-market-shift/
 

Attachments

  • a.png
    a.png
    104.1 KB · Views: 49
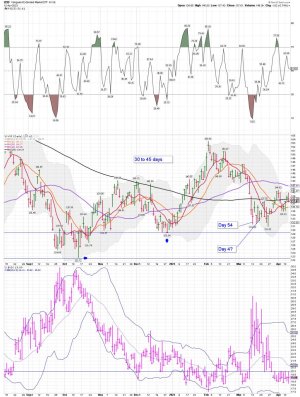
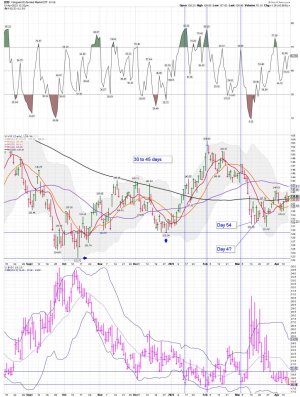
VXF daily: Still having trouble at the 200 day MA. Not what I want to see.....

Flat SPY and VXF....

Upside pain?
Goldman's flow guru, Scott Rubner, is back and he is bullish. Main bullets are:

1. Positioning is very short and fundamental investors are under exposed given low net HF exposure

2. Flow of fund technicals remain favorable from CTA’s, tax deadlines pass, and corporates return to the open window

3. Sentiment remains bearish, and “JOMO” joy of missing out, turns back into “FOMO” fear of missing out

4. Liquidity is the highest level of 2023

Given the fact implied volatility has imploded, playing a possible squeeze with upside calls offer attractive risk reward.

Imagine the pain...
...should the "smart" crowd (hedge funds) start to chase the SPX from here?...
 

Attachments

  • a.jpg
    a.jpg
    185.3 KB · Views: 47
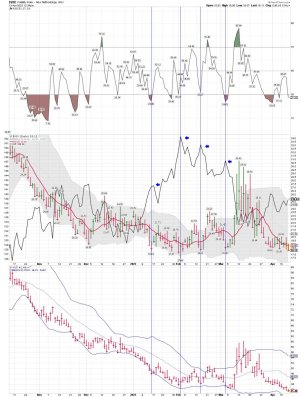
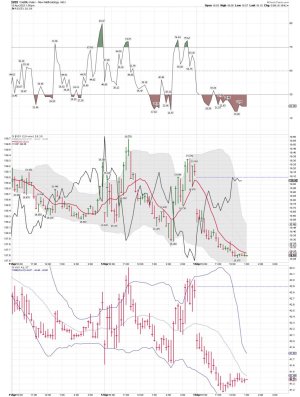
VXF daily: Back above the 200 day MA and the VIX is getting ready to move under 18ish again. We shall see if VXF gets another ST pullback. The data indicates above average odds a ST spike in the VIX..... Keep in mind I'm a trader NOT an investor.

Long VXX for a ST trade.....
 

Attachments

  • a.jpg
    a.jpg
    192.1 KB · Views: 41
  • a.jpg
    a.jpg
    161.9 KB · Views: 41
  • a.jpg
    a.jpg
    147 KB · Views: 40
Last edited:
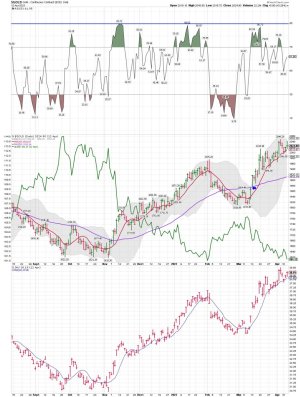
Not a time to chase gold in my opinion....

Where To Find the Next Gold Trading Opportunity
Imre Gams | Apr 13, 2023 | Market Minute | 3 min read

On April 3, I wrote about an exciting short-term opportunity in gold.

I spotted a bullish triangle that was getting ready to break out, which would take gold prices higher.

You can check out this setup below…
My upside target was $2,050. And just two days later, on April 5, gold went on to hit a high of $2,049.

Sometimes, my price targets are accurate to the dollar. This trade got very close, missing the target by just $1.

But trading is rarely picture-perfect. Being able to improvise and adapt in the moment is one trait that separates winning traders from the rest.

As a result, it’s now best to get out of the trade and wait patiently for the next buying opportunity.

https://www.jeffclarktrader.com/market-minute/where-to-find-the-next-gold-trading-opportunity/
 

Attachments

  • a.jpg
    a.jpg
    164.7 KB · Views: 44
  • a.jpg
    a.jpg
    176.6 KB · Views: 44
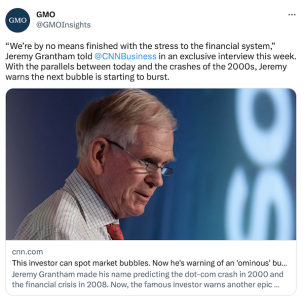
I was channel surfing looking for info about the leaked documents. When I heard A CNBC Bull.... LOL..... I can't wait to see if his call is correct this time.... I don't care about next year as he points out will be good.... I'm trading much shorter time frames. Why? Because Bear market trading rules are much different then Bull Market trading rules. The Bulls always win in the long-term, but I will pass on riding down over 20% moves. Been there and done the catch the falling knife thing.

For the record: I trade my indicators and don't watch much CNBC. If I do it's for news events that I might be able to trade.

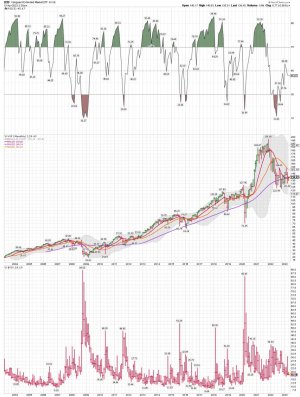
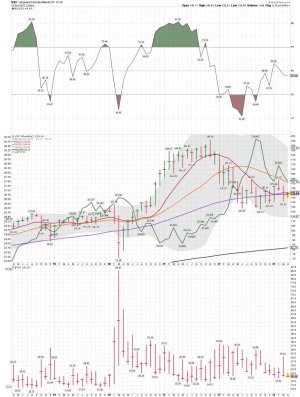
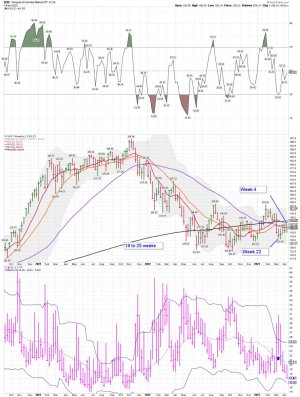
VXF remains in a Bear Market for now, but is trying to push back above the 50 month MA.... we shall see how it all plays out in the months ahead.

Flat VXF!

https://www.cnbc.com/video/2023/04/...ort-term-wharton-professor-jeremy-siegel.html


Prof Jeremy Siegel's Strange Claim: "Stocks Are Dirt Cheap"
Henry Blodget Updated Nov 6, 2008, 11:19 AM
JeremySiegel.pngJeremy Siegel, the beloved Wharton professor who juiced the bull market of the 1990s with his excellent Stocks For The Long Run, has had a rough go of late. First, the "long run" has turned out to be a bit longer than most people expected. Second, in the years since lending his name to WisdomTree mutual funds, Jeremy has gone into the regular market punditry business, and he's now well-acquainted with the hazards of that:

"I think the stock market will have another winning year in 2008," Prof. Siegel said last December. "For every percentage point that stock returns fall below 8% (my prediction) this year, they should exceed 8% next year (meaning, for example, if stocks gain 6% this year, they should finish 2008 up 10%). And I believe that financial stocks, which have plummeted 18% so far this year, will outperform the S&P 500 Index next year as the credit crisis fades."

Managing a global organization is no easy feat. Cloud-based browser management can help you keep tabs on a distributed workforce.
SPONSOR CONTENT by Google Chrome
Managing a global organization is no easy feat. Cloud-based browser management can help you keep tabs on a distributed workforce.

Whoops.

In any event, now that the S&P 500 is down 40% for the year, Jeremy's banging the drum again. Stocks are now "dirt cheap," he says. Specifically, Jeremy puts fair value of 1380 on the S&P 500, which is about 50% above the current level.

Here's the problem, though: Just about every other smart academic and analyst we know doesn't put fair value on the S&P 500 anywhere near 1380. Most, such as Jeremy Grantham of GMO, John Hussman of the Hussman Funds, Andrew Smithers of Smithers & Co., and Robert Shiller of Yale (a close friend of Prof. Siegel's), put it about about 1000.
https://www.businessinsider.com/2008/11/professor-jeremy-siegel-stocks-are-dirt-cheap-
 

Attachments

  • a.jpg
    a.jpg
    185.5 KB · Views: 40
  • a.jpg
    a.jpg
    162.9 KB · Views: 40
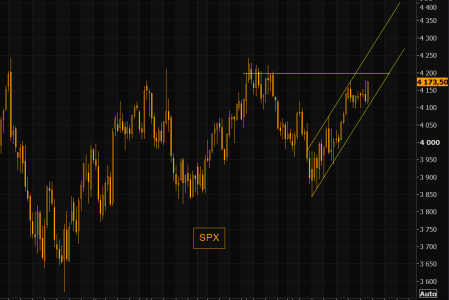
SPX - trend perfection stays intact
SPX's trend channel since SBV lows stays perfectly intact. 4200 is the next big resistance to watch as the crowd is forced to chase longs...
 

Attachments

  • a.png
    a.png
    23.7 KB · Views: 43
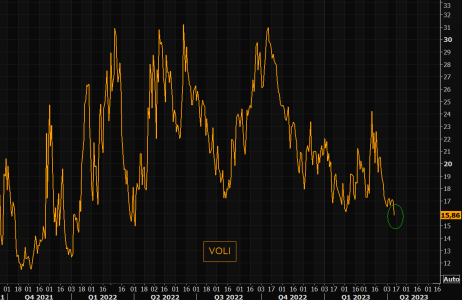
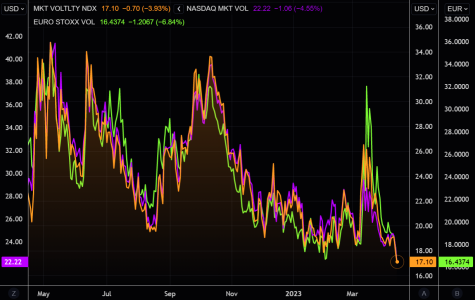
This equity volatility index at year lows
VOLI is basically the at the money VIX, i.e not "messed" up by the out of the money stuff. The VOLI is trading at levels we have not closed at since April last year...

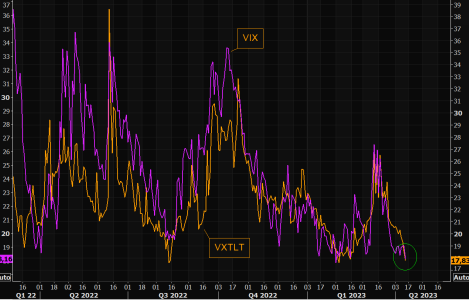
Complacency kicking in
The epic volatility reset continues. VIX and VXTLT printing new recent lows. Will they close at year lows this week?

https://themarketear.com/newsfeed
 

Attachments

  • a.png
    a.png
    27.4 KB · Views: 52
  • a.png
    a.png
    39.2 KB · Views: 52
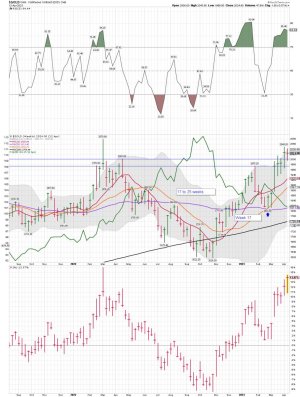
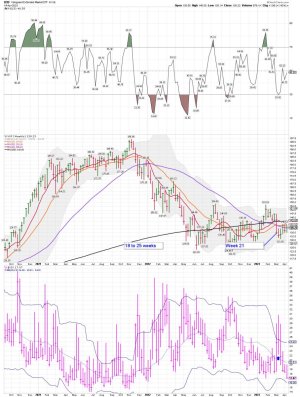
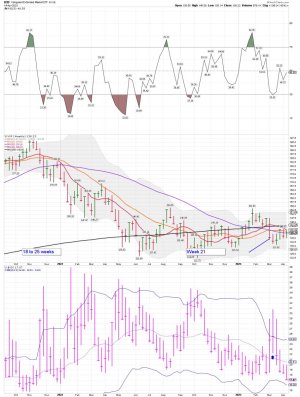
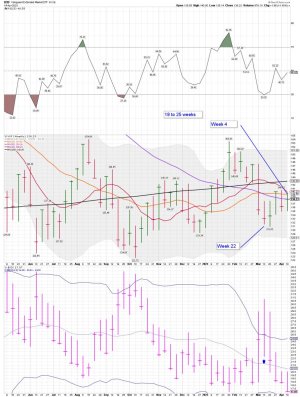
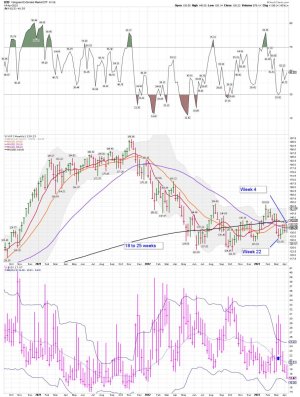
VXF weekly: Based on the VIX and a few other indicators.... It looks like we be getting closer to the next pullback...... VXF is still below its 10 and 20 week MA.
 

Attachments

  • a.jpg
    a.jpg
    176.7 KB · Views: 46
  • a.jpg
    a.jpg
    152.5 KB · Views: 44
See new Tweets
Conversation
Tom McClellan
@McClellanOsc
Latest data from the Monthly Treasury Statement at https://fiscal.treasury.gov/reports-statements/mts/current.html show that federal government is still outspending what it takes in by 7 percentage points of GDP. Would have to cut expenditures 27% just to balance the income. March outlay alone was up 36% v. March `22.


https://twitter.com/McClellanOsc/status/1646219215710601217?mc_cid=f16fd8bcbf&mc_eid=5b348a9ca0


Jurrien Timmer
@TimmerFidelity
High levels of indebtedness require low real yields, so it's plausible the Fed will eventually return to yield curve control (YCC), much as it did during the 1940s. It also would suggest that the Fed’s balance sheet will remain very large.
https://twitter.com/TimmerFidelity/status/1646877215915749376?mc_cid=f16fd8bcbf&mc_eid=5b348a9ca0

https://mailchi.mp/felder/stocks-unattractive?mc_cid=f16fd8bcbf&mc_eid=5b348a9ca0
 

Attachments

  • a.png
    a.png
    120.2 KB · Views: 50
  • a.png
    a.png
    316.5 KB · Views: 51
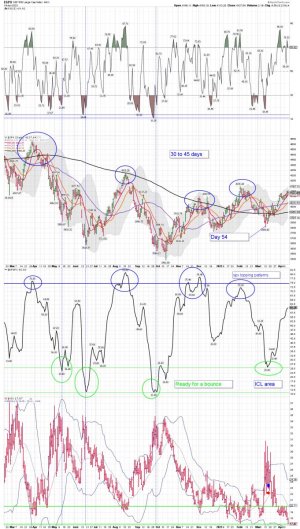
VXF weekly: We shall see how things play out in the weeks ahead as it looks like the ICL be in.....

Flat VXF....
 

Attachments

  • a.jpg
    a.jpg
    167.9 KB · Views: 56
  • a.jpg
    a.jpg
    177.8 KB · Views: 53
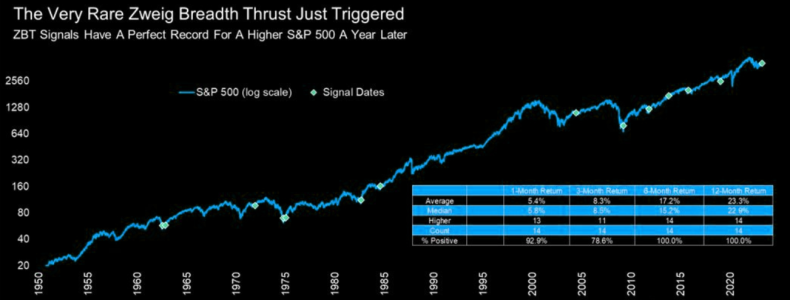
We shall see how it plays..... The "Zweig Breadth Thrust" indicator looks good based on its 100% track record. We shall see if additional VXF buyers come in.


The 100% indicator
Just a friendly reminder that we recently had a BUY signal from the "Zweig Breadth Thrust" indicator. This signal is basically generated when you get a sharp lift in the proportion of stocks going up vs down from previous suppressed levels. Only going back to 1950 and it has a perfect track-record on a 6-month forward returns window with >15% return (small n = 14 though).
https://themarketear.com/newsfeed/caR_UAWBzf

The mega-cap bull
How the largest stocks have performed so far in 2023:

Facebook +84.1%

Nvidia +83.1%

Tesla +50.2%

Apple +27.2%

Google +23.4%

Amazon +22%

Microsoft +19.3%


This week in Soft Landing
1. Inflation is moderating. Both the CPI and PPI readings for March suggest inflation is moderating, with particular progress on shelter inflation

2. The consumer remains resilient. Friday's data was encouraging - above consensus expectations

3. Big banks had a solid quarter. JPM, C, WFC, and PNC all reported earnings beats

This week's data, both micro and macro, paint a picture of a nice & pleasant soft landing.
 

Attachments

  • a.png
    a.png
    276.2 KB · Views: 65
  • a.jpg
    a.jpg
    177.8 KB · Views: 63
Last edited:
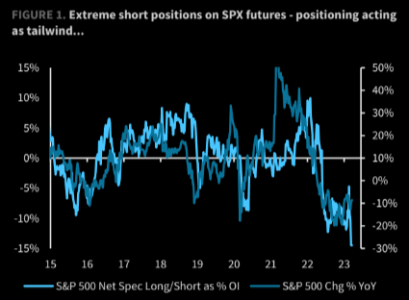
The extreme one
Nothing new here, but the extreme short position in SPX futures is of course worrying for the bears.
 

Attachments

  • a.png
    a.png
    60 KB · Views: 59
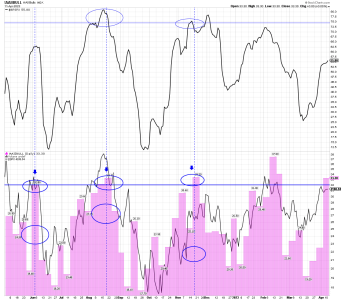
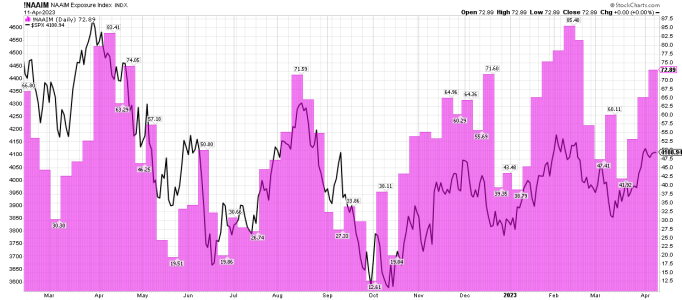
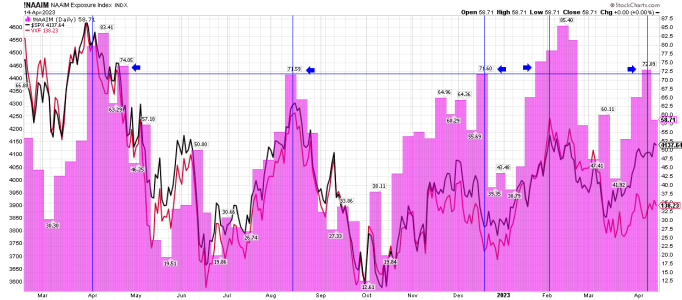
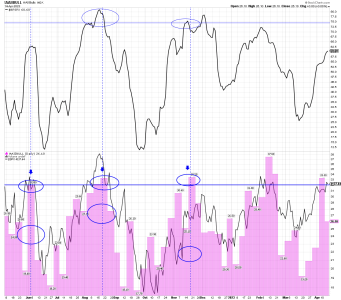
!NAAIM daily and the 70ish level..... It take a few weeks after tagging 70ish for some indexes to pullback. We shall how the NAAIM 72.89ish high marker plays out....
 

Attachments

  • a.png
    a.png
    61.5 KB · Views: 58
  • a.png
    a.png
    83.9 KB · Views: 60
  • a.jpg
    a.jpg
    166.4 KB · Views: 60
Last edited:
Back
Top