Bear Cave 2 (Bull Allowed)

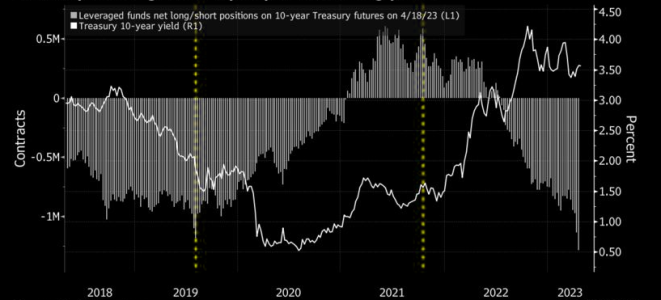
HFs never this bearish on Treasuries
“Hedge funds may be thinking that inflation will be stickier than many in the market are currently expecting,” said Damien McColough, head of fixed-income research at Westpac Banking Corp. in Sydney. “On the face of it, this big short doesn’t reflect the view that there will be a near-term recession.”
https://themarketear.com/newsfeed
 

Attachments

  • a.png
    a.png
    144.7 KB · Views: 123
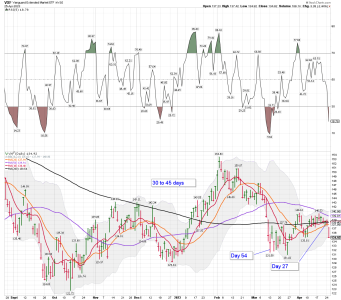
VXF daily: Back below the 200, 50, 20 and 10 day MA. It looks like the SPY is moving down into the next daily cycle low.... We shall see how it plays out...

Flat SPY and VXF

For the record: Since I am NOT in investor I don't really care what causes the market to move UP or DOWN..... I just place my bets based on my indicators using Risk Management. Hard to do in a market like this one using just a TSP account with limited moves.
 

Attachments

  • a.png
    a.png
    92.1 KB · Views: 122
Last edited:
In case you were wondering? Unable to post due to some family issues....

I hope everyone is making a few bucks. I haven't made any trades in sometime. Parked in short-term notes for now making around 5%. I had some spare time today to look over some articles.

Take Care!

http://SevenSentinels @SevenSentinels · 4h Memorial Day- May 29, 2023

Serious Traders: Consider This Powerful Trading Signal Article Open To All

https://sevensentinels.com/special-report-serious-traders-consider-this-powerful-trading-signal/

Show more
 
A quick update about one of my favorite trading indicators. The VIX! It has been a nice Bear Market rally..... Make sure you are taking some profits as we head back to overbought, and the VIX produced a lower BB crash. Time to reduce a tad, and take some profits. I'm doing very little trading right now....


Why Sentiment is Beginning to Shift
Jeff Clark | Jun 8, 2023 | Market Minute | 2 min read
That didn’t take long

And, here we are…

Just last week we looked at the chart of the S&P 500 and figured it was likely headed towards the 4300 level.
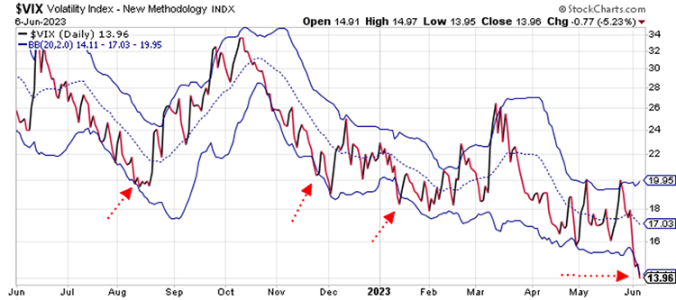
The Volatility Index (VIX) is on the verge of generating a sell signal. Look at this chart…

The Volatility Index closed below its lower Bollinger Band and at its lowest level of the year yesterday. The index will generate a broad stock market sell signal when it closes back inside the Bollinger Bands.

This will mark the fourth VIX sell signal of the past year. All three of the previous signals occurred within just a few days of intermediate-term tops in the stock market.

The S&P 500 fell 700 points in two months following the VIX sell signal last August. The index fell 200 points in six weeks after the November sell signal. And, the S&P fell 200 points in six weeks following the VIX sell signal in January.

https://www.jeffclarktrader.com/market-minute/why-sentiment-is-beginning-to-shift/
 

Attachments

  • a.png
    a.png
    132.7 KB · Views: 56
An indicator that is a big part of my trading system. The VIX is sending out a warning signal to reduce some if you are still long. Well, if you use Risk Management indicators.

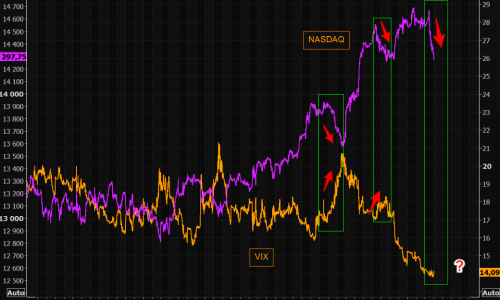
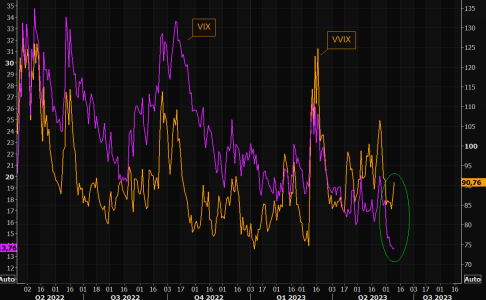
Has VIX become immune?
VXN reacted to the move lower in NASDAQ yesterday, but VIX remains dormant. Haven't seen NASDAQ move this much and VIX not pay attention at all...
https://themarketear.com/newsfeed
 

Attachments

  • a.png
    a.png
    101.5 KB · Views: 63
Getting there
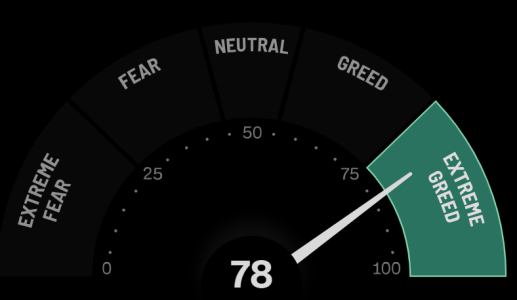
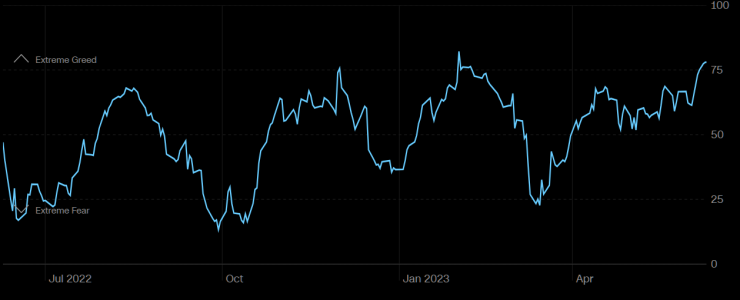
Extreme greed is here. We reached a slightly higher reading in Feb this year...
 

Attachments

  • a.png
    a.png
    52.9 KB · Views: 48
  • a.png
    a.png
    53.6 KB · Views: 48
The great put hate is back
The crowd has managed buying puts at local market lows and puking puts at local market highs. Is this time different, or...
 

Attachments

  • a.png
    a.png
    169.5 KB · Views: 48
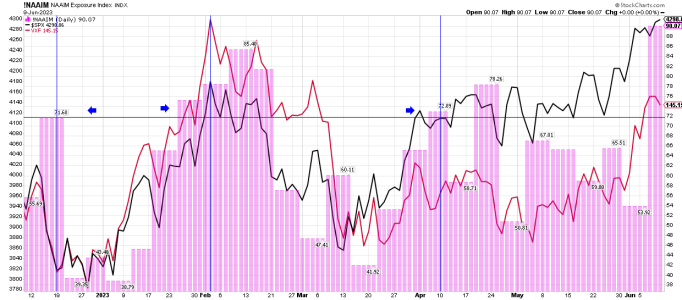
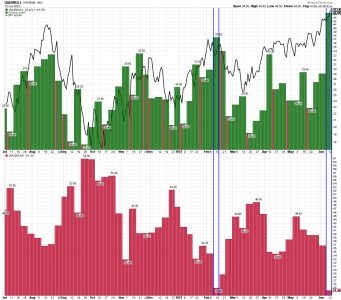
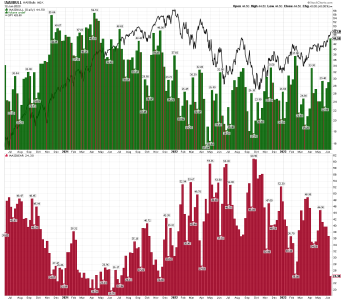
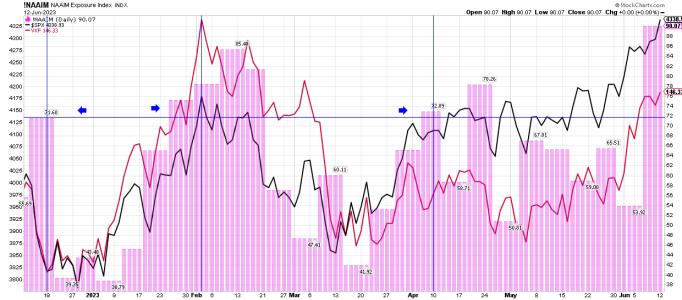
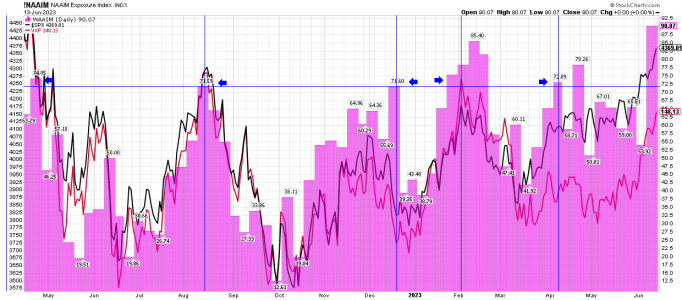
NAAIM/VXF/SPX - My sister-in-law told me yesterday we are in a new Bull Market. Hmmmmm..... These NAAIM investors must think so....


Sell in June?
Jeff Clark | Jun 9, 2023 | Market Minute | 2 min read

This dramatic shift in sentiment is happening just as the stock market is rallying to its highest level in 2023. It’s bumping into an obvious resistance level.

And, the Volatility Index (VIX) just generated a broad stock market sell signal.

Folks… this is NOT the time to be committing new money to the stock market.

This is a time to be cautious.

Trim some profits.

Raise the stop prices on current holdings.

And, for aggressive traders, maybe consider adding some short exposure.

It looks to me like the bear is gearing up to take another swipe at stock prices.

Stocks are likely to be lower a few weeks from now than where they are today.

Best regards and good trading,

https://www.jeffclarktrader.com/market-minute/sell-in-june/
 

Attachments

  • a.png
    a.png
    51.3 KB · Views: 55
VIX slid to 13.50 for the first time since Valentine's Day 2020.


It is unusual for VIX to drop to 13.50 in any bear market, even for a short period of time. Investors are convinced by media stories such as the one which was most popular this morning on the internet, claiming that the S&P 500 was allegedly in a "new bull market." While the market's behavior in the short run is always unknowable, you can be confident that the S&P 500 has been in the same "boring" bear market since January 4, 2022, and will continue in its bear market probably for about another 1-1/2 to 2-1/2 years.

Kaplan


True Contrarian
@TrueContrarian


May 18

Fun fact: The value of AAPL surpassed the value of the entire Russell 2000 for the first time in May 2023 (all two thousand companies' combined market capitalizations)

https://twitter.com/truecontrarian?lang=en

Wednesday, May 3, 2023
"At some price, an asset is a buy, at another it's a hold, and at another it's a sell." --Seth A. Klarman

Practically every week we get a new all-time record or two: 1) the lowest VIX (15.53) during a bear market; 2) the longest rebound from an intermediate-term bottom during a bear market (nearly 7 months); 3) frequent record ratios of the biggest U.S. megacap shares relative to the rest of the S&P 500 or relative to other indices of small- and mid-cap U.S. shares. The last statistic is especially ominous, since the degree of overcrowding into the biggest U.S. companies has consistently been proportional to the subsequent total percentage losses for the best-known U.S. equity indices and funds. The following three charts highlight the astonishing enthusiasm for the biggest U.S. companies in recent weeks:

https://truecontrarian-sjk.blogspot.com/

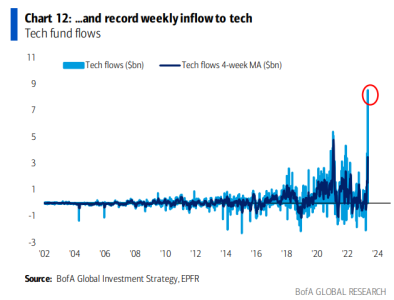
In 2021 the inflows into U.S. equity funds surpassed their total inflow from 2001 through 2020 combined. The all-time record average weekly net inflow into funds of large-cap technology shares, set in 2021, has been significantly surpassed in 2023:
 

Attachments

  • a.png
    a.png
    43.9 KB · Views: 55
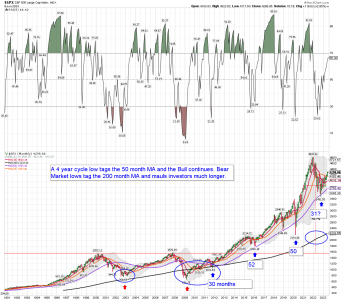
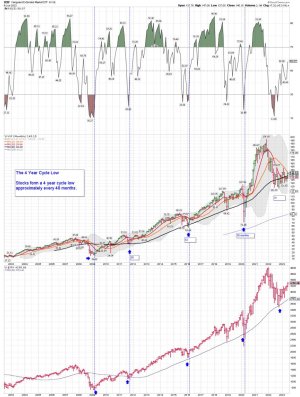
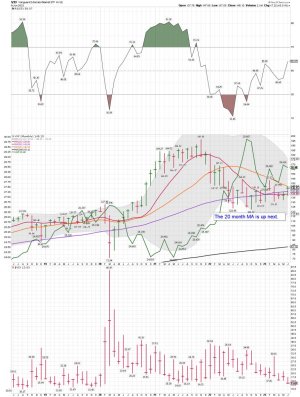
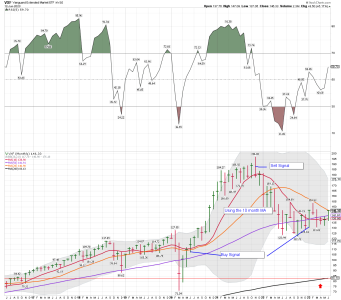
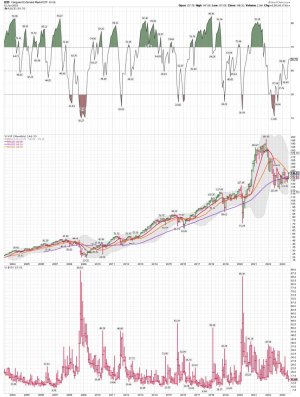
VXF/SPX monthly data: Tagging the 50 month MA and getting a nice bounce, one might think we are in a new bull market. We shall see how it all plays out in the months ahead.

VXF has been bouncing around the 50 month MA for around 14 months now.

VXF needs to move back above the 20 month MA. It has been below it for 18 months now..... Some LT investors use the 20 month MA for their buy/sell signals. I sure track it.
 

Attachments

  • a.png
    a.png
    101.7 KB · Views: 59
  • a.jpg
    a.jpg
    171.9 KB · Views: 60
  • a.jpg
    a.jpg
    164 KB · Views: 59
Not everyone believes we are in a Bull Market.....

This Market Reminds Me of 2000
Imre Gams | Jun 12, 2023 | Market Minute
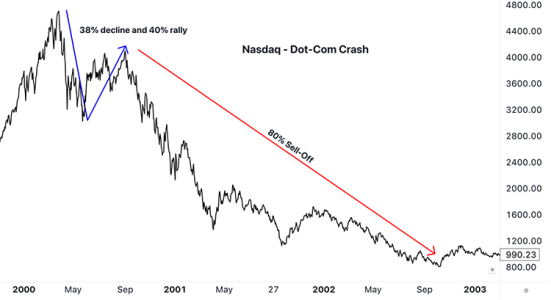
The more this bear market has stretched out, the more parallels there are with past crashes. Specifically, the markets right now are starting to look a lot like they did during the dot com sell-off.

Of course, no market movement is going to be exactly the same as what’s happened in the past, but there are some scary similarities here.

Let me give you a quick refresher on what happened back in 2000 with the Nasdaq index.

The Nasdaq topped out in March 2000 and viciously sold off over 38% in just two months, bottoming in May.

Investors were then able to breathe a big sigh of relief as the market rallied over 40% during the summer months. But any signs of optimism were ultimately short-lived.

The Nasdaq topped out by the end of August before another 80% crash. The bear market didn’t end up bottoming out till October 2002.

You can see how it all unfolded on the chart below.
https://www.jeffclarktrader.com/market-minute/this-market-reminds-me-of-2000/
 

Attachments

  • a.png
    a.png
    73.7 KB · Views: 56
Still plenty of room for more Bulls to get on the train....
 

Attachments

  • a.png
    a.png
    57.8 KB · Views: 48
  • a.jpg
    a.jpg
    63.8 KB · Views: 47
  • a.png
    a.png
    50.2 KB · Views: 47
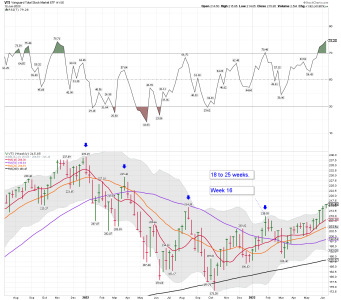
Still no buy signal if you are using the 20 month MA.
 

Attachments

  • a.png
    a.png
    62.9 KB · Views: 60
  • a.jpg
    a.jpg
    187 KB · Views: 60
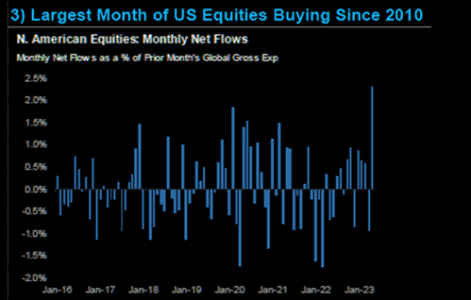
Largest month of equity buying since 2010
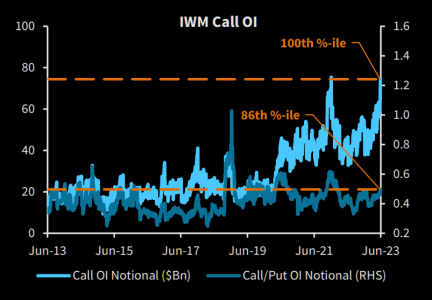
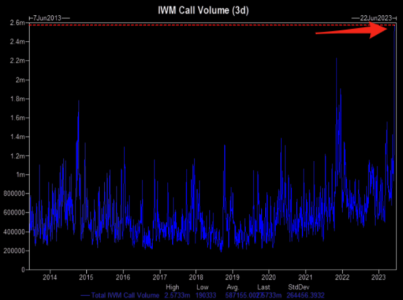
May ranked as the largest month of buying of US equities since 2010. US L/S net leverage rose to 12 month highs as a result of the buying. Mega-Cap TMT drove the bulk of the buying in North America pushing net exposure to these names to decade highs. Traditional defensive continued to be bought with May being the 4th largest month of buying since 2018.
 

Attachments

  • a.png
    a.png
    48.7 KB · Views: 58
The eagerness to participate in the U.S. stock market, and the level of U.S. equity ownership, were both higher this weekend than they had been at any time in recent years including all of the 2021-2022 peaks:
https://www.cnn.com/markets/fear-and-greed
 

Attachments

  • a.jpg
    a.jpg
    67.8 KB · Views: 80
  • a.png
    a.png
    67.1 KB · Views: 80
Back
Top