Bear Cave 2 (Bull Allowed)

Brace for Impact
Imre Gams | Jun 14, 2023 | Market Minute | 3 min read
Stock market investors have had a lot to be happy about in recent weeks.

In fact, since the start of the year, the S&P 500 is currently up about 13%.

But if you only looked at the combined performance of 493 of the stocks that make up the S&P 500, the market would be about flat for the entire year.

That means just seven companies have been responsible for almost all of this year’s gains.

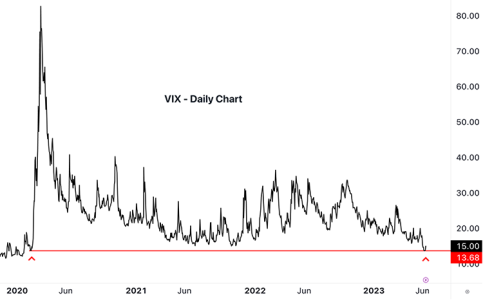
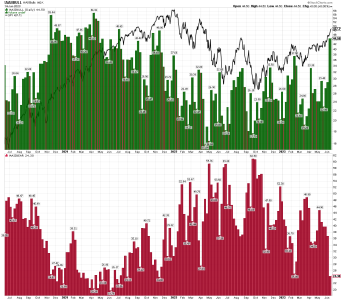
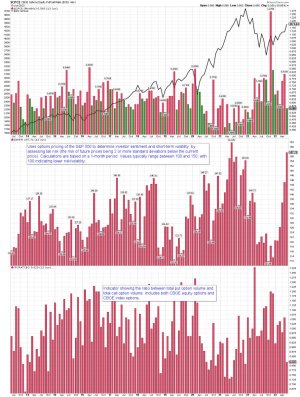
Unfortunately, my analysis of the VIX suggests that the second possibility might be relatively close at hand.

Let me walk you through a price chart of the VIX so you can see what I mean.
Unfortunately, my analysis of the VIX suggests that the second possibility might be relatively close at hand.
https://www.jeffclarktrader.com/market-minute/brace-for-impact/

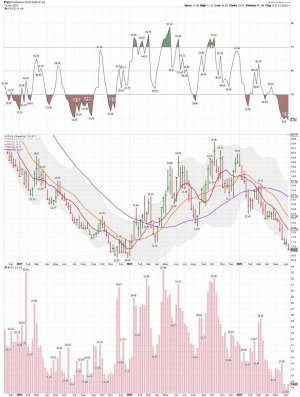
Buying PSQ below $10.90 and adding as we move lower.... ( Beer Money trade)

06/13/2023 Bought PSQ @ 10.8892
 

Attachments

  • a.png
    a.png
    60.9 KB · Views: 83
  • a.png
    a.png
    132.2 KB · Views: 83
  • a.png
    a.png
    79.7 KB · Views: 84
  • a.jpg
    a.jpg
    156.3 KB · Views: 84
Last edited:
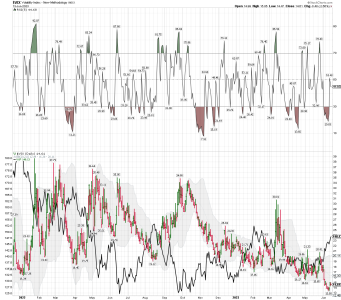
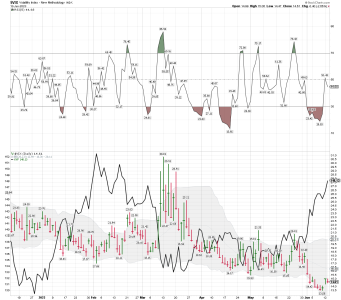
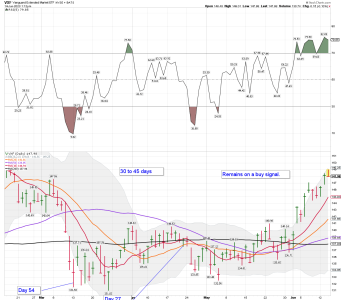
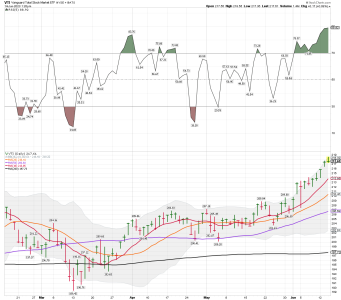
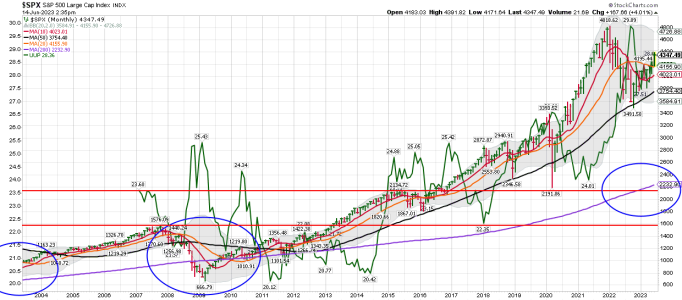
Waiting on the Fed...... I have a couple of small positions..... (VXX and PSQ) Also, I don't do Da-Wave, but track it from a few traders. I have my own trading system and all my daily charts remain on a buy signal. (VXF and VTI) are the two main indexes I trade at Vanguard. They are both on buy signals or hold some long shares. That doesn't make me Bullish or Bearish..... I just trade the signals.


Mac10
@SuburbanDrone
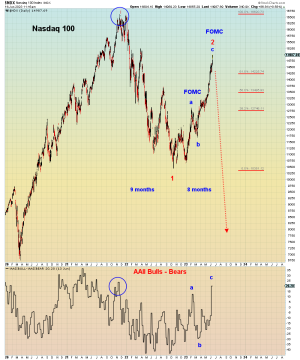
This is interesting - wave 'a' was also an FOMC meeting.

https://twitter.com/SuburbanDrone/status/1669001117177462786/photo/1
 

Attachments

  • a.png
    a.png
    105.3 KB · Views: 76
  • a.png
    a.png
    57.3 KB · Views: 76
  • a.png
    a.png
    65.9 KB · Views: 76
  • a.png
    a.png
    60.2 KB · Views: 76
Last edited:
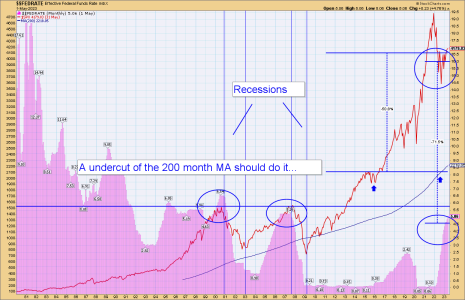
Two more coming? Takes rates to around 5.5% I will be watching the crazy crap in DC and the upcoming election.... OH BOY!
 

Attachments

  • a.png
    a.png
    48 KB · Views: 81
The move up continues......

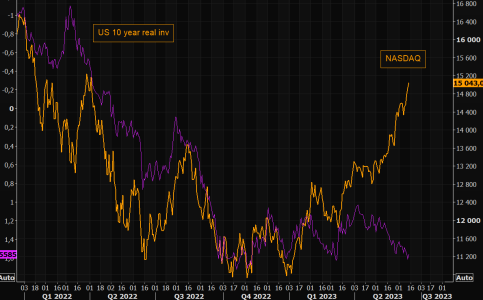
NASDAQ's real gap
Another day another widening of the gap between NASDAQ and real rates. Not a part of the narrative, at least not for now, but make sure to watch this closely.

Here we are
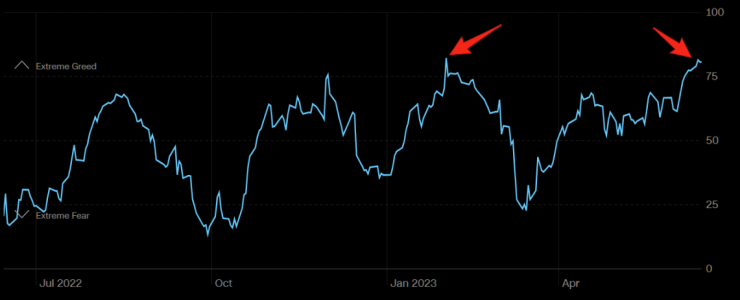
Extreme greed trading at levels last seen at February highs...but of course, back then we had no AI.
https://themarketear.com/newsfeed
 

Attachments

  • a.png
    a.png
    37.7 KB · Views: 99
  • a.png
    a.png
    70.9 KB · Views: 100
Bottom Line: The move up for VTI continues......

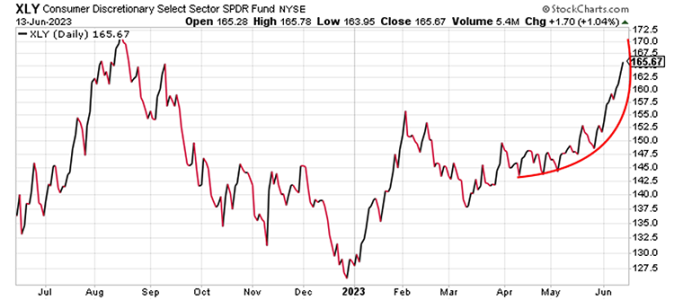
This Pattern Could Spell Trouble
Jeff Clark | Jun 15, 2023 | Market Minute | 3 min read

It’s rare to see this type of action in an exchange-traded fund that is diversified among several industries. And, it’s a good indication that the current rally – in this group and in the broad stock market in general – has gone a little too far, too fast.

Once this parabolic move exhausts itself, consumer discretionary stocks will come back down.

They’ll likely give up most, if not all, of the gains for the past two months.

Traders should avoid the impulse to chase these stocks higher right here. We’ll likely have a better chance to buy them at lower prices a few months from now.

Best regards and good trading,

https://www.jeffclarktrader.com/market-minute/this-pattern-could-spell-trouble/
 

Attachments

  • a.png
    a.png
    101.5 KB · Views: 106
  • a.jpg
    a.jpg
    150.1 KB · Views: 107
We shall see how the current pattern plays out. I'm still unable to post much..... We shall see how the next daily pattern plays out, and if we are heading down into the next ICL.

Good trading to all!
 

Attachments

  • a.png
    a.png
    115.4 KB · Views: 102
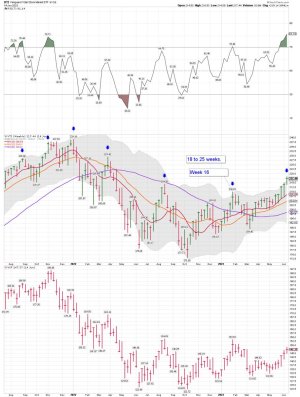
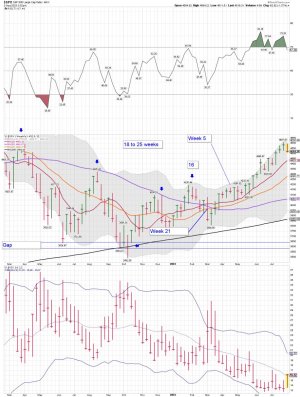
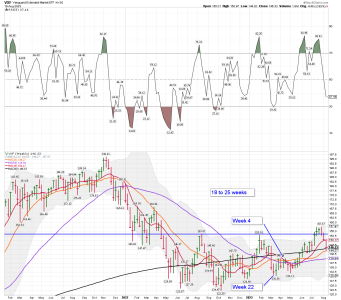
It has been a nice run since the buy signal, when the SPX moved above the 10 week MA. That makes the move up since the buy signal 19 weeks and still no sell signal. However, this cycle is looking tired and the patterns are indicating one should reduce some. We shall see if we get a sell signal soon.
 

Attachments

  • a.jpg
    a.jpg
    174.5 KB · Views: 102
A tad oversold in my opinion. A ST lower BB crash trade.
 

Attachments

  • a.jpg
    a.jpg
    179.5 KB · Views: 78
Last edited:
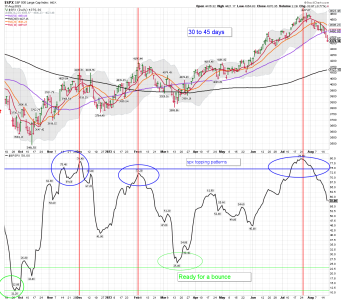
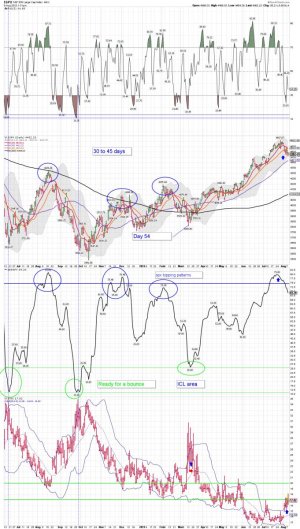
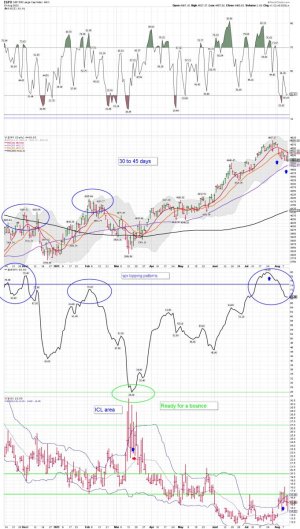
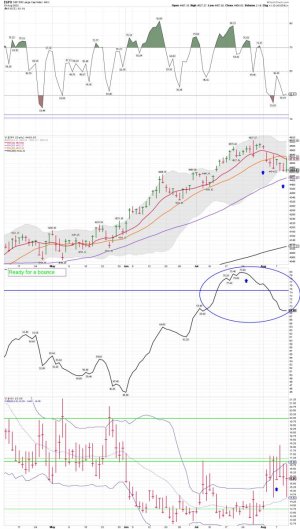
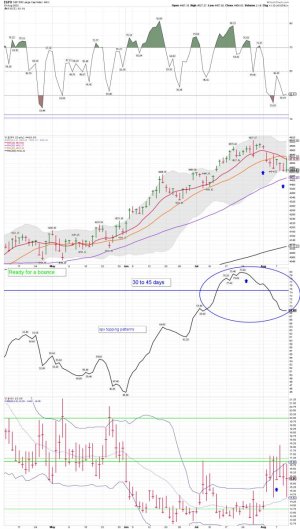
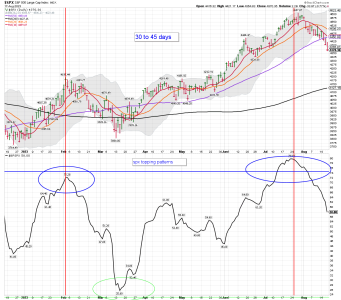
SPX daily: Day 5 since the sell signal if you are using the daily data and the 20 day MA for signals. We shall see how the next VIX buy signal plays out. The topping pattern signal proved once again to be a very good ST signal. In my opinion the weekly chart using the 10 or 20 week MA is better for TSP funds ( limited moves) but the daily is much better for trading accounts. I use the 10 week MA.


The second chart: A closer look....
 

Attachments

  • a.jpg
    a.jpg
    157.7 KB · Views: 92
  • a.jpg
    a.jpg
    120.3 KB · Views: 86
Last edited:
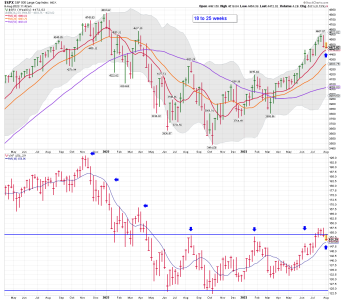
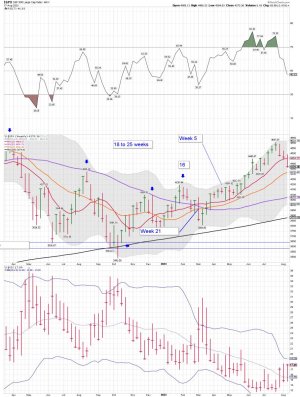
SPX/VXF weekly chart: Well, if you are using the 10 week MA for buy and sell signals...... We still "do not" have a sell signal. We shall see how the next cycle low plays out. This is week 20 since the last buy signal.
 

Attachments

  • a.png
    a.png
    61.2 KB · Views: 77
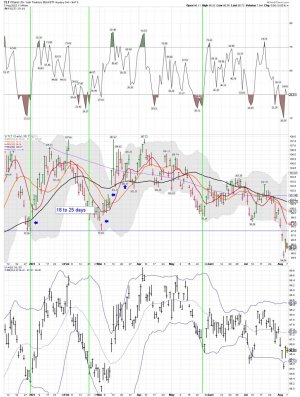
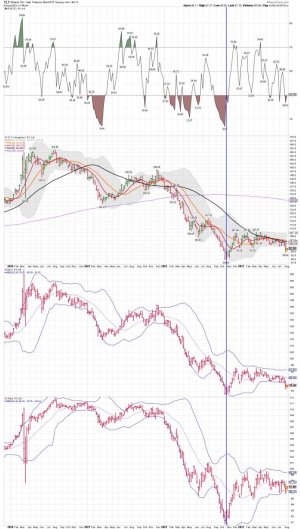
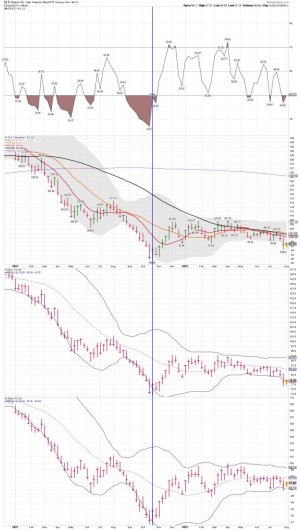
TLT/EDV/AGG weekly: Long for now....
 

Attachments

  • a.jpg
    a.jpg
    131.4 KB · Views: 77
  • a.jpg
    a.jpg
    110.5 KB · Views: 78
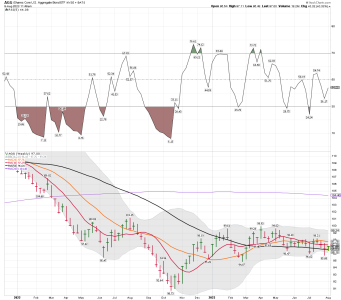
AGG weekly: Back above the 50 week MA..... About 30ish weeks for this ride close to the 50 week MA.
 

Attachments

  • a.png
    a.png
    61.2 KB · Views: 76
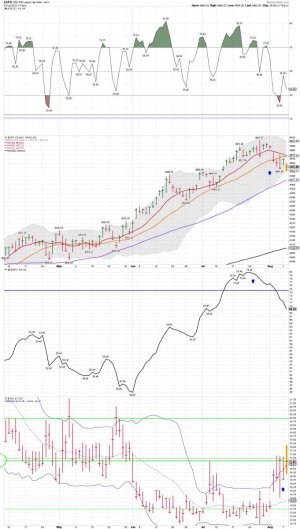
SPX daily sell signal: Today will be day 8 since the sell signal and the move below the 20 day MA. The VIX daily has produce a buy signal, but the topping pattern, based on other tops doesn't look like it has completed. We shall see what signal works out. I use the MAs and my SPX topping pattern chart for trading SSO and SDS. I also use cycle data for Risk Management. When to go big or reduce positions. Getting close to the 50 day MA on the daily chart. We shall see what happens if we get a tag or an undercut of the 50 day MA. Some might sell and others will look to be adding. I will be watching.

Jeff's VIX signal. A very good signal to track for trading accounts

This Signal is Nonsensical
Jeff Clark | Aug 8, 2023 | Market Minute | 2 min read
Keep an eye on the Volatility Index (VIX) this week. It’s on the verge of generating a broad stock market buy signal.

Maybe that doesn’t make any sense.

After all, the S&P 500 closed Friday at its lowest level in three weeks.
https://www.jeffclarktrader.com/market-minute/this-signal-is-nonsensical/
 

Attachments

  • a.jpg
    a.jpg
    144.6 KB · Views: 68
  • a.jpg
    a.jpg
    122 KB · Views: 65
  • a.jpg
    a.jpg
    123.4 KB · Views: 68
SPX daily: It's always best to wait for the turn and the next buy signal before buying during an ICL event.
 

Attachments

  • a.png
    a.png
    82 KB · Views: 52
SPX daily: A closer look..... A tag of the 200 day MA is very possible moving into an ICL.
 

Attachments

  • a.png
    a.png
    71.6 KB · Views: 59
SPX weekly: Week 3 of the move lower and the SPX remains above the 20 week MA.
 

Attachments

  • a.jpg
    a.jpg
    172 KB · Views: 60
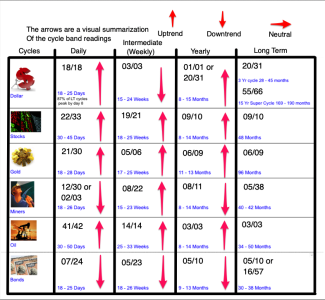
Some info about cycles. DCL= Daily cycle low - ( use the daily charts to trade) ICL = Intermediate cycle Low - (use the weekly charts to trade) YCL= Yearly cycle low - (use the monthly charts to trade)

https://lmtoolbox.wordpress.com/4-daily-intermediate-yearly-cycles/

You can sign up for likesmoney free updates...... Every sector is a tad different. I use this data for Risk Management. For Buy and Sell signals I use different data. I'm currently a sub with him..... It saves me time for tracking all the sectors I trade.

https://likesmoneycycletrading.blog/2023/08/17/potential-failed-daily-cycle/
 

Attachments

  • a.png
    a.png
    224.9 KB · Views: 61
The 8/19/23 Weekend Report Preview


Both the Nasdaq and the S&P broke below their June DCL’s on Friday.


Breaking below the previous DCL forms a failed daily cycle and confirms the intermediate cycle decline. Friday was day 38, placing stocks deep in their timing band for a daily cycle low. Stocks have “done enough” to satisfy the criteria for a DCL. A swing low and close above the breakdown level will signal the new daily cycle.

The question is did stocks “do enough” for an ICL and did stocks “do enough” for the YCL. This is something that I discuss in detail in the Weekend Report.


https://likesmoneycycletrading.blog/2023/08/19/the-8-19-23-weekend-report-preview-2/
 

Attachments

  • a.png
    a.png
    83.6 KB · Views: 59
  • a.jpg
    a.jpg
    161.7 KB · Views: 58
  • a.png
    a.png
    97.5 KB · Views: 59
Last edited:
Back
Top