Bear Cave 2 (Bull Allowed)

Viewpoints | January 24, 2023

AFTER A TIMEOUT, BACK TO THE MEAT GRINDER!
By Jeremy Grantham

My calculations of trendline value of the S&P 500, adjusted upwards for trendline growth and for expected inflation, is about 3200 by the end of 2023. I believe it is likely (3 to 1) to reach that trend and spend at least some time below it this year or next. Not the end of the world but compared to the Goldilocks pattern of the last 20 years, pretty brutal. And several other strategists now have similar numbers. To spell it out, 3200 would be a decline of just 16.7% for 2023 and with 4% inflation assumed for the year would total a 20% real decline for 2023 – or 40% real from the beginning of 2022. A modest overrun past 3200 would take this entire decline to, say, 45% to 50%, a little less bad than the usual decline of 50% or more from previous similarly extreme levels.

But this is just my guess of the most likely outcome. The real risk from here is in the unusually wide range of possibilities around this central point. I would suggest wide and asymmetric error bars around any such forecast. Regrettably there are more downside potentials than upside. In the worst case, if something does break and the world falls into a severe recession, the market could fall a stomach-turning 50% from here. At best there is likely to be at least a further modest decline, which by no means balances the risks. Even the direst case of a 50% decline from here would leave us at just under 2000 on the S&P, or about 37% cheap. To put this in perspective, it would still be a far smaller percent deviation from trendline value than the overpricing we had at the end of 2021 of over 70%. So you shouldn’t be tempted to think it absolutely cannot happen. (For an example of a real nightmare, in 1974 the S&P troughed at below 7 times earnings!)
https://www.gmo.com/americas/resear...a-timeout&mc_cid=3631838f70&mc_eid=5b348a9ca0
 
Time to hedge the downside

Bearish arguments once again sound a little more appealing. Some of them inevitably have to do with similarities with the August peak (yes, there are a few). However, given that it is a huge macro week, it is probably not the best risk/reward time to go outright delta-one short. We would prefer to implement our view via volatility markets. Let's have a look at the latest updates on why this rally might be coming to an end and how to hedge the downside.

https://themarketear.com/

A Leading Indicator Shows This Market Is on Shaky Ground
High-yield bonds, also known as “junk bonds,” are flashing another warning sign…

Junk bonds help to gauge investors’ appetites for risk. When junk is rallying, it’s a “risk-on” environment – and stocks tend to do well.

But when junk bonds are falling in price, investors are reducing their risks. And in this sort of “risk-off” environment, stocks tend to fall.

The good thing for traders is that the action in junk bonds tends to precede the action in the stock market by anywhere from a few days to a couple of weeks.

So, traders can use the action in junk bonds as an indicator of the future direction of stocks.

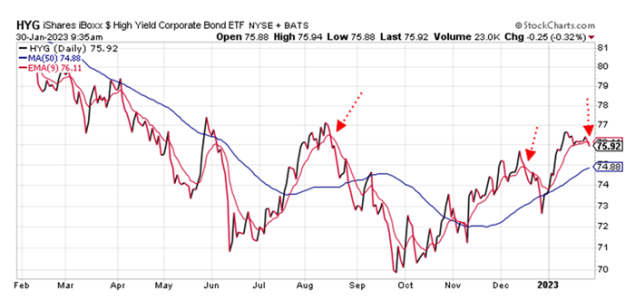
And right now, junk is looking lower. Look at this chart of the iShares iBoxx High Yield Corporate Bond ETF (HYG)…

https://www.jeffclarktrader.com/mar...dicator-shows-this-market-is-on-shaky-ground/
 

Attachments

  • a.png
    a.png
    33.3 KB · Views: 146
  • a.png
    a.png
    90.6 KB · Views: 147
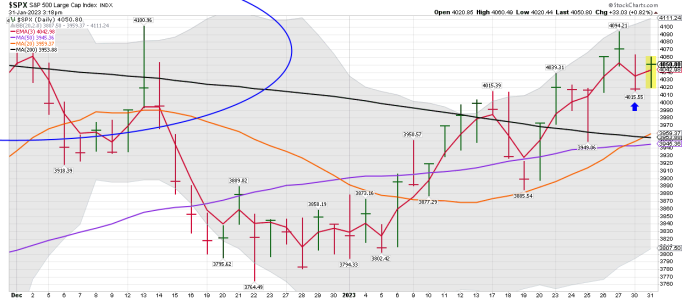
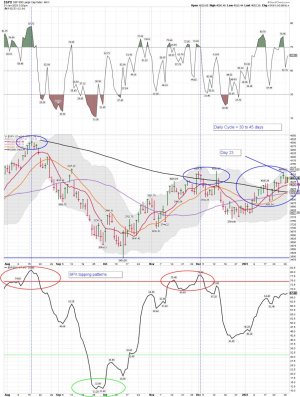
SPX daily: The SPX remains above the 10, 20, 50, and 200 day MAs. Hold longs if using the 10 and 20. The 3 ema signal a sell signal yesterday so I bought some VXX. We shall see how that plays out, but it looks like it just might be a whipsaw for ST trading. Most of my trading is ST = ( Short term). I day trade often.


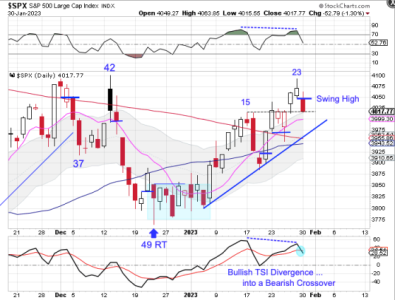
Swing High
Stocks formed a daily swing high on Monday.

Stocks did get a bit stretched about the 10 day MA on Friday and may be simply allowing the 10 day MA to catch up to price. However a close below the breakout level would be a bearish signal. At 24 days, stocks are approaching their timing band for a daily cycle decline. If stocks deliver bearish follow through and break below the daily cycle trend line that will signal the daily cycle decline. Stocks are currently in a daily uptrend. They will remain in their daily uptrend unless they close back below the lower daily cycle band.
 

Attachments

  • a.png
    a.png
    101 KB · Views: 150
  • a.png
    a.png
    36.9 KB · Views: 149
  • a.jpg
    a.jpg
    167.8 KB · Views: 150
Last edited:
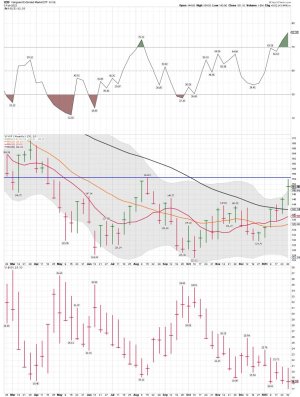
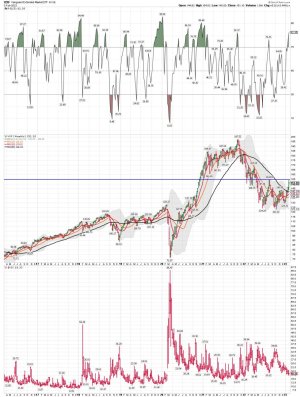
VXF weekly: S Fund.... This is week 4 since the VXF buy signal. We shall see if VXF can move above the 159.49 marker. Retail sure loves stocks again.... However, we are on a buy signal so one should just trade the signals.
 

Attachments

  • a.jpg
    a.jpg
    148 KB · Views: 125
  • a.jpg
    a.jpg
    169 KB · Views: 125
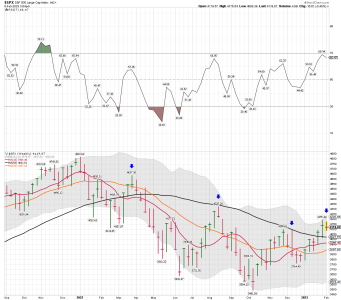
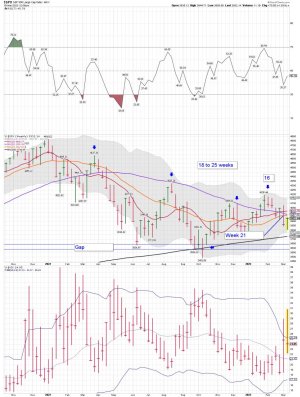
SPX weekly: It has been six weeks since the SPX weekly price moved back above the 20 week MA. We shall see if we get a back test of the 50 week MA in the days ahead.
 

Attachments

  • a.png
    a.png
    60 KB · Views: 107
Long some SPX/C fund for a trade. I have been doing lots of ST trading and that is not something that can be done in a TSP account. I will post some market thoughts when I see a possible trade using TSP funds. This is still a high risk trade, with no daily buy signal. However, with the VIX data and a possible DCL in place I like the odds for a ST trade.

SPX and the VIX: A ST signal to buy the SPX or cover ST shorts just generated a signal and remains in play. We shall see how it plays out. The SPX still remains below the 10,20, 50 and 200 day MA's so still no daily buy signal. However, I'm trading VST and ST signals.

I do use this indicator as part of my overall trading system.

How to Trade the New VIX Buy Signal

Bollinger Bands (the blue lines) indicate the most probable trading range for a stock or an index. Whenever a chart moves outside of its Bollinger Bands, it signals an “extreme” condition. In the case of the VIX, these extreme conditions trigger buy and sell signals for the broad stock market.

Sell signals occur whenever the VIX closes below its lower Bollinger Band and then closes back inside the bands. Buy signals occur when the VIX closes above its upper Bollinger Band and then closes back inside the bands.

Yesterday marked the fourth VIX buy signal of 2018 so far. The red circles on the chart encompass each buy signal.

https://www.jeffclarktrader.com/market-minute/how-to-trade-the-new-vix-buy-signal-2/

For the record: I DO NOT make trading decisions or trades based on what economists, opinions from others, talking heads on TV or other Guru's have to say. That doesn't mean I don't respect their opinion. My system is mechanical and it generates buy and sell signals and I determine the size of the trade based on the odds of a possible winner. Now I trade the markets based on my overall indicators, and my trading system...win, lose or draw.

Most don't have the time to do what I do. With that said, Tom has some good overall TSP services that folks can use and there is some very good folks here making moves in their TSP accounts. I trade in realtime at Vanguard using VTI, and VXF, but on occasion move some TSP Funds.
 

Attachments

  • a.jpg
    a.jpg
    138.6 KB · Views: 60
Last edited:
SPX weekly: Still NO BUY SIGNAL for a MT trade.... "IF" the DCL holds and the index moves back above the 10, 20, 50, and 200 day MA's I will hold or add.

Good Trading, and this is still a high risk trade, but with above average odds to be a winner. LOL... That doesn't mean it will be....
 

Attachments

  • a.jpg
    a.jpg
    173.8 KB · Views: 60
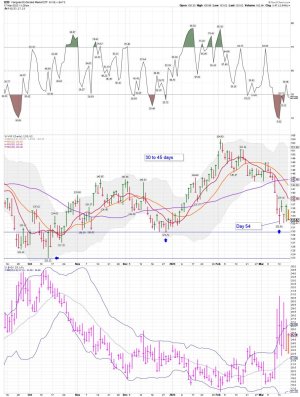
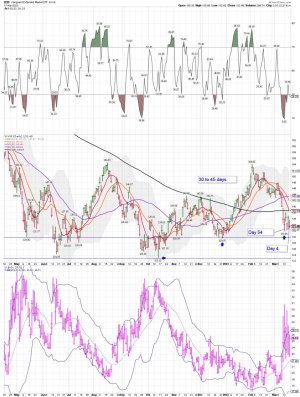
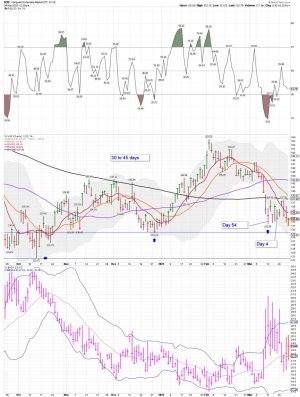
VXF daily: Back testing the day 54 low or headed to test the Oct low? STBD.... We shall see if a higher low holds for this cycle.

Bottom Line: VXF daily remains on a sell signal.
 

Attachments

  • a.jpg
    a.jpg
    169.6 KB · Views: 52
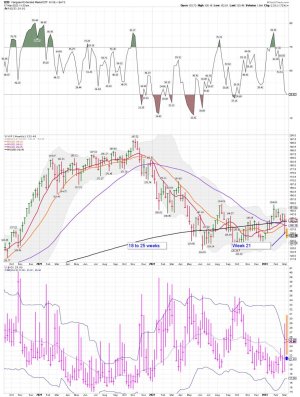
VXF weekly: At week 22 it remains on a sell signal and is below its 10,20,50 and 200 week MAs.

I bought some shares of VXF at Vanguard for a possible ICL..... LOL.... possible! This is still a high risk trade. I will let the market decided if I should sell or add shares based on how this DCL plays out, and "IF" the ICL is in.


Dear robo

The following order executed on 03/17/2023 at 10:35 AM, Eastern time:

Account: 0330
Transaction type: Buy
Order type: Market
Security: VANGUARD EXTENDED MARKET ETF (VXF)
Quantity: share(s)
Price:* $133.76
 

Attachments

  • a.jpg
    a.jpg
    175.1 KB · Views: 51
Cycles:

The 3/18/23 Weekend Report Preview

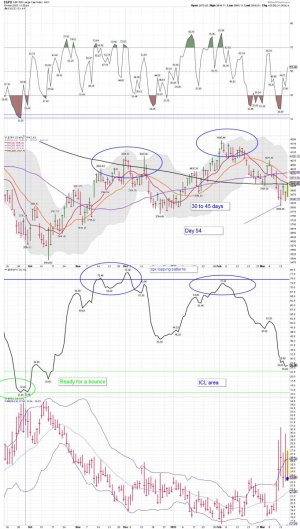
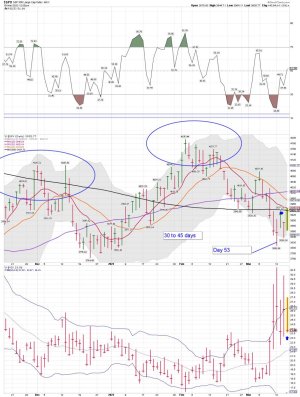
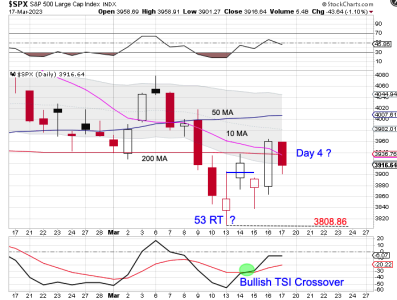
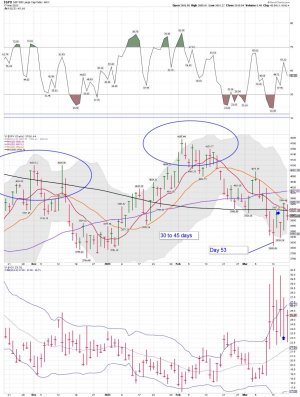
Stocks printed their lowest point on day 53, placing them very deep in their timing band for a DCL. Stocks formed a swing low on Tuesday, then closed above the converging 10 day MA and 200 day MA on Thursday to signal the new daily cycle. However, stocks closed back below both MA’s on Friday — raising the possibility that the DCL has not yet formed.

Stocks deliver bearish follow through to break below the day 53 low of 3808.86, that will extend the daily cycle decline. Stocks will need to close back above both the 200 day MA and the declining 10 day MA label day 53 as the DCL. Stocks will still need to close above the 50 day MA in order for any rally to be sustained. Stocks are in a daily downtrend. They will remain so unless they can close back above the upper daily cycle band.
 

Attachments

  • a.png
    a.png
    36.5 KB · Views: 40
VXF daily: We shall see how this daily cycle and the ST VIX buy signal plays out. I'm also watching to see if the higher low holds. It might not..... Bear markets have some nice swings to trade, but can cause you some big losses too. When you buy early in a Bull Market the Bull saves you. When you buy early in a Bear Market, sometimes the Bear mauls your account, and goes on to make a lower high.
 

Attachments

  • a.jpg
    a.jpg
    191.7 KB · Views: 58
Last edited:
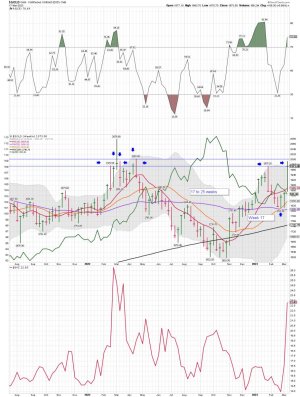
Gold weekly and the $2000 dollar level. We shall see if gold can close above the $2000 dollar level next week.
 

Attachments

  • a.jpg
    a.jpg
    177.5 KB · Views: 52
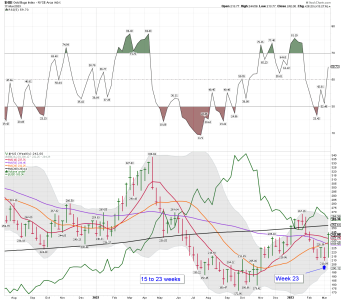
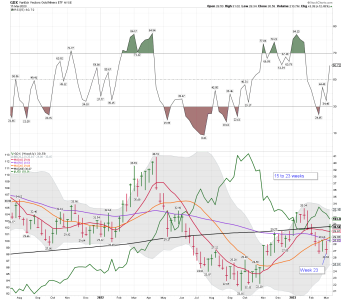
GDX weekly: HUI and GDX move together. Both are now testing their 200 week MAs.
 

Attachments

  • a.png
    a.png
    75.5 KB · Views: 64
VXF daily: Unable to move above the 200 day MA, and it's now day 3 since moving below the 10 day MA. Another whipsaw if you be using the MAs to trade.

VXF daily bottom line: It be back on a sell signal using my system.
 

Attachments

  • a.jpg
    a.jpg
    172.6 KB · Views: 40
USD daily: A DCL and a higher low? We shall see....The dollar moving higher will put additional selling pressure on some indexes.

Flat VXF in all accounts, and waiting for the next HIGH RISK trade... I continue to trade using Bear Market rules.
 

Attachments

  • a.jpg
    a.jpg
    141.3 KB · Views: 40
VXF weekly: Remains on a sell signal and remains below its 10,20,50, and 200 week MAs. A bounce or do we undercut the 122.72 low marker.... I don't know, but I will be looking for the next buy signal.

VXF weekly bottom line: MT trading signals for VXF remain on a sell signal as VXF continues its move lower.

I have NO MT positions for VXF.

Very tough to trade in a Bear Market.
 

Attachments

  • a.jpg
    a.jpg
    176.6 KB · Views: 39
Back
Top