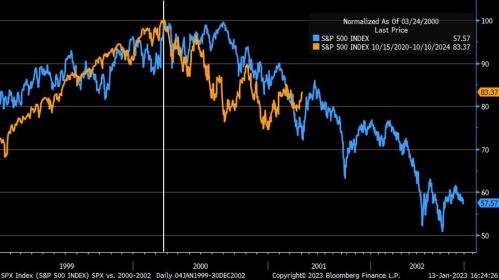
Bear Cave 2 (Bull Allowed)

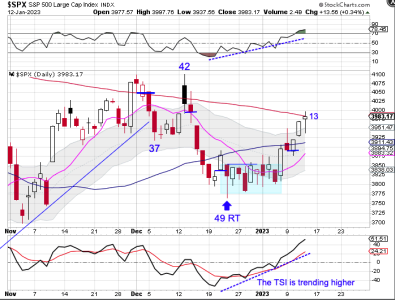
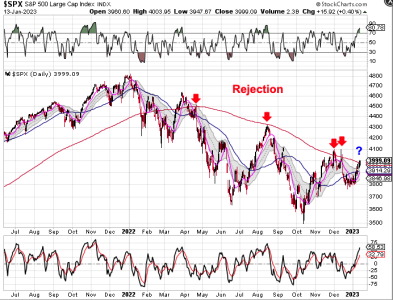
SPX daily: Starting the week out with a nice move back above the 50 day MA. We shall see if buyers continue to come in. The bigger test will be if the SPX can move back above the 200 day MA and continue higher for more then just a few days.

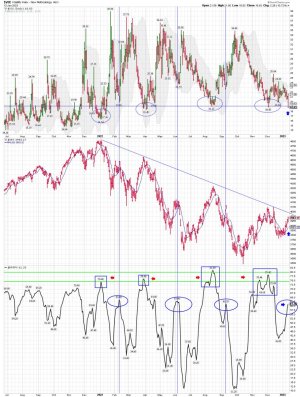
VIX daily: Holding around 21ish....
 

Attachments

  • a.jpg
    a.jpg
    195.2 KB · Views: 96
  • a.jpg
    a.jpg
    180.9 KB · Views: 97
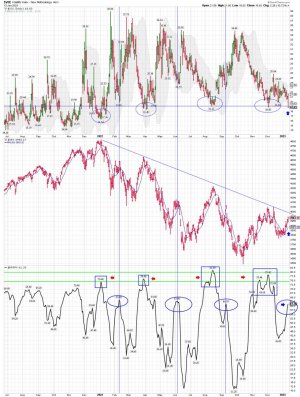
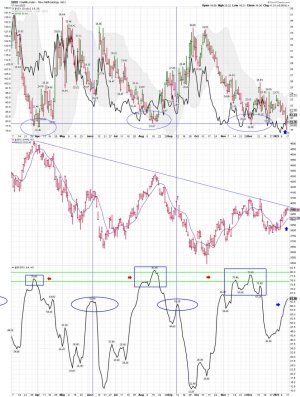
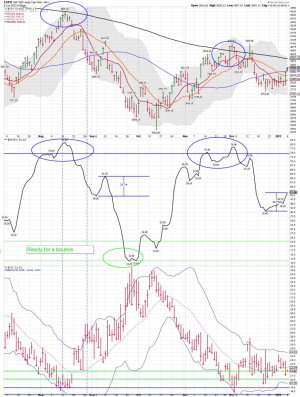
VIX daily: IF the pattern plays out the next move is down. However, my magic 8 ball is broken.

Jeff's VIX “crystal ball” data is a excellent trading indicator to track. Another indicator to help you determine yours odds of holding a position. Long or Short..... Now is a time to be more nimble.

Our Crystal Ball Is Showing Contrarian Sentiment
By Jeff Clark, editor, Market Minute

The crystal ball is warning us not to trust the current stock market rally.

Friday’s big bounce following the non-farm payrolls report pushed the S&P 500 to its highest level since mid-December. It broke above several resistance levels – like the 9-day and 20-day exponential moving averages (EMAs).

And it changed the sentiment of many of the financial television talking heads – who were wildly bearish on Thursday but flipped to bullish following Friday’s move.

Most of the talking heads are now looking for higher stock prices over the next several weeks.

But the crystal ball suggests otherwise…
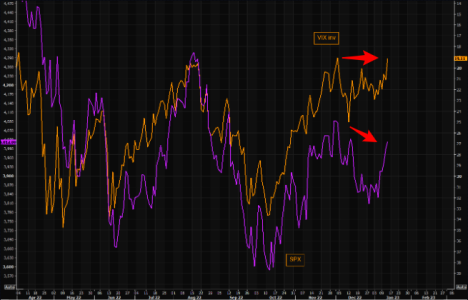
When VIX calls are far more expensive than the equivalent put options, it shows VIX option traders expect the index to move sharply higher over the next few weeks.

And a rising VIX (rising volatility) usually accompanies a falling stock market.

So, if you’re making short-term bullish bets, be careful. The VIX “crystal ball” has a very good track record… I’m betting it’ll prove correct this time, as well.

Best regards and good trading,
https://www.jeffclarktrader.com/market-minute/our-crystal-ball-is-showing-contrarian-sentiment/
 

Attachments

  • a.jpg
    a.jpg
    180.8 KB · Views: 76
  • Magic 8.jpg
    Magic 8.jpg
    19.9 KB · Views: 69
Last edited:
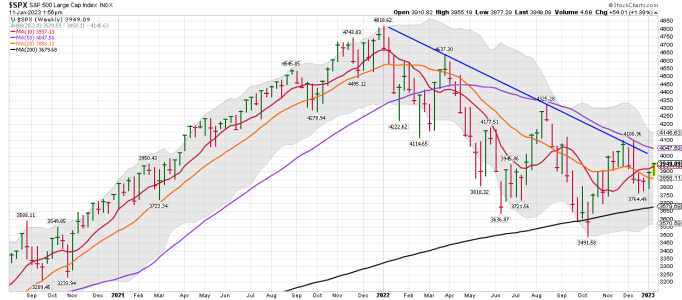
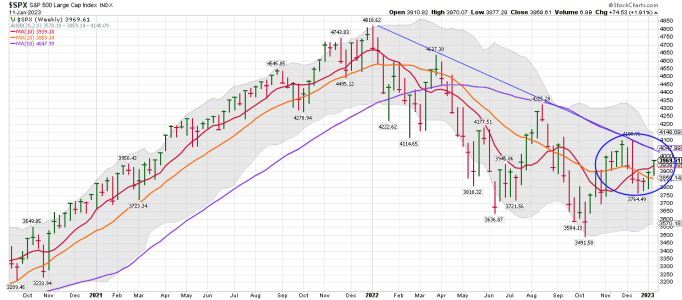
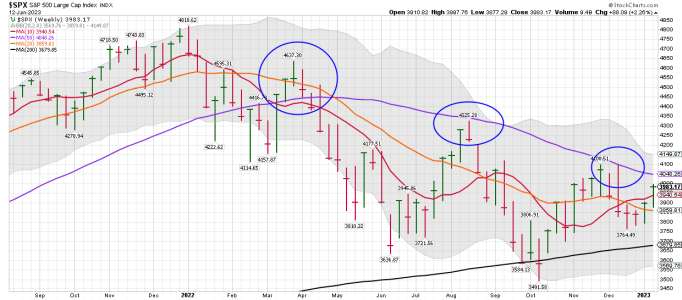
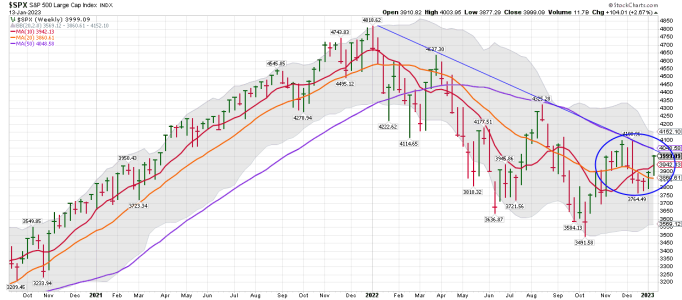
SPX weekly: Back above the 10 and 20 week MA. A buy signal if you are using the weekly data. We shall see if the SPX can tag the 50 week MA.


David Rosenberg
@EconguyRosie

Jan 10
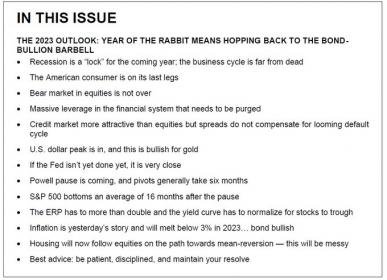
SPECIAL REPORT -- The 2023 Outlook: Year of the Rabbit Means Hopping Back to the Bond-Bullion Barbell

My advice for the coming year is to be patient and disciplined.
https://twitter.com/EconguyRosie?lang=en
 

Attachments

  • a.png
    a.png
    42.4 KB · Views: 60
  • a.jpg
    a.jpg
    20.9 KB · Views: 60
Waiting on the CPI data: A good report is expected by many of the talking heads, and has mostly been priced in. However, a Bearish report could send the markets lower. I will mainly be watching the weekly chart for now, but will be looking for some ST trades to take if the market makes a big move based on the numbers. We shall see how it plays out.

Placing your CPI bets

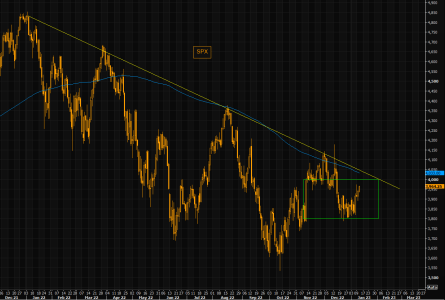
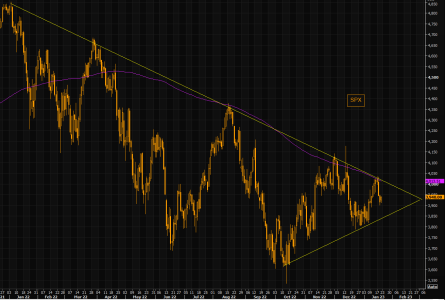
SPX continues trading inside the 3800/4k range. Obviously it is all about the CPI print tomorrow. Supports are 3900 and 3800. Big resistance is the negative trend line and the 200 day moving average around the 4050 level.
https://themarketear.com/
 

Attachments

  • a.png
    a.png
    42.8 KB · Views: 63
  • a.png
    a.png
    41.8 KB · Views: 63
Last time VIX was here...
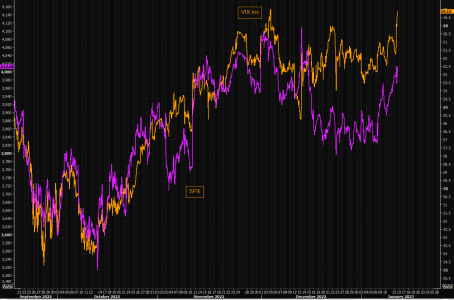
Expect to see a few of those calls soon, but they are wrong. Volatility is mean reverting, while the underlying assets can trend. Anyway, the VIX is puking further today and could be closing at the lowest levels since April 2022. Second chart shows the slightly shorter term view. The gap between VIX and SPX that started forming in mid December remains wide as people "suck fear" out of this market.
https://themarketear.com/
 

Attachments

  • a.png
    a.png
    78.9 KB · Views: 54
  • a.png
    a.png
    54.8 KB · Views: 54
VIX daily: The VIX closed under 19ish... We shall see how this pattern plays...... Will it be different this time? Waiting to see....
 

Attachments

  • a.jpg
    a.jpg
    204.5 KB · Views: 66
SPX weekly/daily charts: I'm mainly watching the weekly..... However, another go at the 200 day MA on the daily chart today.... It looks good so far as we are still early in the daily cycle.
 

Attachments

  • a.png
    a.png
    38.7 KB · Views: 72
  • a.jpg
    a.jpg
    181.7 KB · Views: 74
1st Attempt At The 200 DMA

Stocks managed to close above the 50 day MA on Tuesday then delivered bullish follow through Wednesday and Thursday — being halted that the declining 200 day MA.

This is the first attempt to break above the 200 day MA during this daily cycle. The previous daily cycle did make several attempts to break above the 200 day MA. Those attempts occurred late in the timing band for a DCL, which lowered the odds of a successful breakout. At day 13, stocks have plenty for a breakout and bullish follow through. Stocks are now in a daily uptrend. A close above the 200 day MA will indicate continuation of the daily uptrend and signal a cycle band buy signal.
https://likesmoneycycletrading.wordpress.com/2023/01/12/1st-attempt-at-the-200-dma/
 

Attachments

  • a.png
    a.png
    46.6 KB · Views: 74
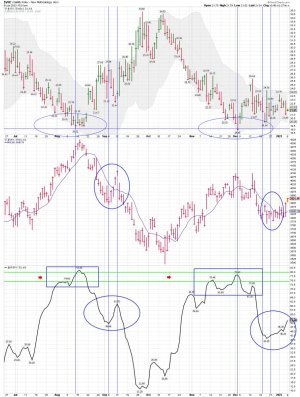
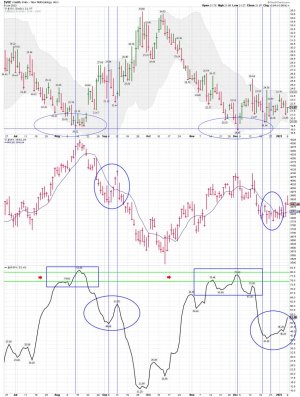
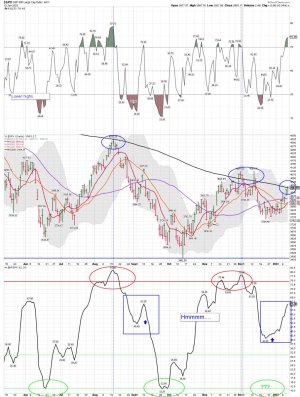
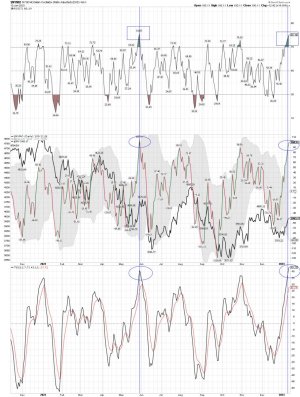
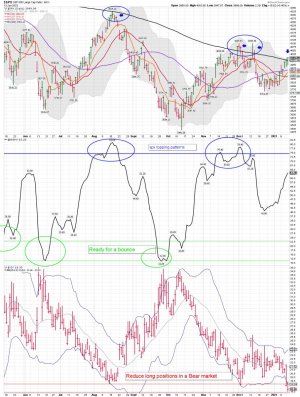
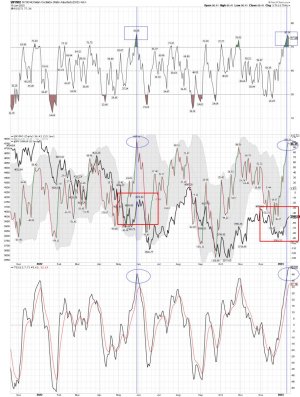
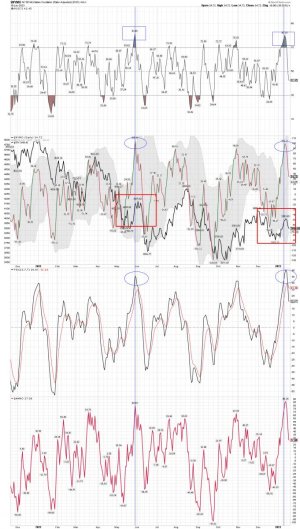
$NYMO and the SPX pattern for ST trading. In my opinion, a high NYMO in a Bear Market means it's time to take some profits if you are long. Well, that is my opinion, and it's for ST trading in a Bear Market. We shall see how it plays out, and if the SPX moves back down to the 10 day MA in the days ahead. Also, keep your eye on the VIX.
 

Attachments

  • a.jpg
    a.jpg
    179.2 KB · Views: 74
  • a.jpg
    a.jpg
    204.5 KB · Views: 73
Last edited:
SPX daily and the 200 day MA.

Stocks Closed Above The 200 DMA

Stocks closed above the 50 day MA on Tuesday then delivered bullish follow through Wednesday, Thursday and Friday — closing above the declining 200 day MA on Friday.

Stocks have consistently been rejected by the 200 day MA since April. Closing above the 200 day MA is a potential game changer. Any bullish follow through would indicate an end to the bear market. There are some canaries in the coal mine that point to this, which I covered in The Weekend Report.

https://likesmoneycycletrading.wordpress.com/2023/01/14/stocks-closed-above-the-200-dma/
 

Attachments

  • a.png
    a.png
    61.1 KB · Views: 66
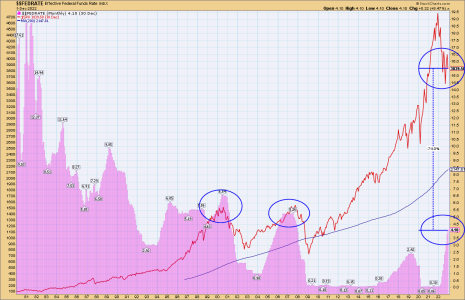
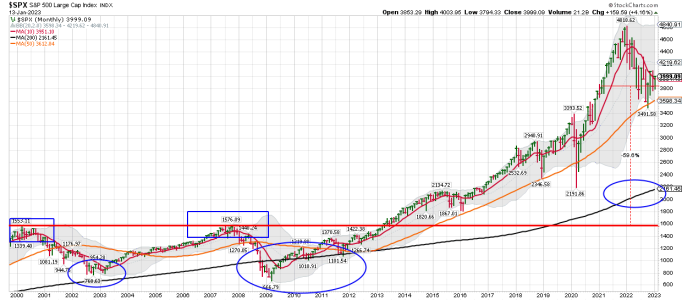
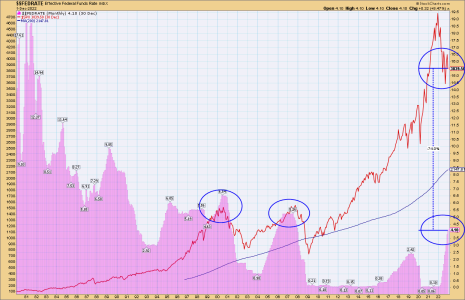
SPX and the 200 dma: Another go at the 200 day MA. Some are thinking the Bull is back and the Fed will soon slow or stop increasing rates. Note the historical Fed rate chart and the SPX chart below. The pattern tells me the Fed is not done and the SPX is going to move lower. We shall see if it's different this time. The Fed helped blow this bubble, and is now trying to let some air out of this monster Bull they helped blow.

The SPX monthly and weekly are both back above their 10 month/week MA's. So things are looking better for the SPX. We shall see how it all plays out, and if the Bear Market is over.

I currently have NO SPX long positions. The $VIX tagged 18ish as buyers moved the SPX back above some key MA's this week. The daily, weekly, and monthly, are all looking good if you just use the MA's.
 

Attachments

  • a.jpg
    a.jpg
    218.1 KB · Views: 72
  • a.png
    a.png
    44.4 KB · Views: 70
  • a.png
    a.png
    41.7 KB · Views: 72
  • a.png
    a.png
    39.9 KB · Views: 68
SPX daily: It does look good if you use the 10 and 20 day MA's for your buy signals. It's day 6 since moving back above the 10 and 20 day MA and producing a buy signal. We shall see how it plays out. The move back above the 200 day MA should bring in some additional buyers, and the FOMO crowd are already chasing.
 

Attachments

  • a.jpg
    a.jpg
    203.1 KB · Views: 62
Feeling shorty
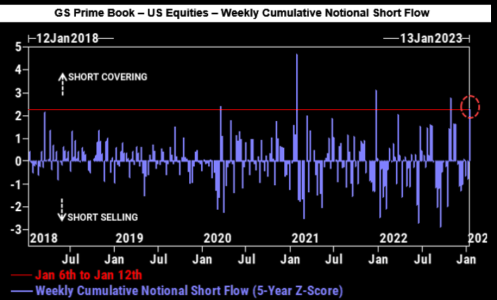
We have seen some brutal short covering moves over the past week. GS sales writes: “US equities have seen 5 straight days of short covers. In cumulative $ terms, overall short book saw the largest 5-day covering since mid-November (98th percentile 5-yr). Hedge funds actively unwound risk in US equities driven by short covers in Macro Products and Single Stocks." And the year has just started...

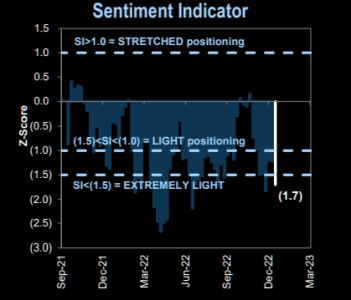
Bears beware
Despite this week's rally the all important Goldman sentiment signal registers one of its most negative signals over the past few months. Readings below -1 are normally associated with subsequent rallying equities


https://themarketear.com/
 

Attachments

  • a.png
    a.png
    123.5 KB · Views: 81
  • a.png
    a.png
    37.7 KB · Views: 77
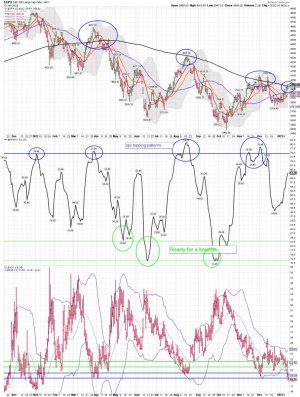
SPX and the $NYMO pattern: We shall see how this plays out the rest of the month....


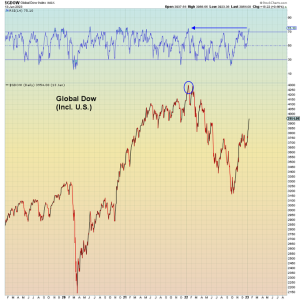
The Global Dow is the most overbought on momentum (RSI) since the all time high exactly a year ago pre-MLK holiday.

Bulls learned nothing in 2022.
https://twitter.com/SuburbanDrone/status/1615043170731196417/photo/1
The Global Dow is the most overbought on momentum (RSI) since the all time high exactly a year ago pre-MLK holiday.

Bulls learned nothing in 2022. (Second Chart)
 

Attachments

  • a.jpg
    a.jpg
    180 KB · Views: 79
  • a.png
    a.png
    183.7 KB · Views: 79
We shall see how the Fed pilots a soft landing...... I don't agree with this guy, but the market is sure watching the Fed. NO ONE knows for sure how this will play out. The current crap going on in DC in the house could causes some crazy moves. My charts tells me the FED is not done.... We shall see how it all plays out. It should be good for trading, but investors are probably not going to like the action.

The Fed: The Fed Pause vs. The Fed Pivot

https://www.youtube.com/watch?v=YZ8ZapkRtsc&t=3s
 

Attachments

  • a.png
    a.png
    44.4 KB · Views: 66
Kaplan's latest:

The most reliable bear-market signals are ringing loudly of further losses.

VIX, an important signal of investor fear, hasn't even approached 40 so far in the current bear market. VIX slid to an intraday low of 18.01 on January 13, 2023, a one-year bottom. VVIX, also known as the VIX of VIX, has recently been rebounding from a multi-year nadir. We haven't had anywhere near the typical heavy net outflows that have characterized every bear-market bottom in history, nor the intense levels of buying by top corporate executives which had featured so prominently at major bottoms including March 2009 and March 2020 and were far more prevalent at minor bottoms such as December 2018. The failure by average investors to be worried about additional losses, and the indifference by insiders in accumulating shares near recent lows, are both clear signs that additional substantial losses still lie ahead.
https://truecontrarian-sjk.blogspot.com/
 

Attachments

  • a.jpg
    a.jpg
    187.1 KB · Views: 64
Still watching to see how this pattern plays out.

As Goes January, So Goes the Year

These are momentum-based indicators that help determine overbought and oversold conditions.

Readings of more than 60 indicate severely overbought conditions and often precede large declines in the markets. Readings of less than -60 express extremely oversold conditions and usually lead to strong bounces in stock prices.

Both indicators closed in extremely overbought territory last Friday.

This is the sixth time in the past year that both the NYMO and the NAMO have been above 60 at the same time.
https://www.jeffclarktrader.com/market-minute/as-goes-january-so-goes-the-year/
 

Attachments

  • a.jpg
    a.jpg
    146 KB · Views: 48
SPX - getting very tight
Time for breaking out of this "eternal" range market? SPX is moving tighter and tighter inside the dynamic formation. Support at 3900, resistance at 4k.
https://themarketear.com/
 

Attachments

  • a.png
    a.png
    43.2 KB · Views: 38
Back
Top