Bear Cave 2 (Bull Allowed)

Hammer time?
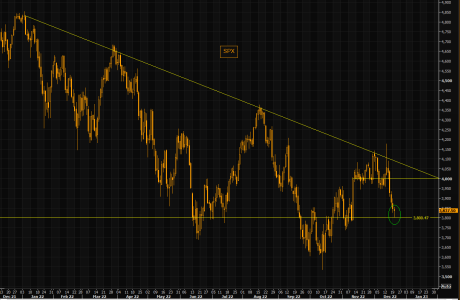
Everybody is scared about the downside in markets, but do you realize we are down 8% since highs 6 sessions ago? Why not a hammer candle right on the big 3800 level, if nothing, just to frustrate the crowd that gave up on Santa ?
https://themarketear.com/
 

Attachments

  • a.png
    a.png
    40.6 KB · Views: 47
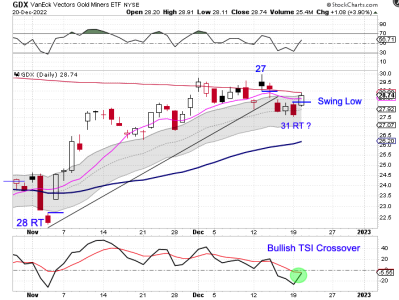
The Miners Need To Cross The Line

The Miners formed a daily swing low on Tuesday.

The Miners printed their lowest point on Monday, day 31. That places them in their timing band for a DCL. The decline into the day 31 low did not retrace to the 38 fib level which makes me a bit suspicious that day 31 was a DCL. However, the Miners did close back above the 10 day MA. The Miners are currently in a daily uptrend. A close above the 200 day MA will indicate a continuation of the daily uptrend and signal a cycle band buy signal — which we would then label day 31 as the DCL.

https://likesmoneycycletrading.wordpress.com/2022/12/20/the-miners-need-to-cross-the-line/


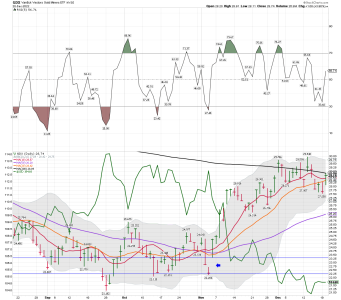
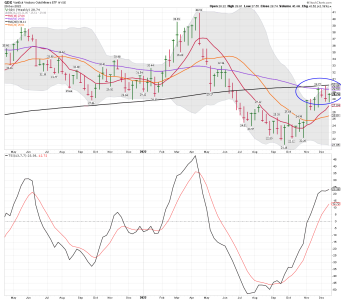
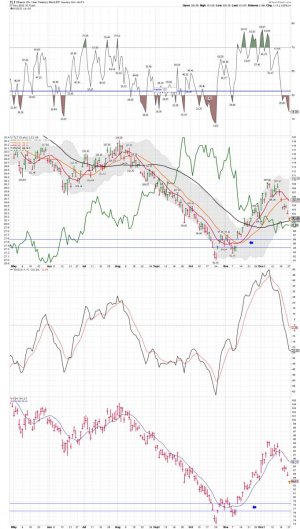
GDX weekly: Still looking good, and remains on a buy signal, but GDX needs to move above the 50 and 200 week MA's.
 

Attachments

  • a.png
    a.png
    40.3 KB · Views: 43
  • a.png
    a.png
    79.3 KB · Views: 43
  • a.png
    a.png
    65 KB · Views: 42
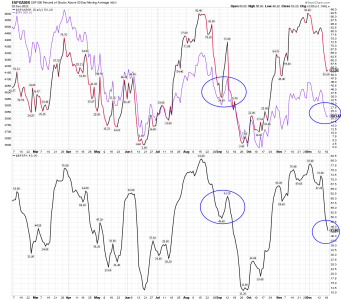
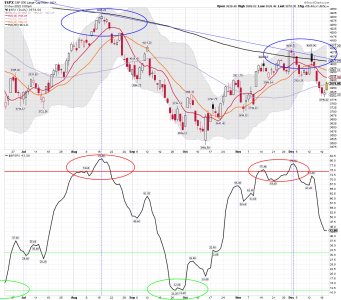
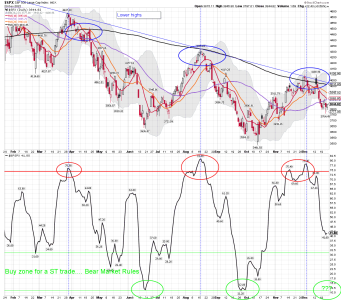
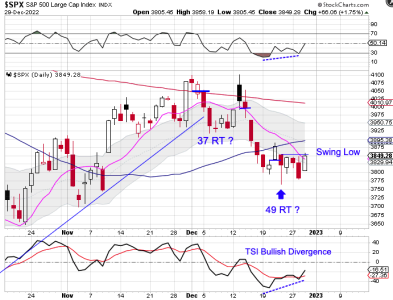
The pattern indicates the SPX is getting closer to making a ST bounce..... We shall see how that plays out.....
 

Attachments

  • a.png
    a.png
    102.6 KB · Views: 49
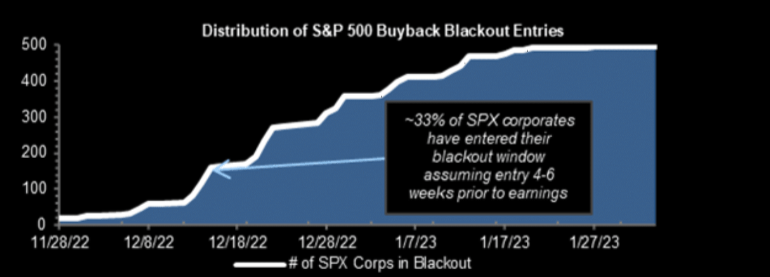
Buyback blackout is back
"Flows are starting to move into more 10b5 -1 plans as companies approach their blackout window. We estimate Monday as the start of the final blackout window of the year with ~33% currently in their closed window. By the end of the week, we estimate ~54% of the S&P 500 will be in blackout"

https://themarketear.com/
More on buybacks
The most consistent and noteworthy buyer of US stocks in 2022 were corporates with over$1T in buyback executions (the most ever). However, Goldman expects buybacks to decline by at least 10% in 2023. If we land in a recession please keep this disturbing GS stat in mind:during the four recessions since 1990, cash M&A typically fell by 60% and buybacks fell by 46% (GS)
 

Attachments

  • a.png
    a.png
    119.4 KB · Views: 57
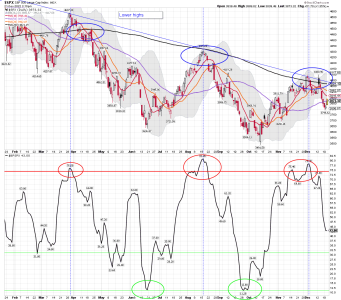
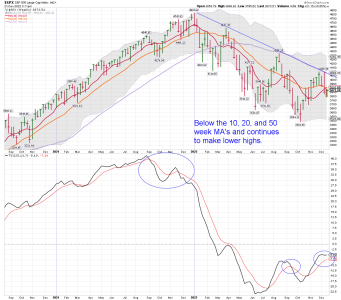
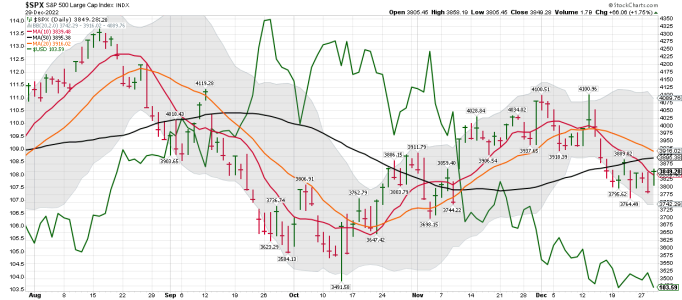
SPX daily with 1 hour to go: Well, the short-term bounce is in play..... We shall see if the SPX has enough buyers to move the index back above the 10 and 20 day MA. The test of the 50 day MA is currently in play. The bigger test is to see if the weekly can move back above the 10 and 20 week MA's....
 

Attachments

  • a.png
    a.png
    78 KB · Views: 58
  • a.png
    a.png
    96.4 KB · Views: 58
  • a.png
    a.png
    68.9 KB · Views: 58
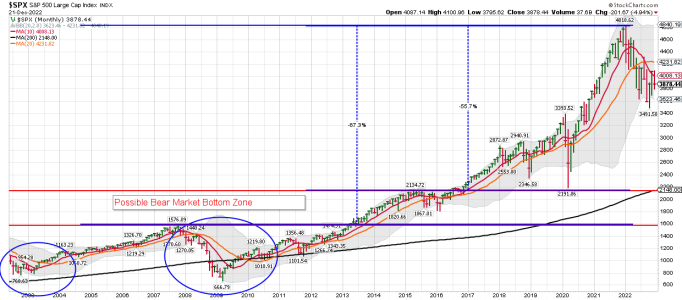
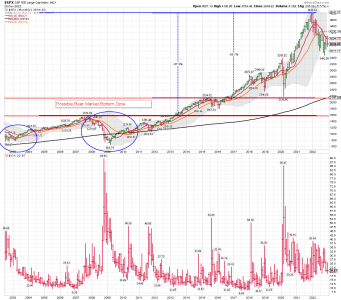
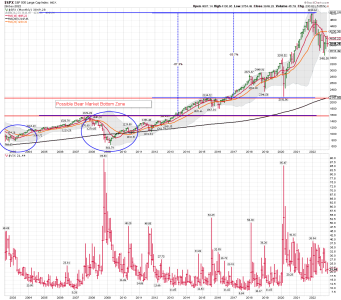
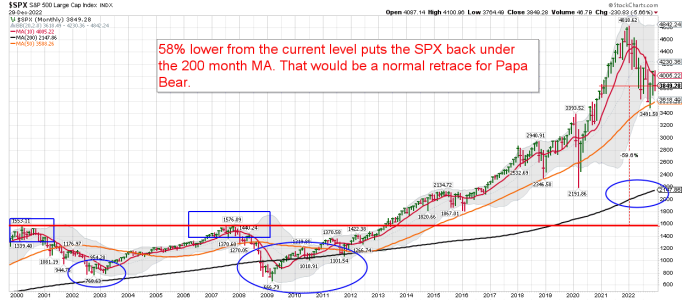
SPX monthly: My target is about the same as the one below based on the historical data of other Bear Markets I track.


SevenSentinels
@SevenSentinels
·
1h
You mean trading with the trend is the key to consistent profitability?

That can't be right. It's way too simple!

Happy Holidays GOT.
Quote Tweet
The God of Trading
@TheGodOfTrading
·
1h
Managed to tweet the high of the day. Not often that happens.

Got 3 likes on that tweet which makes me think no one believes this simple strategy despite the chart examples or most options traders would rather chase the hundreds of arcane options strategies that boggle the mind. twitter.com/TheGodOfTradin…

SevenSentinels Retweeted
Mac10
@SuburbanDrone
·
4h
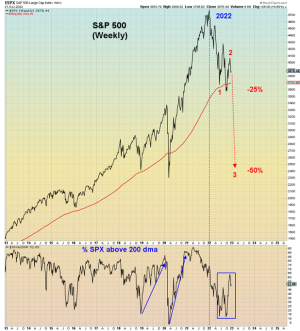
The first half of 2022 was wave '1' down. The second half was wave '2' correction, which was very weak due to the Tech explosion.

Wave '3' has already begun.

-50% is the minimum downside.

You've been warned.
https://twitter.com/SevenSentinels?ref_src=twsrc^google|twcamp^serp|twgr^author
 

Attachments

  • a.png
    a.png
    201.8 KB · Views: 57
  • a.png
    a.png
    38.7 KB · Views: 56
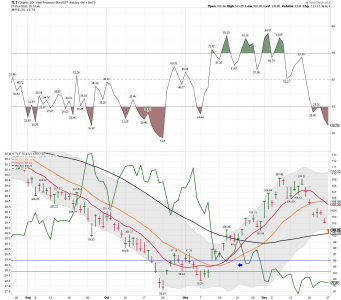
We shall see: The TLT weekly trend looks like it might back test the 10 week MA. It is currently back testing the 20 MA...

I'm still long some TLT.


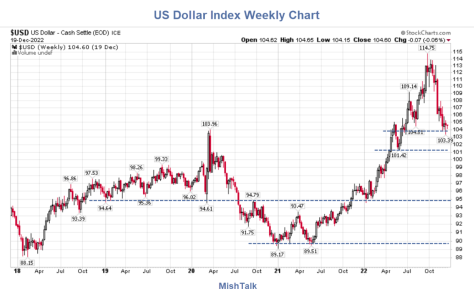
The Top In The U.S. Dollar Is In. Where To From Here?
By Mish Shedlock of MishTalk
Tuesday, December 20, 2022 5:19 PM EST

Dollar Fundamentals

Deficit spending in the US is totally out of control.
Rising treasury yields will consume increasing amounts of tax revenues
The Fed is giving away billions of taxpayer dollars in free money to banks.
US housing market is collapsing
Corporate earnings are falling
Consensus earnings are still too high
The US stock market is still insanely overvalued, even on a relative basis to the rest of the world
The US pace of tightening is slowing while tightening elsewhere rates to catch up a bit.
In short, US dollar fundamentals stink.

This may not be the best entry as the dollar is right at support but UDN is worth considering here or on a bounce.

https://talkmarkets.com/content/us-...s-dollar-is-in-where-to-from-here?post=379105
 

Attachments

  • a.png
    a.png
    170.3 KB · Views: 57
  • a.jpg
    a.jpg
    121.7 KB · Views: 56
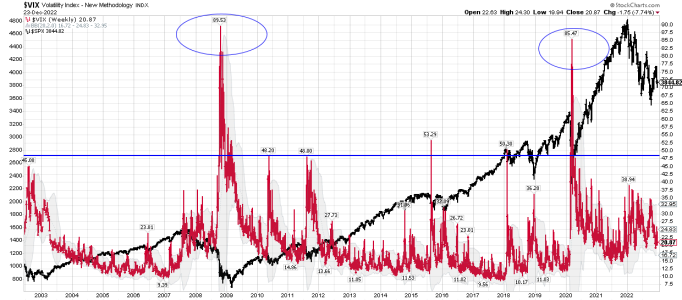
New research claims the bear market won’t be over until the VIX says so.
Last Updated: Dec. 23, 2022 at 4:35 p.m. ET
According to one prominent investment firm’s analysis of the VIX, the stock market has not yet experienced the capitulation that typically signals the end of the bear market.

By capitulation, I’m referring to the deep despair that leads investors to throw in the towel and swear off equities. Though not every bear market ends with capitulation, most have. So Wall Street analysts are scouring the historical record for reliable indicators of capitulation.

The VIX — the CBOE Volatility Index VIX, -5.01% —reflects option traders’ expectation of the S&P 500’s SPX, +0.59% volatility over the subsequent month, with higher levels indicating greater expected volatility. Since 1990, the earliest year for which the CBOE has historical data for the VIX, its highest-ever close was 82.69 (in March 2020). Its lowest-ever close came in November 2017 at 9.14. It currently stands in the low 20s.
https://www.marketwatch.com/story/n...ont-be-over-until-the-vix-says-so-11671582132
 
Very good news for those of us getting close to 72, and some other nice nuggets for savers.

It’s In! SECURE 2.0 Act of 2022 Included in Omnibus Appropriations Bill
Must-pass bill including landmark retirement reform legislation expected to clear Capitol Hill by Friday
What’s in SECURE Act 2.0
The 100+ provisions in the SECURE 2.0 Act of 2022 are essentially the melding of three separate bills that have been worked on for over a year: the Senate HELP Committee’s RISE & SHINE Act, the Senate Finance Committee’s Enhance Americans Retirement Now (EARN) Act, and the Securing a Strong Retirement Act from the House Ways and Means Committee.

While industry organizations are busy analyzing the text of the bill, Finseca’s Seidel noted the following key provisions that will impact client planning that Finseca was “very pleased” to see included:

• Required minimum distribution (RMD) age increasing to 75;

• Catch-up contribution limits for IRAs increasing;

• Auto-enrollment of employees in new qualified plans;

• Student loan payments can be matched in qualified plans by employers; and

• Improved access to guaranteed lifetime income products, among others.

In its statement today, the ARA singled out the following provisions that could help close the retirement savings opportunity gap for moderate income Americans, particularly among minority groups:

• A Starter 401k—that could provide over 19 million new American workers with access to the workplace-based retirement system through a brand new super-simple safe harbor 401k plan.

• A 100% tax credit for new plans to incentivize the creation of new workplace retirement programs by small businesses.

• A Saver’s Match Program that would incentivize retirement savings by providing a 50% matching contribution on up to $2,000 in retirement savings annually for lower- and middle-income Americans. Over 108 million Americans would be eligible for the Saver’s Match that would be directly deposited into their retirement account—boosting the savings of moderate-income earners.
https://401kspecialistmag.com/its-in-secure-2-0-act-of-2022-included-in-omnibus-appropriations-bill/
 
What Are the Income Tax Brackets for 2022 vs. 2023?
Depending on your taxable income, you can end up in one of seven different federal income tax brackets – each with its own marginal tax rate.

BY ROCKY MENGLE
LAST UPDATED 9 DAYS AGO
When it comes to federal income tax rates and brackets, the tax rates themselves aren't changing from 2022 to 2023. The same seven tax rates in effect for the 2022 tax year – 10%, 12%, 22%, 24%, 32%, 35% and 37% – still apply for 2023. However, the tax brackets for 2022 and 2023 are different (i.e., new beginning and ending dollar amounts are established for each bracket). That's because the tax brackets are adjusted each year to account for inflation. As a result, you could end up in different tax brackets in 2022 and 2023. That, of course, also means you could pay a different tax rate on some of your income from 2022 to 2023.

https://www.kiplinger.com/taxes/tax-brackets/602222/income-tax-brackets
 
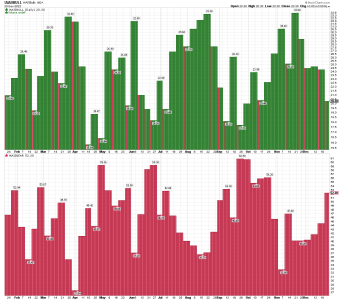
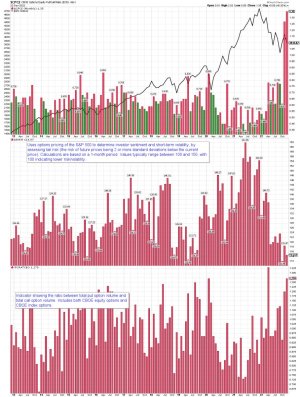
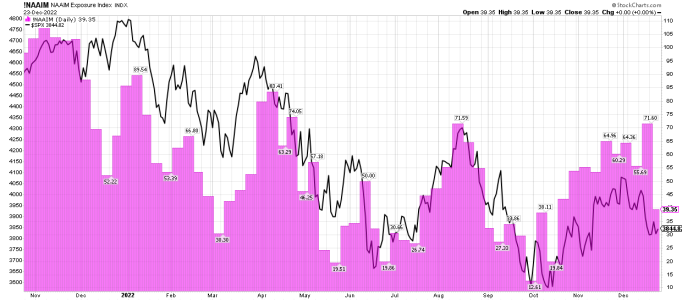
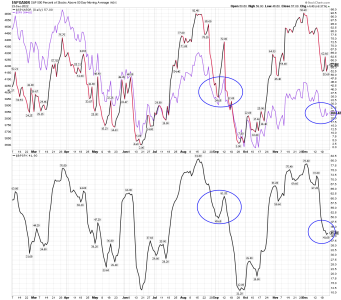
A few charts to look over: For me its please pass the popcorn.... as I watch the show and wait for the next extreme to trade.


Latest put call ratio has nothing to do with fear


The latest surge in the put call ratio has nothing to do with people loading up on puts as fear is huge, nor is it an effect of the short term options mania we have seen (the 0DTE stuff). Most people that comment on options and volatility trading have little clue about trading these instruments and even less clue how you value options. The latest surge in puts has taken place in deep in the money puts. Under certain circumstances it is economically rational to exercise those puts and it has only to do with interest rate and arbitrage pricing. We are not in the business of options education, but for the ones that want to read up on the subject we advise looking through Natenberg's Options pricing and volatility (chapter 12 1994 edition for example).
https://themarketear.com/
 

Attachments

  • a.png
    a.png
    30.3 KB · Views: 70
  • a.jpg
    a.jpg
    219.1 KB · Views: 69
  • a.png
    a.png
    39.5 KB · Views: 67
  • a.png
    a.png
    103.3 KB · Views: 67
  • a.png
    a.png
    69.9 KB · Views: 67
  • a.jpeg
    a.jpeg
    6.9 KB · Views: 65
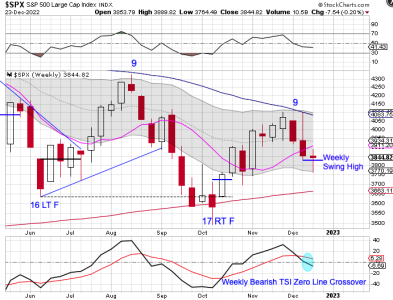
Bearish Signal

Stocks were rejected by the declining 50 week MA the previous week.

Stocks formed a weekly swing high this week. This is a very bearish setup. A peak on week 9 sets stocks up for a left translated weekly cycle formation. Stocks are currently in a weekly downtrend. Forming a weekly swing high below the upper weekly cycle band that will indicates a continuation of their weekly downtrend and signals a weekly cycle band sell signal.

https://likesmoneycycletrading.wordpress.com/2022/12/24/bearish-signal/
 

Attachments

  • a.png
    a.png
    60.6 KB · Views: 63
  • a.png
    a.png
    100.4 KB · Views: 63
  • a.png
    a.png
    69.9 KB · Views: 63
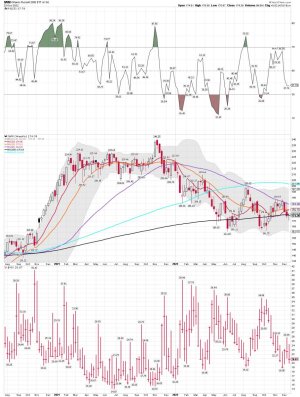
IWM weekly: The trend remains down as IWM continues to make lower highs. The VIX will be much higher before this Bear is done mauling investors.
 

Attachments

  • a.jpg
    a.jpg
    164.7 KB · Views: 69
  • a.png
    a.png
    50.3 KB · Views: 68
  • a.png
    a.png
    53.9 KB · Views: 68
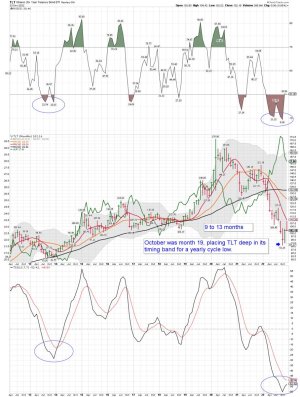
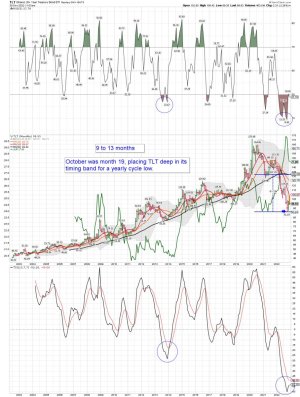
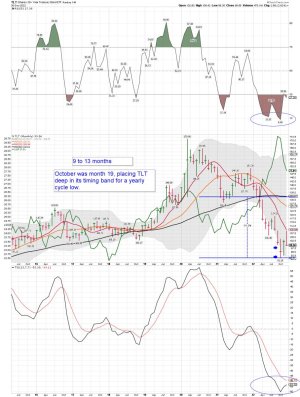
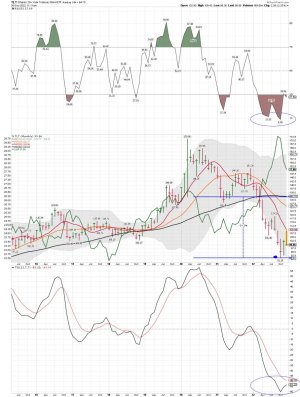
TLT monthly: We might be getting closer.... A move back up to the 50 month MA is very possible in the months ahead. TLT was extremely stretched below the 50 month MA, and the rubber band will all always snap back. However, it can get extremely stretched, above or below the mean at times. This time it's far below the mean. I will point out that I look for extremes to trade, and this is one I like. Why? Because we are in a Bear Market for stocks. We shall see how TLT plays out in the months ahead.

Long some TLT....

A small comment from Kaplan:

Patiently wait for VIX to be below 20 before adding to short positions, as we have done profitably throughout 2022.


If you're too anxious to trade then you'll make more mediocre transactions. Mediocre trades lead to mediocre results. Only act near rare extremes.


Your urgency over the next few days should be placing orders to purchase 52-week and 2-year U.S. Treasuries, not anything involving stocks or other assets.

Kaplan

https://twitter.com/truecontrarian

https://truecontrarian-sjk.blogspot.com/
 

Attachments

  • a.jpg
    a.jpg
    170.6 KB · Views: 72
Last edited:
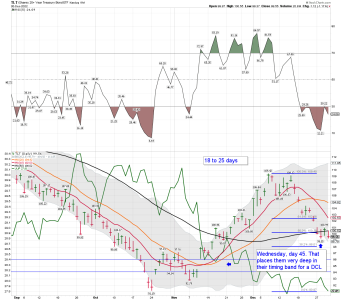
TLT daily: Back testing the 50 day MA... We shall see if it holds.... Day 7 since the sell signal.
 

Attachments

  • a.jpg
    a.jpg
    131.9 KB · Views: 66
  • a.png
    a.png
    76 KB · Views: 63
Odds Are The DCL Has Formed

Stocks formed a daily swing low on Thursday.
Stocks printed their lowest point on day 49, placing them deep in their timing band for a DCL. Stocks formed a swing low and a closed above the 10 day MA to signal the new daily cycle. Long positions can be entered based on the swing low with a stop being set below the day 49 low.

The decline into the day 49 low caused the 10 day MA to decline sharply. Stocks may need to consolidate to allow the 10 day MA to flatten out before it can turn higher. The next concern is closing above the 50 day MA.

The real challenge will be to close above the declining 200 day MA. Stocks lost the 200 day MA back in May and has been rejected by it ever since. If stocks can close above the 200 day MA and break above the previous daily cycle high of 4100.96, then stocks would have formed a higher low and a higher high — the definition an uptrend.
 

Attachments

  • a.png
    a.png
    46 KB · Views: 57
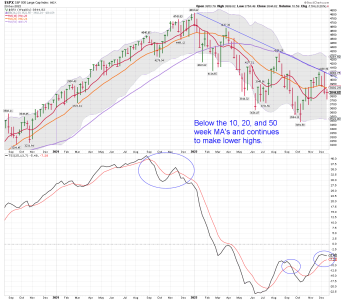
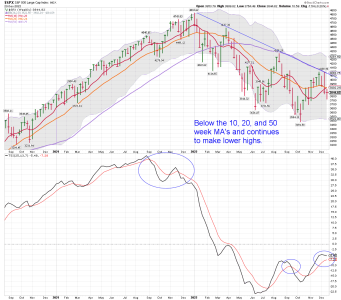
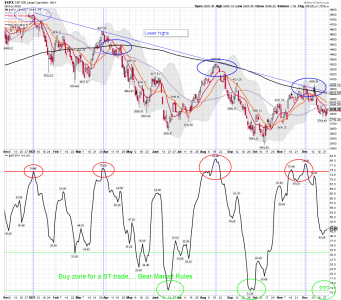
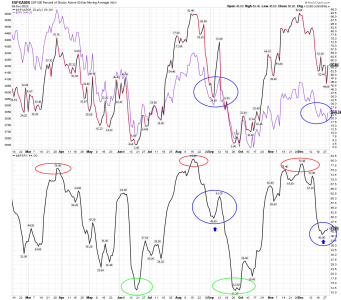
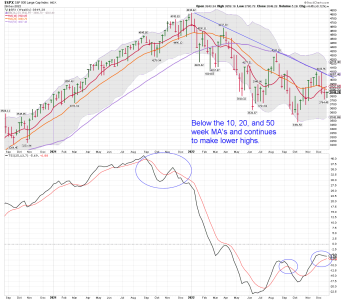
SPX daily/weekly/monthly: Maybe a DCL, but until the SPX can get back above the 200 day MA, one should be careful.

Bottom Line: The SPX daily continues to make lower highs and remains in a down trend below its 200 day MA. We shall see how this bounce plays out.
 

Attachments

  • a.png
    a.png
    56.8 KB · Views: 60
  • a.png
    a.png
    105.5 KB · Views: 61
  • a.png
    a.png
    103.6 KB · Views: 61
  • a.png
    a.png
    69.6 KB · Views: 59
  • a.png
    a.png
    53.8 KB · Views: 57
  • a.png
    a.png
    44.6 KB · Views: 56
  • a.jpg
    a.jpg
    179.7 KB · Views: 61
Last edited:
TLT and trading extremes: I have posted many times I look for extremes to trade in certain sectors. Looking at the monthly TLT chart below - How many times have you seen TLT this far below the 50 month MA in the last 20 years. The answer would be only this move, and it's a rare extreme.

It is a very ugly chart and why hold or buy TLT now. Well, based on the extreme move we are currently seeing below the 50 month MA I expect TLT to tag the 50 month MA in the next two years., as the Bear Market continues to maul investors some will buy TLT.

I'm Long TLT, 2 year notes making over 4%, and lots of CD's making over 3%. I'm still mainly trading the gold miners and just watching the show for most of the other indexes.

Bottom Line: TLT could move lower, but my trade is it will tag the 50 month MA in the next two years and maybe tag the 150ish area. That is based on how far stretched below the 50 month MA TLT currently is. The rubber band always snaps back - When will it snap back.... I sure don't know, but I remain long TLT.

My current average share price is under 100, and I have a 50k position so far. I will try and hold the next 12 months, but sometimes I just have to take the money and run.
 

Attachments

  • a.jpg
    a.jpg
    174.2 KB · Views: 60
  • a.jpg
    a.jpg
    149.7 KB · Views: 56
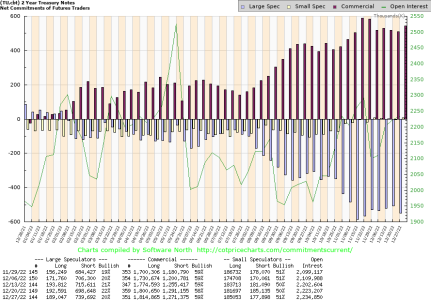
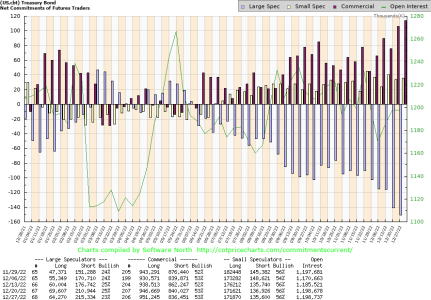
COT data: See my charts and comments above on why I'm buying this TLT extreme.

I'm long TLT

A small comment from Kaplan:

Keep buying TLT below 100.

I have been buying TLT repeatedly at 99.49 and below in recent days including today. U.S. Treasuries are likely to be among the best investments for the next two years, initially to make up for irrational losses in 2022 and afterward to approach or set new all-time highs a few months prior to the end of the U.S. equity bear market. You are likely to gain a total of 60% or more by the end of 2024 if you buy TLT below 100, including more than three dollars in dividends each year per share.


https://truecontrarian-sjk.blogspot.com/
 

Attachments

  • a.png
    a.png
    36.6 KB · Views: 52
  • a.png
    a.png
    35.2 KB · Views: 52
TLT daily: So what is the next move for TLT? A move down to fill the gap, a higher low and no gap fill, or maybe we fill the gap and make a lower low..... I don't know, but I will be holding and adding if we move lower based on my long term monthly chart below. TLT remains at an extreme level, and history indicates buyers will come in as Papa Bear takes over. I like trading with the commercials. See COT data above. As we move into the DCL we could still see a final bloodbath phase on the daily chart.

We shall see how it plays out!
 

Attachments

  • a.png
    a.png
    79.8 KB · Views: 47
  • a.jpg
    a.jpg
    154.9 KB · Views: 48
Back
Top