Bear Cave 2 (Bull Allowed)

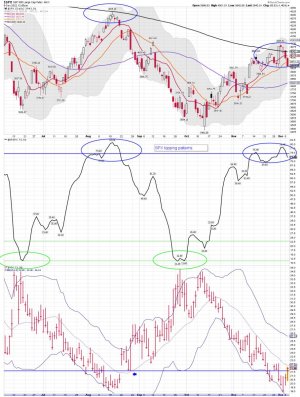
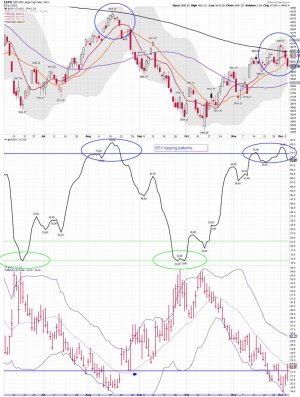
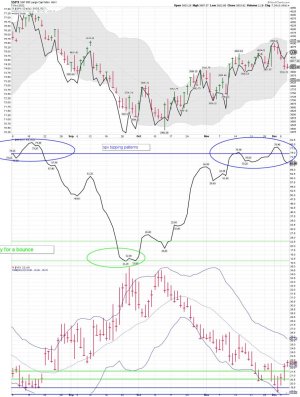
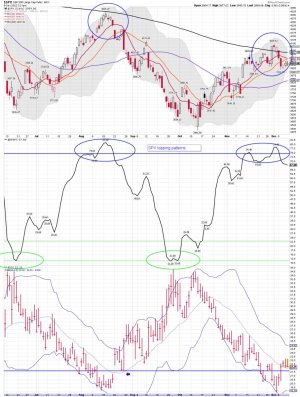
SPX daily: The SPX has now moved back below the 10 and 20 day MA's.... We shall see how this pattern plays out. The 50 day MA be up next.... The 200 day MA remains resistance as one would think if you are trading using Bear Market rules....

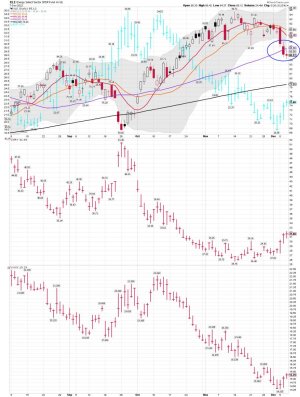
I remain flat SPX/SPY and I'm shorting XLE and long VXX.... ( For a ST trade only)

(Beer Money Trades)

12/02/2022 15:57:53 Bought 300 VXX @ 14.375

12/06/2022 12:46:02 Sold 300 VXX @ 15.055


Selling my VXX and XLE short position as I wait for the next move..... Crazy market right now....
 

Attachments

  • a.jpg
    a.jpg
    187.8 KB · Views: 53
Last edited:
SPX daily chart after the close:


December 6, 2022
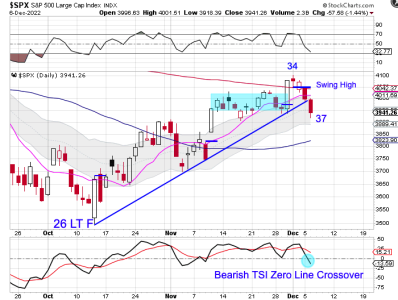
Stocks Crossed The Line

Stocks formed a swing high and closed below the 10 day MA on Monday to signal the daily cycle decline.


Stocks delivered bearish follow through on Tuesday. Stocks closed below the daily cycle trend line to confirm the daily cycle decline. Stocks should go on to turn the 10 day MA lower in order to complete its daily cycle decline. Tuesday was day 37, placing stocks deep in their timing band for a DCL. Stocks are currently in a daily uptrend. If they form a swing low above the lower daily cycle band that will indicate a continuation of their daily uptrend and signal a cycle band buy signal.

https://likesmoneycycletrading.wordpress.com/2022/12/06/stocks-crossed-the-line-3/
 

Attachments

  • a.png
    a.png
    45.4 KB · Views: 48
  • a.jpg
    a.jpg
    188.4 KB · Views: 47
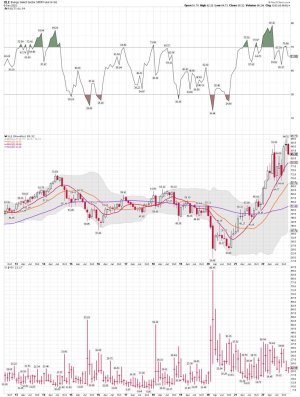
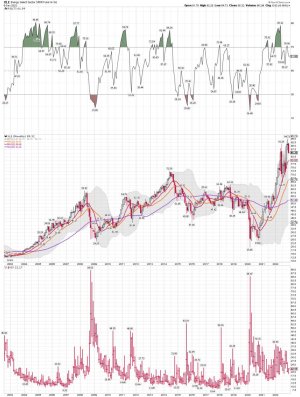
XLE monthly and the 50 month MA: You can see on this monthly chart just how far XLE is stretched above its 50 month MA. Based on the historical data on this chart the move lower could continue for some time. Just tagging the 10 month MA gets it back to $80.00ish, but one would think, based on the historical pattern, a move back down closer to the 50 month MA is very possible next year.

However, in the short term I will be watching for a move back down to the 10 month MA. Its clear why the insiders were selling so many shares as the rubber band continued to stretch this index so far above its historical mean. Based on the historical data one would expect to see a RSI much closer to 30 before the move lower has completed.

This opinion is based on XLE is the early stages of a Bear Market. We shall see how that plays out in the next few years....

"IF" that plays out we will see a move below the 50 month MA before Papa Bear is done mauling investors. Watch for when the insiders start buying again, and not selling.

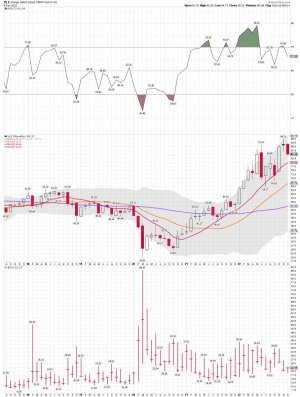
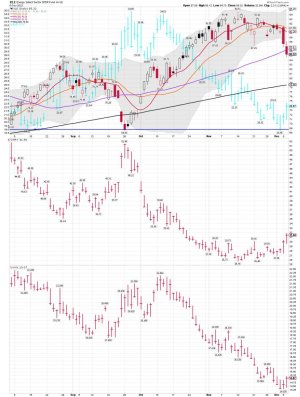
The 3rd chart down XLE chart: A closer look at the monthly data: I will post the daily after the close today....

We could see a bounce soon after the daily tagging the 50 day MA yesterday. (The last chart)
 

Attachments

  • a.jpg
    a.jpg
    163.7 KB · Views: 51
  • a.jpg
    a.jpg
    175.6 KB · Views: 53
  • a.jpg
    a.jpg
    159 KB · Views: 53
  • a.jpg
    a.jpg
    161.2 KB · Views: 51
Last edited:
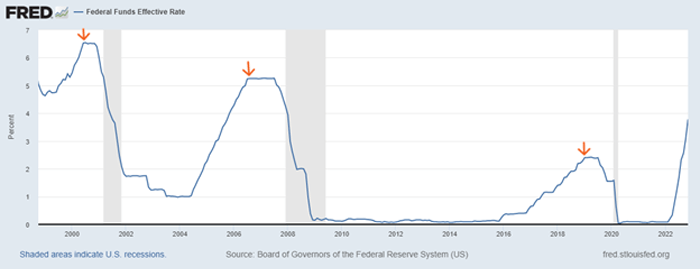
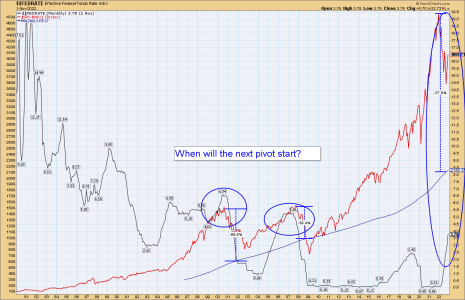
When will the FED pivot and start lowering again?

SPX/FED rates month chart:


Will Santa Bring a Fed Pivot?
Clint Brewer | Dec 7, 2022 | Market Minute |


Pivots Signal a Damaged Economy
The Fed is tasked with two jobs: keep prices stable and people employed.

Achieving both requires a balancing act with interest rates to keep the economy at the right speed.

But unfortunately, the Fed tends to push rates too far in either direction. Those extreme moves create boom-and-bust cycles for the economy… Like slashing overnight rates to zero in the wake of the pandemic.

Now we’ve seen four consecutive 0.75% hikes – a truly unprecedented rate.

And pivoting is historically a bad signal because it follows the stark realization by Fed officials that they’ve pushed things too far and took the economy to the brink.

But by then, it’s too late.

Take another look at the federal funds rates in the chart below, this time with recessions shown in the grey shaded areas. Pivots happened before the last three recessions hit…

https://www.jeffclarktrader.com/market-minute/will-santa-bring-a-fed-pivot/
 

Attachments

  • a.png
    a.png
    17.1 KB · Views: 49
  • a.png
    a.png
    59.9 KB · Views: 49
"If you are a serious trader"

SevenSentinels
@SevenSentinels

2h
If you are a serious trader....

Timing isn't everything....

It's the ONLY thing.

We have opened this article to non-subs.

https://sevensentinels.com/let-me-count-the-ways/


How do we know that the markets are in a downtrend? “Let me count the ways.”
As of TODAY:

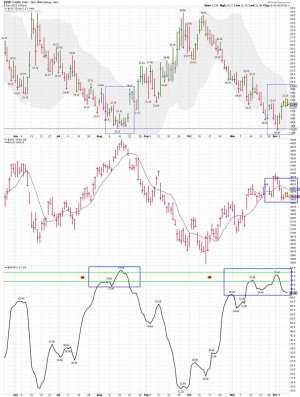
NYMO is now negative

NYSI (NYSE Summation Index) is Declining

The NYMO Daily Sentinel produced a Sell Signal

NAMO is negative

NASI (NASDAQ Summation Index) is Declining

The NAMO Daily Sentinel had a Sell Signal

The LOLR Sentinels made a Downtrend Signal
 
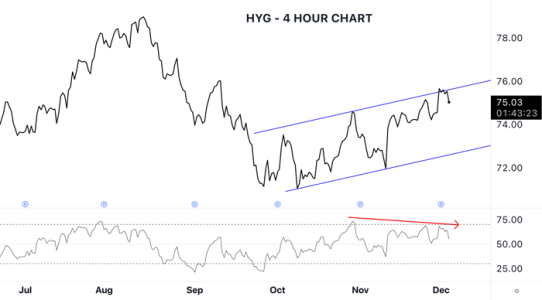
I don't use HYG as a trading indicator, but some traders do. We shall see how this indicator plays out the rest of December... HYG is the solid black line on my chart.


Dec 8, 2022
This “Flag” Is a Ticking Time Bomb for Market Breakdown

If HYG reverses course, then it’s likely stocks will fall as well.

Before I show you a price chart of HYG, I want to stress that the bearish pattern I’ve spotted isn’t complete yet.

https://www.jeffclarktrader.com/market-minute/this-flag-is-a-ticking-time-bomb-for-market-breakdown/
 

Attachments

  • a.png
    a.png
    20.6 KB · Views: 39
  • a.jpg
    a.jpg
    169.5 KB · Views: 40
XLE daily: Looking at the pre-market prices, it looks like a nice bounce for XLE at the open this morning. A tag of the 50 day MA usually brings in some investors so we shall see how this undercut plays out.

This chart is before the open and it looks like XLE will be trying to get back above the 50 day MA this morning. I will be watching and I'm flat again.....
 

Attachments

  • a.jpg
    a.jpg
    161.5 KB · Views: 44
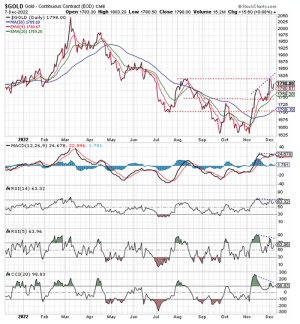
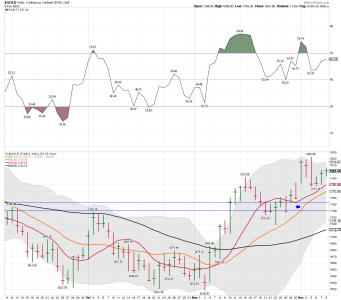
Consider This Before You Buy Gold Right Now
Jeff Clark | Dec 9, 2022 | Market Minute

Gold looks like it could use a rest…

The price of the shiny, yellow metal has rallied nearly $200 per ounce over the past month.

And it’s probably headed much higher in the months ahead.

But for the very short term, it looks like the gold rally is on pause.

To see what I mean, take a look at gold’s chart…


That doesn’t mean traders should be selling gold right here. The long-term outlook remains as bullish as ever.

But folks who are looking to put new money into gold should consider waiting a few days. We may be able to get in at lower prices.

Best regards and good trading,

https://www.jeffclarktrader.com/market-minute/consider-this-before-you-buy-gold-right-now/
 

Attachments

  • a.png
    a.png
    103.6 KB · Views: 31
  • a.png
    a.png
    55.2 KB · Views: 30
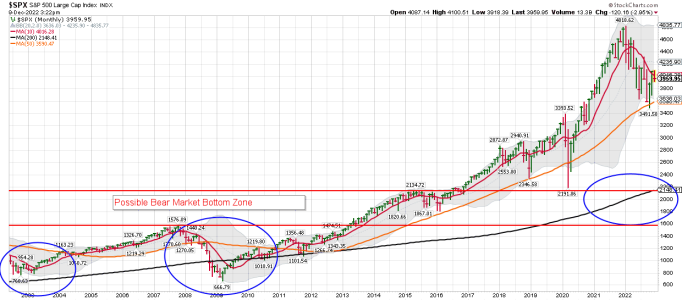
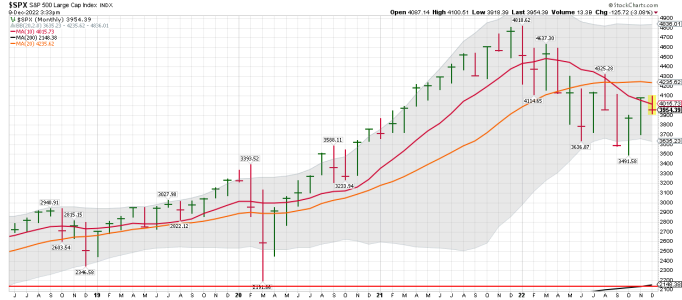
SPX monthly ( Last Chart): A tough year for SPX investors. (I don't use the NorthCast data for trading, but track his reports.)


Battle for Control
By TheNorthCast • Issue #150 • View online
Frustrated by all the price range chop? Don’t be, there is a perfectly valid technical explanation for it as markets find themselves confronted with a very unique combination of factors coming together all in one place.
Incidentally in the video I misspoke temporarily on the weekly chart. I said weekly 50MA, I clearly meant weekly 5 EMA, but it should be clear in context of the entire video.
Technically this is a big battle for control here and the outcome of this battle will decide whether we will still see a year end rally. Or not.

https://www.getrevue.co/profile/The...wser&utm_medium=email&utm_source=TheNorthCast
 

Attachments

  • a.png
    a.png
    35.8 KB · Views: 28
  • a.jpg
    a.jpg
    187.9 KB · Views: 29
  • a.png
    a.png
    40.8 KB · Views: 29
Last edited:
SPX monthly ( I use the 10 and 20 month MA's.) It still looks Bearish to me as it remains in a downtrend, so I remain flat.
 

Attachments

  • a.png
    a.png
    29.1 KB · Views: 29
One thing I've learned about trading the metals, especially silver - just when you think you see it's pattern, it changes on you. The other traders are good and can get you leaning the wrong way.

So if gold looks like it's ready for a pause, it probably means it's about to go parabolic. :)

Not a prediction, but an observation.

Jeff Clark | Dec 9, 2022 | Market Minute

Gold looks like it could use a rest…

The price of the shiny, yellow metal has rallied nearly $200 per ounce over the past month.

And it’s probably headed much higher in the months ahead.

But for the very short term, it looks like the gold rally is on pause.
 
LOL.... I hear Brother! I have taken some HUGE losses trading the miners. I have also missed some HUGE rallies waiting for pullbacks....
 
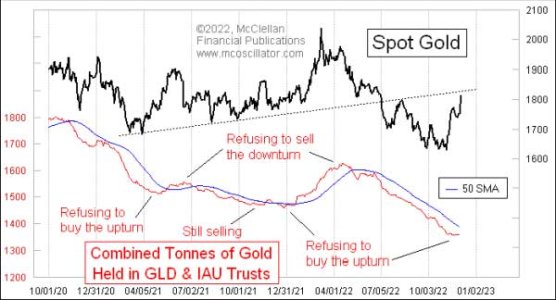
The Gold Move that ETF Traders Were Not Betting On
McClellan Financial Publications, Inc
Posted Dec 9, 2022

Given the big jump in gold prices since October, we should expect that public sentiment toward gold should be turning more bullish, but it is not. Investors are still avoiding these ETFs, which means that their bearishness is more firmly rooted. That is actually bullish for gold prices, because to get a top for gold prices we would expect to see investors clamoring to get into gold. They are not at that point yet, which conveys the message that gold is going to have to trend higher for a lot longer to get sentiment to change.

Dec 9, 2022 The Gold Move that ETF Traders Were Not Betting On Tom McClellan 321gold ...inc ...s
 

Attachments

  • a.jpg
    a.jpg
    31.6 KB · Views: 32
Deep Thoughts For Passive Investors

jessefelder
December 7, 2022

Remember, passive investing is founded upon the idea that the markets are efficient and thus investors mirroring the index will realize the collective returns generated by the underlying businesses. But should the market become divorced from its underlying fundamentals due to the dominance of price-insensitive buying, what then should passive investors expect?

https://thefelderreport.com/2022/12/07/deep-thoughts-for-passive-investors/
 
Things that make you go hmmm...


Recession ASAP
Hartnett points out why we could see a recession within 10-12 weeks:

1. yield curve extremely inverted

2. oil crashing despite the China reopening, Russia oil price cap, SPR running "dry" and OPEC saying supply is constrained

3. bank stocks tanking recently

4. ISM manufacturing new orders down 3 straight months at time of high inventories

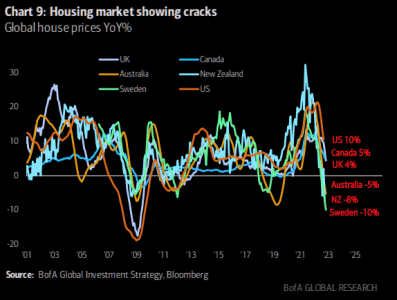
5. Housing looking shaky

https://themarketear.com/
 

Attachments

  • a.png
    a.png
    87.8 KB · Views: 29
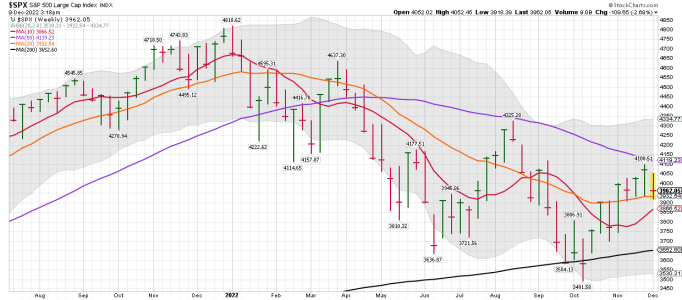
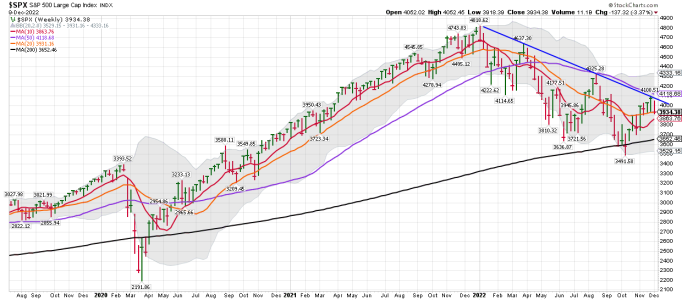
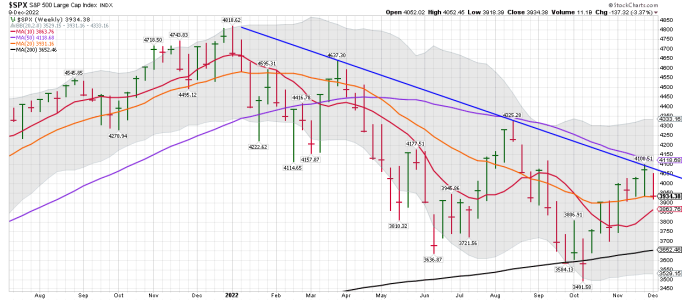
SPX weekly: The weekly making lower highs below the 50 week MA...
 

Attachments

  • a.png
    a.png
    41.3 KB · Views: 30
  • a.png
    a.png
    36.7 KB · Views: 30
Back
Top