-
The Forum works well on MOBILE devices without an app: Just go to: https://forum.tsptalk.com
-
Please read our AutoTracker policy on the IFT deadline and remaining active. Thanks!
-
$ - Premium Service Content (Info) | AutoTracker Monthly Winners | Is Gmail et al, Blocking Our emails?
Find us on: Facebook & X | Posting Copyrighted Material
-
Join the TSP Talk AutoTracker: How to Get Started | Login | Main AutoTracker Page
-
20% Off Annual Premium Subscriptions!*
Ends Jan 23... Click Here For More Information
* For new or current subscribers
You are using an out of date browser. It may not display this or other websites correctly.
You should upgrade or use an alternative browser.
You should upgrade or use an alternative browser.
Bear Cave 2 (Bull Allowed)
- Thread starter robo
- Start date
robo
TSP Legend
- Reaction score
- 471
robo
TSP Legend
- Reaction score
- 471
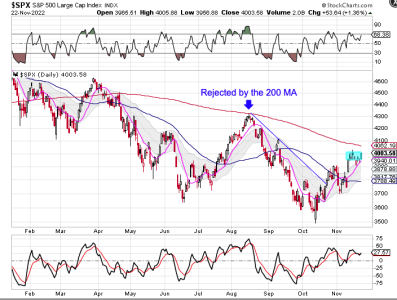
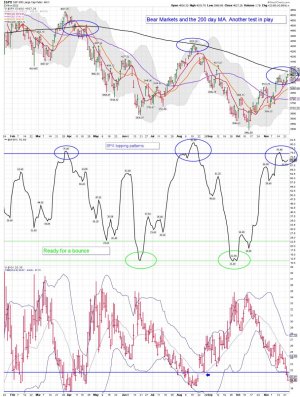
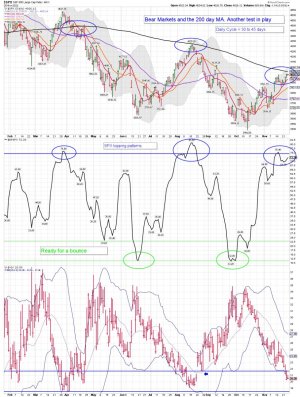
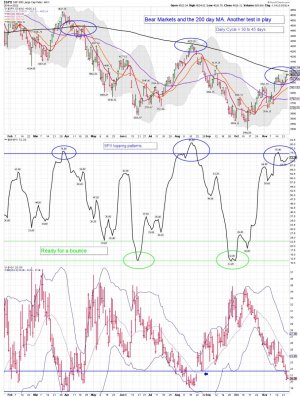
SPX daily and the 200 day MA: Waiting to see how it plays out..... The VIX is still filling the gap. Will it be a higher low or a lower low?? Anyway, getting close to the VIX 20ish level again, and I'm looking to take short positions for a trade only.
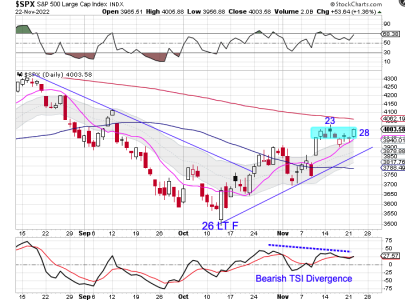
Consolidation – Update
Stocks have been consolidating for the past 9 trading days just below the 200 day MA.
Tuesday is day 28 for the daily cycle, placing stocks in the early part of their timing band for a DCL. There is a chance that stocks will again be rejected by the 200 day MA – which would then send stocks into a daily cycle decline. With a peak on day 23 – that assures us of a right translated daily cycle which indicates a high low.
However, stocks could deliver a bullish surprise and breakout above the 200 day MA. Typically breakouts that occur later in the timing band for a DCL is rarely sustained. If stocks break above the 200 day MA here, a daily cycle decline that backtests the 200 day MA would likely be needed before a trending move to be sustained.
https://likesmoneycycletrading.wordpress.com/2022/11/22/consolidation-update/
Attachments
robo
TSP Legend
- Reaction score
- 471
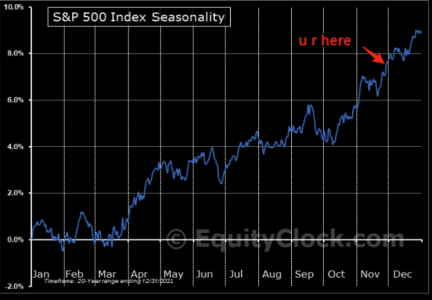
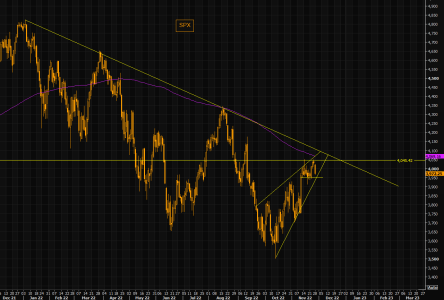
Setting up for the Santa overshoot?
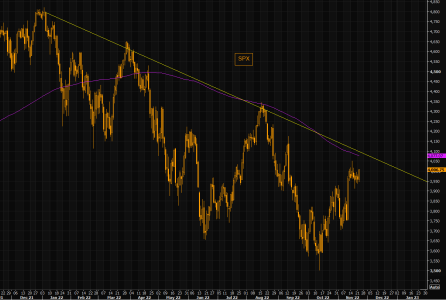
A lot of the seasonality pattern has played out, but there is one last push starting in December, if we are to follow the past 20 year seasonality. We have been waiting for the overshoot. Maybe we get it and SPX attacks the 200 day and the negative trend line...
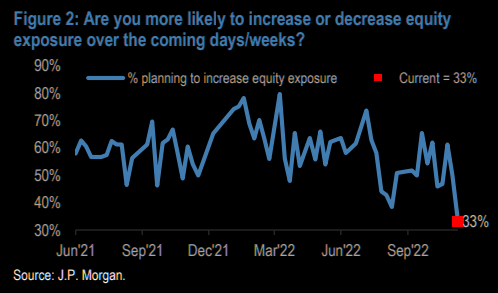
Are you...?
JPM clients responding to whether they will increase or decrease equity exposure. The question is will they do as they say, especially if FOMO kicks in?
https://themarketear.com/
Attachments
robo
TSP Legend
- Reaction score
- 471
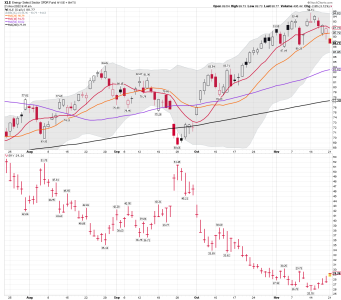
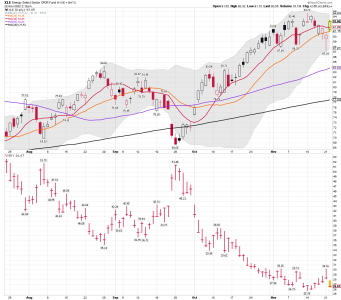
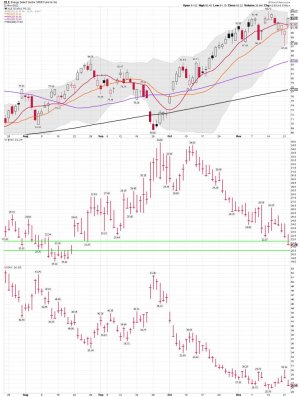
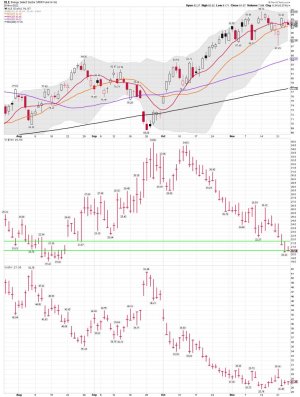
XLE daily: We shall see if Santa comes to town..... If so, XLE will continue to increase..... If not, it could be one of the biggest losers....
A comment from Kaplan:
XLE has remained elevated, with this sector continuing to be strongly recommended by most analysts.
Everyone loves a winner, and energy shares are the only major sector in 2022 which has gained substantially, up 73.3% year to date and up 86.2% from its December 20, 2021 dividend-adjusted low. This has generated huge positive media coverage and all-time record inflows combined with all-time record insider selling of the components of XLE and related funds.
https://truecontrarian-sjk.blogspot.com/
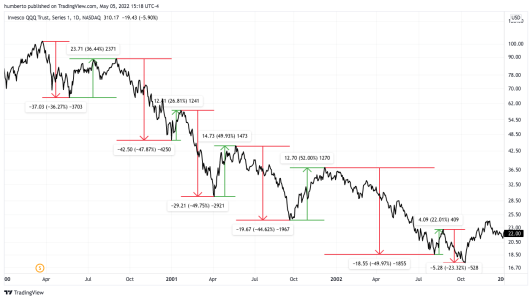
Below is an example of the huge frequent bounces for QQQ during its 2000-2002 bear market when it had lost 83.6% of its value in 31 months: ( Second chart)
Kaplan
https://truecontrarian-sjk.blogspot.com/
Do you have any of these? I sure do..... ""The U.S. Treasury auction on Monday, November 21, 2022 (i.e., yesterday) yielded 4.689% for the 26-week U.S. Treasury for the first time since the summer of 2007"
True Contrarian
@TrueContrarian
10h
Don't look down on Treasuries: The U.S. Treasury auction on Monday, November 21, 2022 (i.e., yesterday) yielded 4.689% for the 26-week U.S. Treasury for the first time since the summer of 2007--another great time to buy short-term Treasuries and sell U.S. stocks (and U.S. houses)
https://twitter.com/truecontrarian
Attachments
Last edited:
robo
TSP Legend
- Reaction score
- 471
The gap to discuss over the long weekend
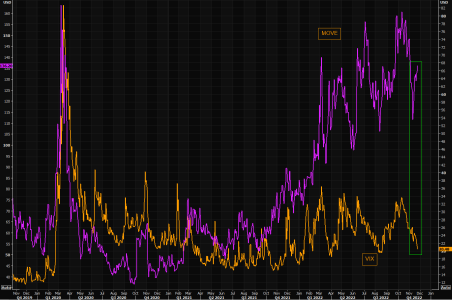
Bond volatility, MOVE, vs VIX is very wide (again)...
https://themarketear.com/
Bond volatility, MOVE, vs VIX is very wide (again)...
https://themarketear.com/
Attachments
robo
TSP Legend
- Reaction score
- 471
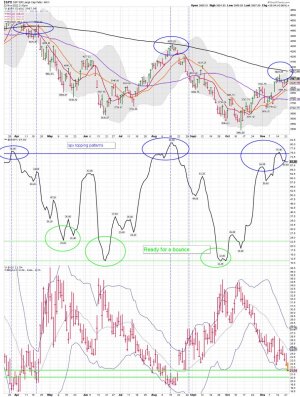
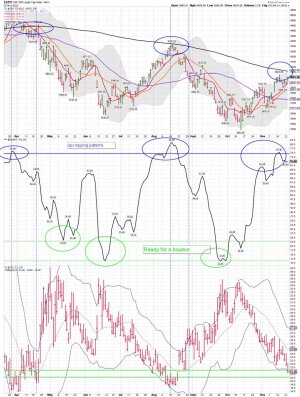
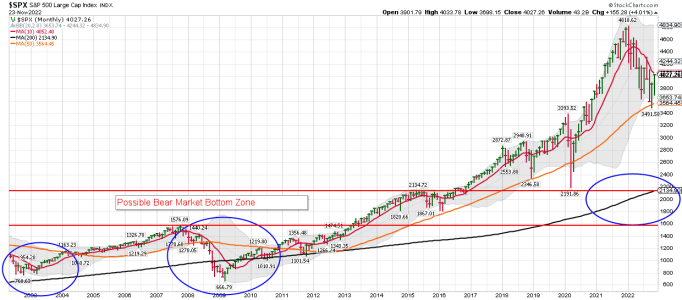
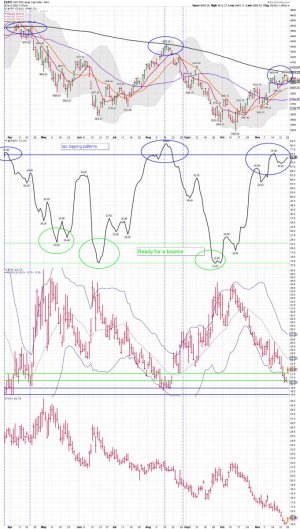
SPX daily: Testing the 200 day MA..... It will be an important test for some investors, but not for me. I remain flat the SPX..... I trade extremes and the data on my chart indicates it's time for me to step back and wait for the next buying pattern to appear. This rally has been ok, and I'm not saying it's over. However, I go to cash when the topping pattern on my chart appears. My next SPX trade will be a short position. Moving above the 200 dma in a Bull Market is Bullish, but I'm trading like we are in a Bear market. We shall see how far this run goes once it tags the 200 dma again.... I will just be watching the show no matter how it plays out as I wait for my next buy signal. Keep in mind I'm a trader not an investor.
Bottom Line: The SPX remains above it's 10 dma, and the VIX gap has been filled. Some would say that is Bullish..... and I would agree if the SPX was in a Bull Market. "Don't Fight the FED" They are not done fighting inflation as consumers are piling on debt with their credit cards again. In my opinion the housing market bust will put a real smack down on things very soon.
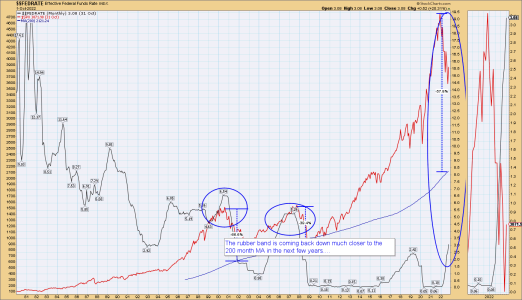
Cash Is King again, as two year notes are getting closer to 5%..... I have a shitload of funds in fixed income right now while I wait for the next Bear Market bottom. That is STBD and it's somewhere in the years ahead based on the data I'm using.
Happy Thanksgiving!
Attachments
Last edited:
robo
TSP Legend
- Reaction score
- 471
robo
TSP Legend
- Reaction score
- 471
David Rosenberg
@EconguyRosie
·
Nov 23
No thanks to what the Fed is giving. Everyone’s excited because the FOMC is going to slow the pace after a steady a diet of 75 beepers? So, going 50 basis points (and more!) into the most inverted yield curve since October 1981 is reason to be festive?
#RosenbergResearch
David Rosenberg
@EconguyRosie
Nov 23
Watch the latest edition of my YouTube series Navigating the Noise -- The Long and Winding Road.
The Long and Winding Road
2,433 views Nov 22, 2022
Join David Rosenberg as he takes a look at what real GDP growth did before, during, and after each tightening cycle dating back to the late 1960s
https://www.youtube.com/watch?v=PcJuXdZEQ1s
@EconguyRosie
·
Nov 23
No thanks to what the Fed is giving. Everyone’s excited because the FOMC is going to slow the pace after a steady a diet of 75 beepers? So, going 50 basis points (and more!) into the most inverted yield curve since October 1981 is reason to be festive?
#RosenbergResearch
David Rosenberg
@EconguyRosie
Nov 23
Watch the latest edition of my YouTube series Navigating the Noise -- The Long and Winding Road.
The Long and Winding Road
2,433 views Nov 22, 2022
Join David Rosenberg as he takes a look at what real GDP growth did before, during, and after each tightening cycle dating back to the late 1960s
https://www.youtube.com/watch?v=PcJuXdZEQ1s
robo
TSP Legend
- Reaction score
- 471
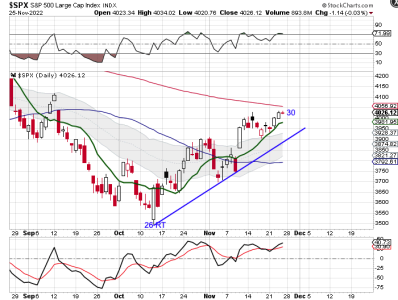
SPX and the DCL: Getting deeper into this daily cycle. We shall see how the test of the 200 day MA plays out. I remain flat the SPX/SPY.
Bottom Line: The SPX continues its move up and remains above the 10, 20, and 50 daily MA's. Very Bullish in a Bull Market, but time to be a tad more cautious this late in the daily cycle during a Bear Market.
It's always possible stocks will complete its YCL and the 4 YCL and the Bull Market will continue. That is not my opinion, but I could be wrong. I will be watching and mainly trading the miners.
Squeeze Play
Stocks are being squeezed by the rising 10 day MA and the declining 200 day MA.
Friday is day 30 for the daily cycle, placing stocks in the early part of their timing band for a DCL. There is a chance that stocks will again be rejected by the 200 day MA – which would then send stocks into a daily cycle decline. However, stocks could deliver a bullish surprise and breakout above the 200 day MA. Typically breakouts that occur later in the timing band for a DCL are rarely sustained. If stocks break above the 200 day MA here, a daily cycle decline that backtests the 200 day MA would likely be needed before a trending move to be sustained.
Attachments
Last edited:
robo
TSP Legend
- Reaction score
- 471
What are cycles and why do I use them? "For a higher probability set-up that matches my risk tolerance" - I like to say increase my odds for a winning trade....
I use cycles as part of my trading data/system. I use the cycle data mainly for risk management - Buy a larger position close to or at a cycle low, and reduce as we get deeper into the cycle.
Cycle Trading Guidelines
Cycle analysis helps us to determine where we are in the current cycle to help steer us towards a higher probability set-up that matches our risk tolerance.
The ideal time to buy is at a cycle low.
* There are 4 cycle lows that we look for:
– The daily cycle low
– The intermediate (weekly) cycle low
– The yearly cycle low
– the multi-year cycle low
– The status of the yearly & multi-year cycles are the back drop as we monitor the interaction of the daily cycle with the intermediate cycle.
* Generally a swing low in the cycle’s timing band for a low has good odds of spotting the cycle low.
* Place Stop below the cycle low.
* Further confirmation arrives with a break of the declining trend line.
* The yearly cycle low provides the best opportunity of the year for gains.
* Next the intermediate lows (2 or 3 times per year) provide the next best opportunity for gains.
* Followed by the daily cycle low (2 to 4 per weekly cycle).
Cycle Bands
Uptrend Buy Signals
* A swing low above the lower cycle band.
* A close above the upper cycle band.
Downtrend Buy Signals
* A close above the lower cycle band.
* A close above the upper cycle band.
https://lmtoolbox.wordpress.com/6-cycle-trading-guidelines/
Last edited:
robo
TSP Legend
- Reaction score
- 471
Shorting stocks is not something most will want to do. I have most of my money in cash earning 3% to 4.5% and when I do place a short position they are "small"...
The process of shorting a stock is relatively simple, yet this is not a strategy for inexperienced traders.
Only knowledgeable, practiced investors who know the potential implications should consider shorting.
--Fidelity Active Investor, "How to Short Stocks", Fidelity.com, November 23, 2022.
How to short stocks
Shorting makes money when an investment decreases, but there are risks.
FIDELITY ACTIVE INVESTOR – 11/23/2022
https://www.fidelity.com/viewpoints/active-investor/selling-short?ccsource=email_monthly_AT
robo
TSP Legend
- Reaction score
- 471
Baby Bear Done, Mama Bear Next
Nov. 28, 2022 9:00 AM
As we transition from the first to the second year of a three-year U.S. equity bear market, we are likely to have a similar transition as we had experienced in 2000 to 2001.
Throughout 2022, the U.S. dollar, emerging market securities, and highly speculative assets (think cryptocurrencies) also behaved as they generally do during the first year of major bear markets.
Expect U.S. Treasuries and VIX to surge sharply higher during the first half of 2023, partly to compensate for their overdone 2022 weaknesses.
https://seekingalpha.com/article/45...utm_source=seeking_alpha&utm_term=29822741.46
robo
TSP Legend
- Reaction score
- 471
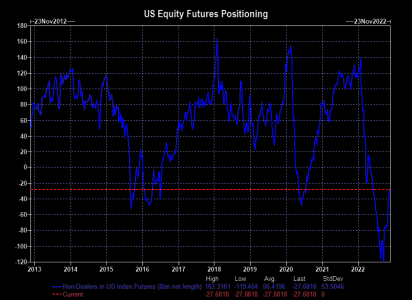
Chasers have been busy
The huge US equity net short is gone, but we are far from a meaningful net long. Noteworthy is the fact skew has caught some bids lately as people have closed out shorts. The increase in skew suggests people are switching into hedging the downside via puts, instead of running those delta 1 shorts.
https://themarketear.com/posts/ch972zYZY8
Attachments
robo
TSP Legend
- Reaction score
- 471
One would think the Bulls will cause a nice move back above the 200 day MA in the months ahead. We shall see how it plays out. Long the gold miners and shorting XLE.
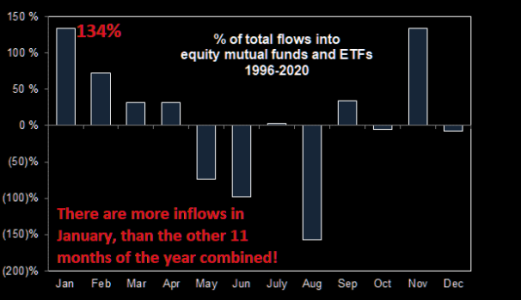
Time to think about the January effect?
Scott Rubner on the January effect: "~134% of the FULL YEAR Inflows Happen in January, think 401k/529/company match." January is bigger than all the other months combined...
Time to think about the January effect?
Scott Rubner on the January effect: "~134% of the FULL YEAR Inflows Happen in January, think 401k/529/company match." January is bigger than all the other months combined...
Attachments
robo
TSP Legend
- Reaction score
- 471
SPX daily as we head into the close: Back below the 10 day MA. A possible shakeout of the weak hands before the Santa Rally? I don't know, but we are getting deeper into this daily cycle. We shall see if the SPX moves back down into a DCL, and then we get the Year End Santa Rally! I don't make guesses, but I take trade based on my the data I use. Which gives me odds for a possible winning trade.
Flat SPX/SPY......
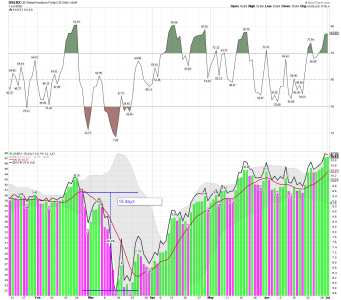
Still ST trading the miners..... If Jeff's SKI system was correct gold and the miners will soon start moving much lower. I posted that data last week. Sometimes Jeff sends out a free report.
See comments and link below:
His comments: """Now, you should easily see that the green 92-96 index line (the index’s back prices) is plunging. If/When USEX soon rises to above that line it’ll reach 3rd resistance. THIS IS NOT YET A SKI BULL MARKET. A SKI bull requires a rise to above the green line, then a decline back below it, and then a rise back above it (ala January 2016, March 2020, and most of the other bull markets since 1974). Yes, it’s possible that the gold stocks will just continue to rise over weeks without a real correction, but that would be a major BEAR market rally. The real bull appears to “SKI-need” a correction into mid-December to go back below the 92-96 index (probably as that green line rises back up to USERX $10) and then a quick rise back above the index’s line as that green line plunges again.""""
321gold: Special SKI Report #279 SKI?s Explanation for the Rise by Jeff Kern . . .inc
I don't use the SKI system for trading, but have the upmost respect for any mechanical trading system that is supported with historical data. If his SKI data plays out look for a move deep below the 10 day MA into mid December, and a BT of the 50 day ma. His call for weakness was based on the historical data of his SKI system. I'm still only ST trading the miners. I buy and sell them often...
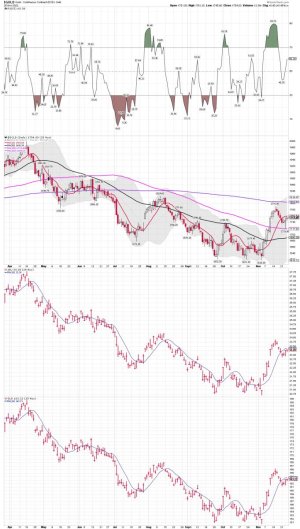
GOLD/GLD/IAU daily chart: All remain below their 10 day MA's...... We shall see how it all plays out as the dollar continues to make huge swings....
Attachments
Last edited:
robo
TSP Legend
- Reaction score
- 471
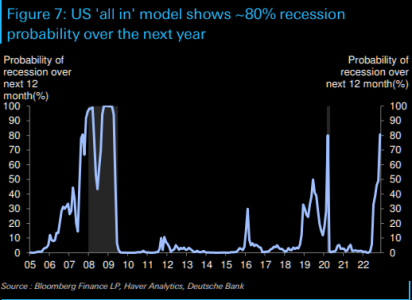
25% down from here
DB continues their bearish outlook and sees the recession they have been anticipating draw closer. Bottom line is basically: "We see major stock markets plunging 25% from levels somewhat above today's when the US recession hits, but then recovering fully by year-end 2023, assuming the recession lasts only several quarters." Chart showing recession probability. Looks like a done deal...
https://themarketear.com/

