Bear Cave 2 (Bull Allowed)

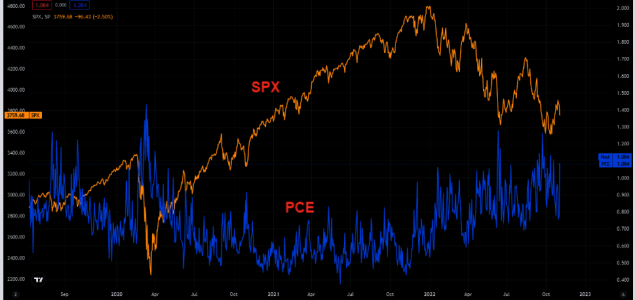
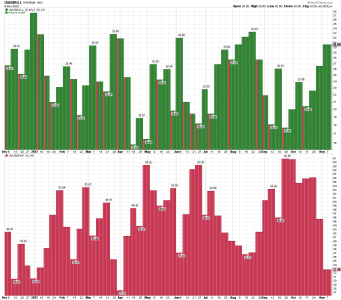
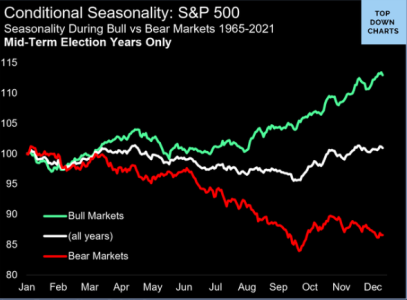
Remember "bear market seasonality"?
This is about the time the fun stops.

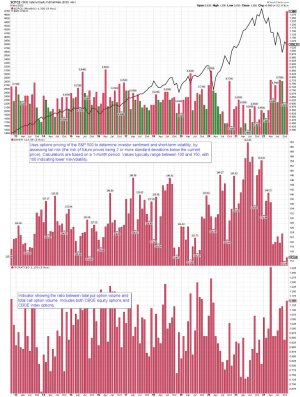
They did it again
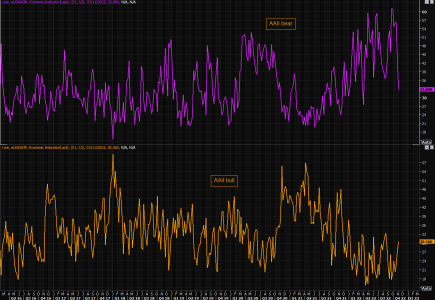
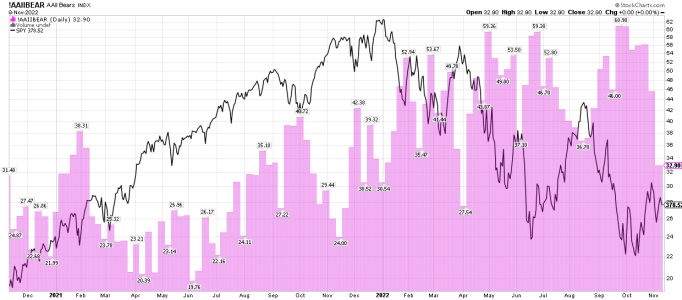
The crowd hated puts at the most recent market highs, and decided to love them as we moved sharply lower post Fed.
https://themarketear.com/posts/c_rlL03joA
 

Attachments

  • a.png
    a.png
    95.4 KB · Views: 73
  • a.png
    a.png
    104.6 KB · Views: 73
Will shall see!


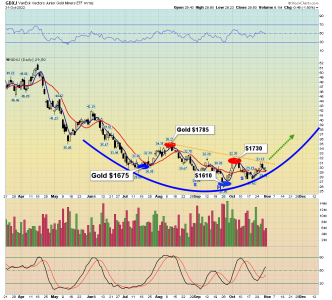
Please click here now. Double-click to enlarge this GDXJ chart. Many gold stocks have enormous rectangle and rounding bottom patterns in play, and that suggests much higher prices in the months ahead. When the institutional tidal waves into the miners begin to occur, it will be because inflation is a much bigger problem than it is now, and the gold stocks will be priced significantly higher than they are now. Simply put, it’s the birth of a fabulous gold bull era and no gold bug will be left behind!


3 2 1 g o l d ... Welcome!

https://galacticupdates.com/wp-content/uploads/2022/11/2022nov1j1.png
 

Attachments

  • a.png
    a.png
    116.4 KB · Views: 77
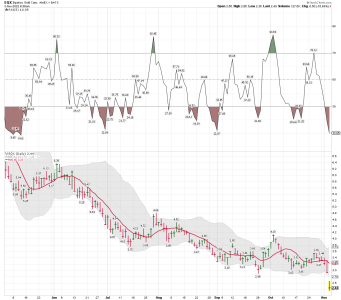
EQX daily: All I can say is OUCH!!!

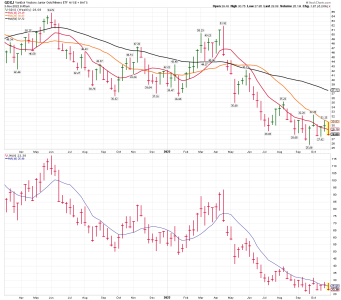
GDXJ not too bad, but back under the 10 week ma.

GDXJ weekly: Looks to back test the lows and a possible lower low.
 

Attachments

  • a.png
    a.png
    66.8 KB · Views: 70
  • a.png
    a.png
    44.7 KB · Views: 69
Last edited:
Range trading next?
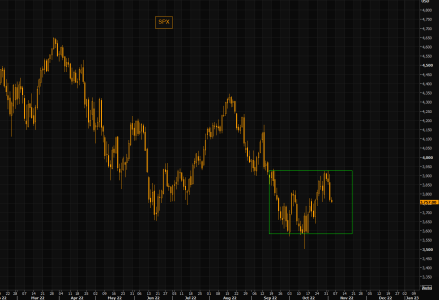
JPM's Andrew Tyler on the possible range coming up: "The question now is do we retest YTD lows (3577)? To do so we likely need another catalyst which could be an escalation of geo-political conflicts or, and more likely, need to see an increase in CPI prints rather than lower-than-expected declines in CPI. Given that the SPX has held 3600, several clients have expressed hesitancy to press shorts on the view that we break those lows. This may mean that we are set in a range of approximately 3700 – 3900. Though this range may shift lower if the Fed fails to stepdown its rate hike magnitude."

SPX futures so far - up around 250 points from October lows at 3502, down around 170 points from recent highs 3928. This is actually a range...


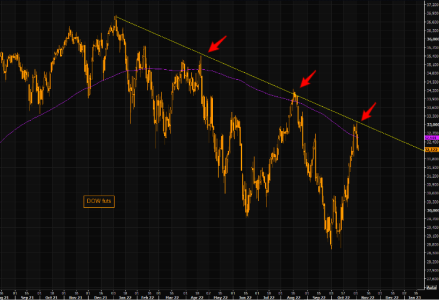
Dow - now what?
Not everything is trading as poorly as tech, but Dow futures have so far reversed right in the 200 day moving and the negative trend line. Let's see where we go from here, but watching Dow is more important these days than in a long time...
https://themarketear.com/posts/cQMcHE4uhK
 

Attachments

  • a.png
    a.png
    32.3 KB · Views: 77
  • a.png
    a.png
    60.2 KB · Views: 79
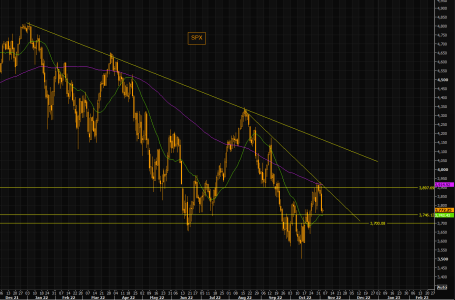
SPX - levels to watch
SPX is close to the 21 day moving average. Support levels are 3750 and then the 3700 level (Wilson's stop). First real resistance is at 3900. Note the 100 day trading right at that resistance. Earnings season is fading, Fed was slightly more hawkish, the buy back bid is still alive...Maybe this market needs to consolidate before the next leg is decided...

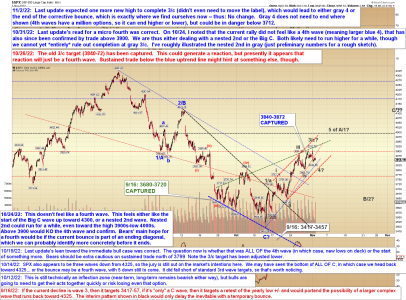
I DO NOT trade using this type of data for trading (waves), but I do track it. (See link below.)


Pretzel Logic's Market Charts and Analysis
 

Attachments

  • a.png
    a.png
    50.9 KB · Views: 84
  • a.png
    a.png
    277.3 KB · Views: 84
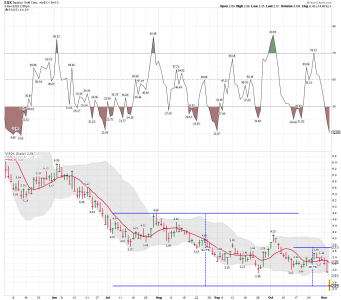
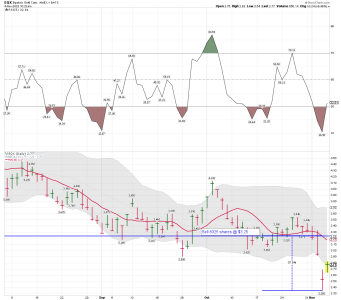
EQX dally: Talk about a BB crash trade...... Now, can EQX get back to the upper BB in the weeks ahead.
 

Attachments

  • a.png
    a.png
    66.7 KB · Views: 77
Last edited:
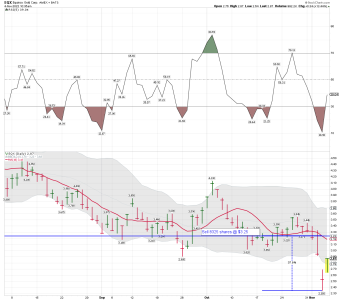
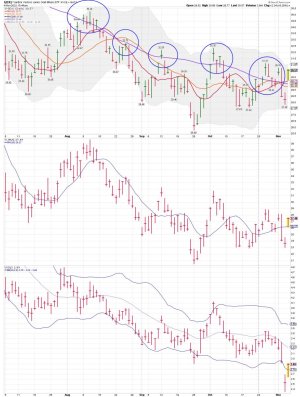
EQX/GDXJ daily: Reducing EQX by 1/2.... Crazy moves by the dollar.....

For the record: I ONLY ST TRADE this sector...... I had some shares of EQX at higher prices, but they were just sold because my account is FIFO when selling..... Still, a nice gain so far overall. Best not to trade EQX and stick with GDXJ or GDX.... My GDXJ shares are doing well..... Holding most, but will reduce before the end of the day. GDXJ upper BB be up next. We shall see if it can stay above the 50 dma in the days ahead. "IF" it does, it should bring in more buyers. In my opinion, and based on 100's of trades made, using the miners, this NOT a sector you want to use stops! I use other indicators, and I like to trade the lower BB crash trades or extremes when taking positions in this sector. It has been in a Bear market for years now so these trades are all counter-trend.

11/03/2022 09:31:41 Bought 3000 EQX @ 2.4499

11/03/2022 09:32:06 Bought 3000 EQX @ 2.4499

11/03/2022 09:30:33 Bought 2000 EQX @ 2.565
 

Attachments

  • a.png
    a.png
    50.5 KB · Views: 71
  • a.jpg
    a.jpg
    151.4 KB · Views: 73
Last edited:
The (tech) economy is heading off a cliff
"It feels like the economy is heading off a cliff right now. In our larger portfolio of companies I can see the trajectory. After Q1 board meetings 1/3 were missing their numbers and it felt like the ones missing were related to these specific companies, not a macro trend. After Q2 board meetings 2/3 were missing and after Q3 board meetings, like now, the entire portfolio is re-forecasting. Even the best companies are seeing major headwinds. This is an economy wide-slowdown" (David Sachs)
https://themarketear.com/posts/c5eakbT5Pb
 
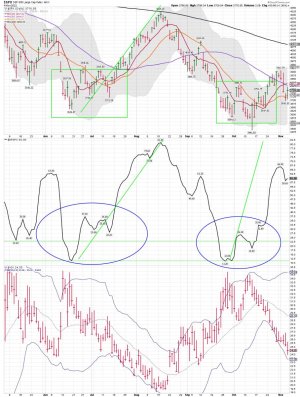
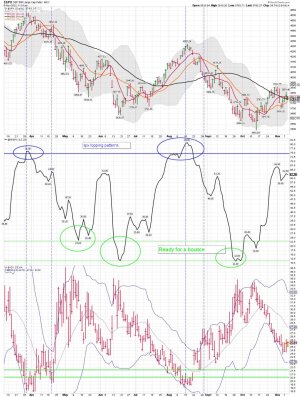
We shall see if the Market is out of Breath.... My SPX pattern indicates it is getting a tad stretched for Bear Market rally.

SPX daily pattern: The SPX remains below the 10 and 50 dma...... I remain on the sidelines....... We shall see if buyers come in and can move the index back above the 10 and 50 dma next week. One would think another push higher is coming soon..... I will be watching for now and trading the miners while I wait for the next setup.


Technical Analysis of Stock Market | Out of Breath
https://www.youtube.com/watch?v=L6AugBZpXRI
 

Attachments

  • a.jpg
    a.jpg
    188 KB · Views: 81
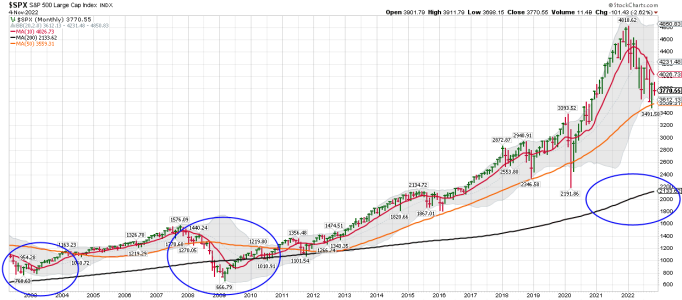
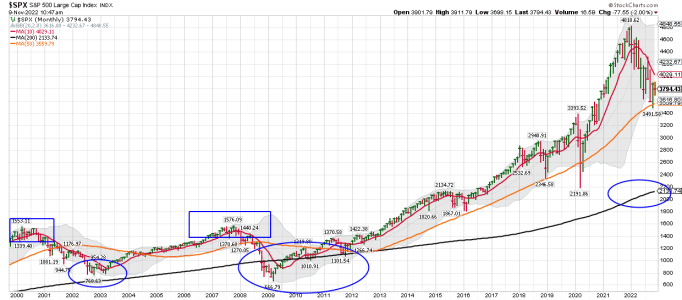
It's my opinion this Bear Market will be over 24 months: See the SPX monthly chart below..... Big Bear likes to maul it's way down to the the 200 month MA. This is still just a Mama Bear.... My opinion is based on the 2000 and 2008 Bear Markets. I traded during both of those Bears and bought WAY to early on the way down. It took me years to recover my loses.


Some positives
Supportive flow dynamics
Equity issuance was light in October (sub-$4bn issued on the month), which is the 2nd lightest month of issuance YTD and the 12th lightest month since 2000. Buybacks are estimated to be running at a pace of $3-4bn / day. Buybacks should rise to a pace of $4-5bn / day as companies report earnings / exit blackout periods. (MS QDS)

Hedge fund positioning
US Equity L/S net leverage sits at 41%, which is relatively light vs short-dated history and even more extreme compared to long-term averages at the 30th and 9th %ile vs the last 1y and 5y. US Equity L/S Gross leverage at 181% is similarly light at the 28th and 13th %ile vs the last 1y and 5y (MS PB Content team).
https://themarketear.com/

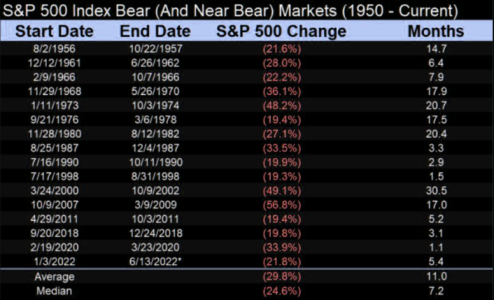
This bear market is aging rapidly
The bear market is almost 11 months senior. Remember, the average bear market lasts 11+ months and median 7+ months.
 

Attachments

  • a.png
    a.png
    262.1 KB · Views: 80
  • a.png
    a.png
    41 KB · Views: 77
Last edited:
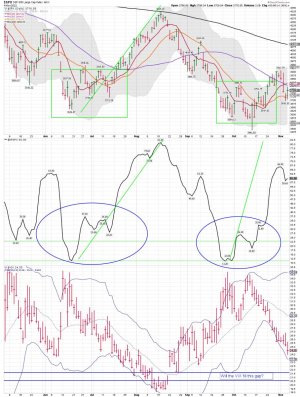
I still think the VIX heads to the lower 20ish before this move up is complete. However, since I'm flat I will just wait and see how it plays out. My next trade could be SDS or SSO....It's STBD!

VIX is now down 15 days straight
VIX is now down 15 days straight despite SPX down sharply from its highs. Friday marked the first day since 2012 where VIX and SPX both closed at 10 day lows. No bear market has ever bottomed without VIX at 45+, 83% above Friday’s close. (Kobeissi)
 

Attachments

  • a.jpg
    a.jpg
    191.9 KB · Views: 83
This Market Reveals a Strong Clue About What’s Coming Next
Frustrating.

That’s how I’d describe the Fed’s latest performance… and Fed Chair Jerome Powell has certainly made the Fed an easy target for angry investors.

You see, there are two parts to “Fed Day.”

The first part is at 2 p.m. ET – when the market finds out what the Fed’s interest rate decision is.

Now, I’ll give the Fed some credit. Their 75-basis point hike was well telegraphed.

The market has been expecting this interest rate hike for a while. If the interest rate increase was unexpected, then the action on Wednesday could’ve been worse.

The Fed also releases their latest policy statement at the same time as their interest-rate decision.

This allows investors to see what (if anything) has changed from the prior statement.

The policy statement is crucial because it can give the market insights as to what the Fed is going to do next.

The initial reaction to the new statement was quite positive and the market rallied sharply for a few minutes…

That’s because the new statement said the Fed was considering the cumulative impact of its rate hikes to date.

The market interpreted this to mean that the Fed would soon slow down the pace of future interest rate increases.
https://www.jeffclarktrader.com/mar...de-a-surging-dollar-our-best-market-clue-yet/
 
We shall see - The Gold Miners have been trending down for a longtime now! Still ST trading GDXJ....


Why Money Is Migrating Into a Gold Rush
It’s not safe to hold stocks right now. So, if you’re managing your own money, then you’ll want to know how to protect your downside. My strategy could help you make back every cent you lost this year – and then some.

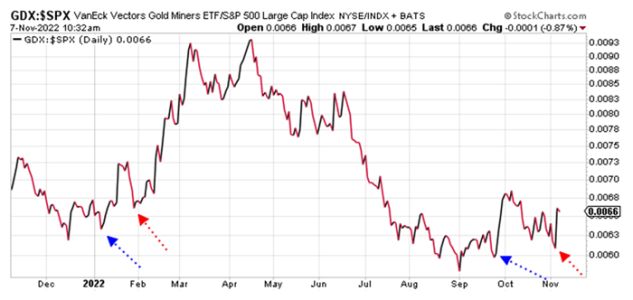
The blue arrow in late September marks the first “higher low.” Gold stocks enjoyed a nice rally right after that.

It looks like the action last week formed another higher low (the second red arrow).

If that’s accurate, then we now have a confirmed uptrend in place. That means the gold sector should outperform the broad stock market for the next several weeks.

It’s possible we could see a move similar to what happened back in February and March, as money comes out of the broad stock market and flows into the gold sector.

If so, gold stocks will be sharply higher by the end of the year.

Best regards and good trading,

https://www.jeffclarktrader.com/market-minute/why-money-is-migrating-into-a-gold-rush/
 

Attachments

  • a.png
    a.png
    31.6 KB · Views: 66
GDXJ/EQX daily: Another nice move up for the miners today... GDXJ is getting a tad stretched above the 10 dma for me. I will keep pointing out I'm a trader in this sector NOT AN INVESTOR.

Taking some more profits......

Long GDXJ and EQX.....
 

Attachments

  • a.jpg
    a.jpg
    150.4 KB · Views: 69
Silver has been the biggest tease and it's always tough to trade -zigging when you think it's going to zag, etc. It looks like it's temping the bulls again. Fool me once... Time to short it? SLV hit 19.91 today.
 
SPX monthly: Based on this chart, and the last two bear Markets I traded, it's still my opinion we are moving much lower in the next 24 months. The data on the chart is clear..... Big Bears tend to move MUCH closer to the 200 month MA before they are done chewing up investors. I will continue to post this chart in the months ahead. With that said, I will be looking for some excellent Bear Market rallies to trade as the rubber band gets stretched both ways as the SPX continues its move down to the 200 month MA.
 

Attachments

  • a.png
    a.png
    41 KB · Views: 54
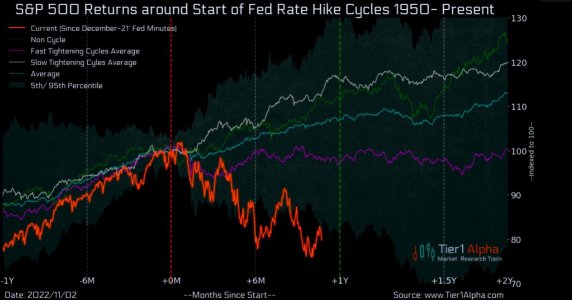
Hawkish enough?
SPX returns around rate hike cycles over the past 70 years. We are rather low in this chart, below the lowest 5th percentile of projected returns...
https://themarketear.com/
 

Attachments

  • a.jpg
    a.jpg
    83.3 KB · Views: 57
VIX daily: I still think it's headed to the low 20ish area.....

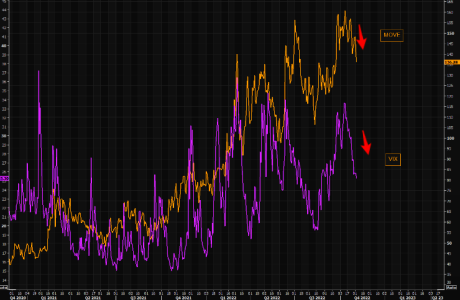
Global "fear" continues resetting
Both VIX and bond volatility, MOVE, continued moving lower today. As we have been writing for the past sessions, VIX is still not dirt cheap, and bond volatility remains elevated, despite the latest move lower.
https://themarketear.com/
 

Attachments

  • a.png
    a.png
    66.4 KB · Views: 56
  • a.jpg
    a.jpg
    205.2 KB · Views: 57
Back
Top