-
The Forum works well on MOBILE devices without an app: Just go to: https://forum.tsptalk.com
-
Please read our AutoTracker policy on the IFT deadline and remaining active. Thanks!
-
$ - Premium Service Content (Info) | AutoTracker Monthly Winners | Is Gmail et al, Blocking Our emails?
Find us on: Facebook & X | Posting Copyrighted Material
-
Join the TSP Talk AutoTracker: How to Get Started | Login | Main AutoTracker Page
You are using an out of date browser. It may not display this or other websites correctly.
You should upgrade or use an alternative browser.
You should upgrade or use an alternative browser.
Bear Cave 2 (Bull Allowed)
- Thread starter robo
- Start date
robo
TSP Legend
- Reaction score
- 471
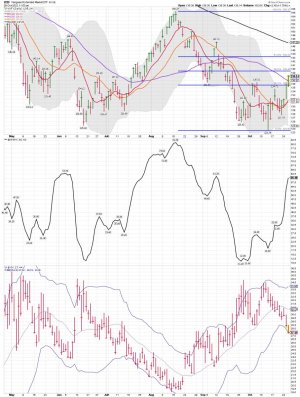
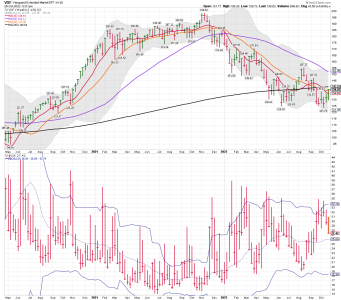
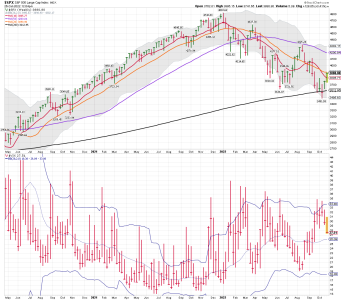
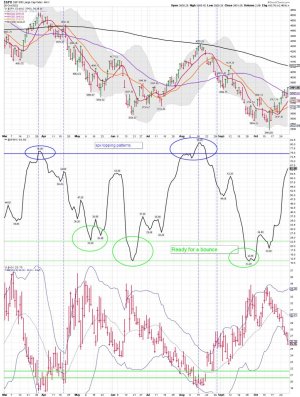
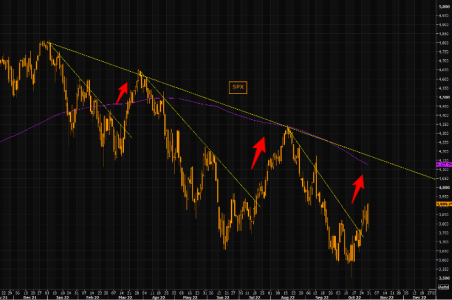
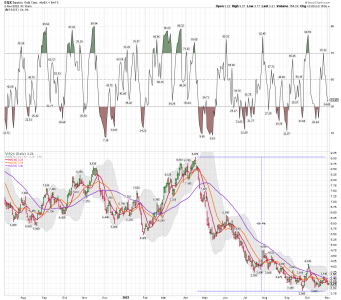
SPX daily: Selling my remaining shares of VXF at Vanguard and will wait for the next setup. Today's move up tagged and moved above the 50 dma. We shall see how we close and the 200 dma be up next. The 200 dma has been tough resistance this year. We shall see if the VIX fills the gap around 21ish before this run up completes.
Flat stocks, and long GDXJ! Bear Market rules apply....
Good Trading.
Flat stocks, and long GDXJ! Bear Market rules apply....
Good Trading.
Attachments
robo
TSP Legend
- Reaction score
- 471
VXF daily (S Fund):
Still looking good, but I will be flat by the end of the trading day at Vanguard. It's my "OPINION" the next leg down will be a lower low. Don't know when that will happen, but I will be in cash and just watching. Two year notes are making close to 5% now..... I'll take it for some of my funds!
The 200 dma be up next...
Attachments
robo
TSP Legend
- Reaction score
- 471
robo
TSP Legend
- Reaction score
- 471
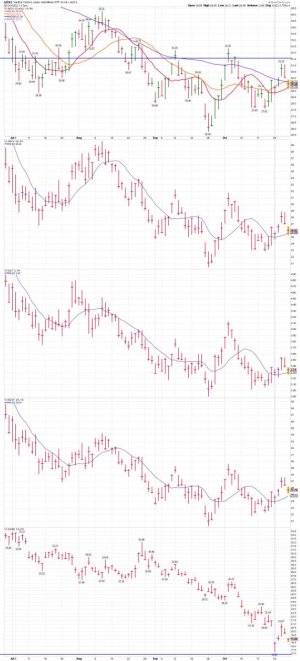
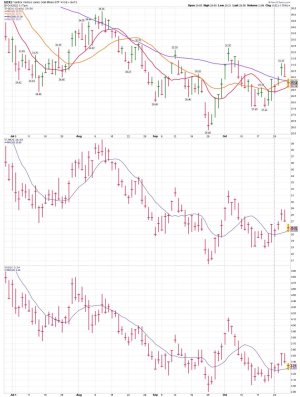
GDXJ daily and my current positions: Back testing the 10 dma.... We shall see if it holds and it's "POSSIBLE" the low is in for this daily cycle and its going to be a right translated daily cycle formation (Bullish). Wednesday was day 22 for the daily cycle. We shall see how it plays out, and if it can get back above the 20 and 50 dma's.....
Long the miners....
Long the miners....
Attachments
Last edited:
robo
TSP Legend
- Reaction score
- 471
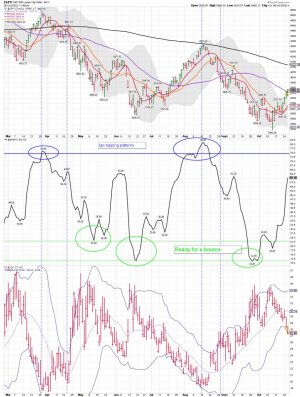
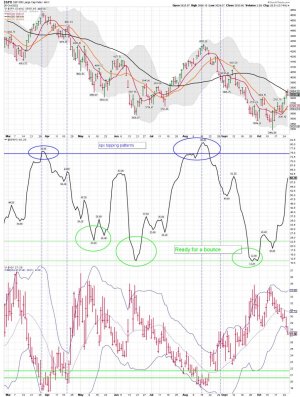
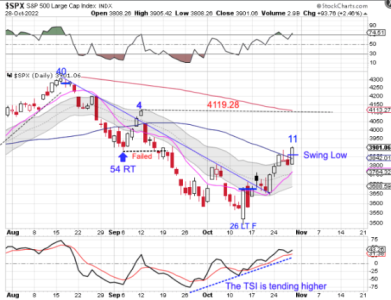
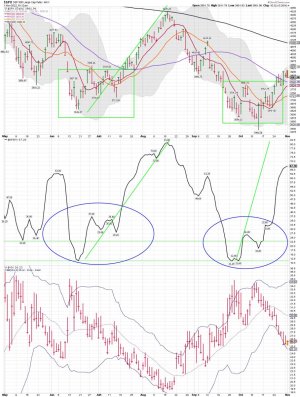
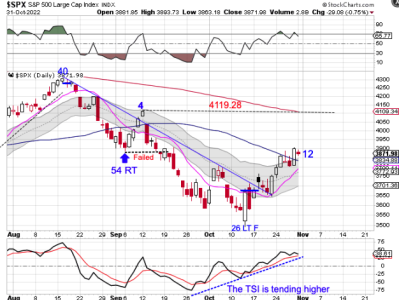
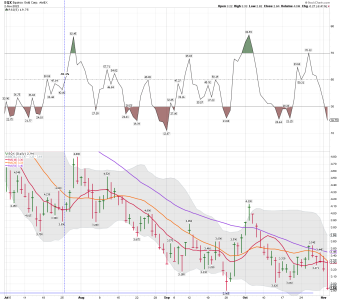
SPX daily: Getting closer to the 200 dma. My next trade will probably be SDS once the pattern completes. I'm still trading using Bear Market rules. The pattern indicates the VIX should hit the lower 20ish level, and the 200 dma "SHOULD" be tested. I'm flat SPY and VXF..... Also, a really NICE move up Friday! We shall see how this all plays out as we enter the best to months of the year for stocks. Along with the cycle data, and a few other indicators, this pattern is only used for risk management. Daily 11 in the current daily cycle......
Stocks closed above the 50 day MA on Friday.
Stocks are in a daily uptrend. Forming a swing low above the upper daily cycle band indicates that stocks will remain in their daily uptrend and signal a cycle band buy signal. The next major resistance looks to be the previous daily cycle high and the 200 day MA.
https://likesmoneycycletrading.wordpress.com/2022/10/29/the-10-22-22-weekend-report-preview-2/
Attachments
Last edited:
robo
TSP Legend
- Reaction score
- 471
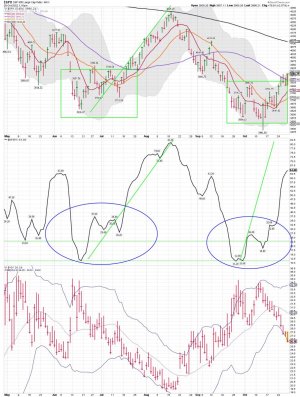
SPX - playing out the same movie again
The June/July set up we have been mentioning continues performing very well. The psychology is very similar to what we have seen several times this year. Imagine the pain SPX decides to test the 200 day moving average again...
The June/July set up we have been mentioning continues performing very well. The psychology is very similar to what we have seen several times this year. Imagine the pain SPX decides to test the 200 day moving average again...
Attachments
robo
TSP Legend
- Reaction score
- 471
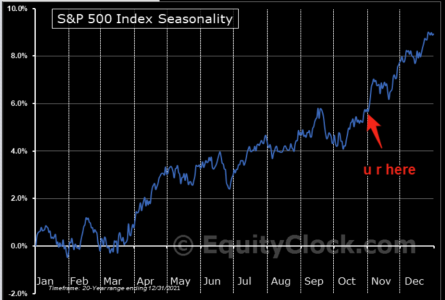
Santa rally time
Imagine the agony if we go for the year end seasonality from here...
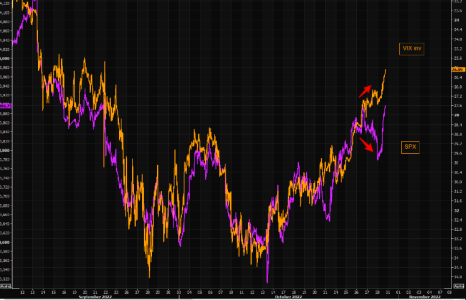
VIX knew and knows
Quick update of the increasingly exuberant VIX. "It" does not care about poor tech earnings, that is old news.
https://themarketear.com/
Imagine the agony if we go for the year end seasonality from here...
VIX knew and knows
Quick update of the increasingly exuberant VIX. "It" does not care about poor tech earnings, that is old news.
https://themarketear.com/
Attachments
robo
TSP Legend
- Reaction score
- 471
https://twitter.com/jessefelder
7 reasons why high inflation may be here to stay, according to Oxford Economics
https://www.marketwatch.com/story/7...vkpwtets2&mc_cid=5b1e446f67&mc_eid=5b348a9ca0
https://mailchi.mp/felder/controlled-burn?mc_cid=5b1e446f67&mc_eid=5b348a9ca0
7 reasons why high inflation may be here to stay, according to Oxford Economics
https://www.marketwatch.com/story/7...vkpwtets2&mc_cid=5b1e446f67&mc_eid=5b348a9ca0
https://mailchi.mp/felder/controlled-burn?mc_cid=5b1e446f67&mc_eid=5b348a9ca0
Attachments
robo
TSP Legend
- Reaction score
- 471
Focus On The War, Not The Battle
Why do most traders lose most of the time?
Why is it so many investors will stay with a position as it loses, hoping it will bounce back, instead of cutting their losses? And why do those same investors, when they have a winning position, take quick profits instead of letting the trend play out?
It is all about emotions. Not wanting to lose. Wanting to feel good about a profitable position. But unable to make consistent profits.
It's Not The Battle, It's The War
Too many market timers believe their last trade is a reflection of just how good a timer they are (or how good their timing service is).
This boils down to one word - expectation.
If you expect to win all the time, or even the large majority of the time, you're setting yourself up for a lot of heartache.
And the sad fact is, if you believe market timing is about winning all the time, you are also setting yourself up to be one of those many thousands of losing investors.
To win as a market timer, you must focus on the war - not the battle.
The fact of the matter is, this is to a large degree a game of odds, and should be played over a long period of time. Those market timers who recognize this fact, and do not pull out during a losing position will be the winners in the end.
Market timing is about beating the markets, and all those "other" thousands of losing investors, over time. It is about following a timing strategy through thick and thin, and profiting over time.
https://www.fibtimer.com/subscribers/fibtimer_commentary.asp
robo
TSP Legend
- Reaction score
- 471
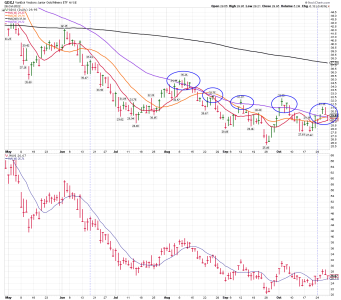
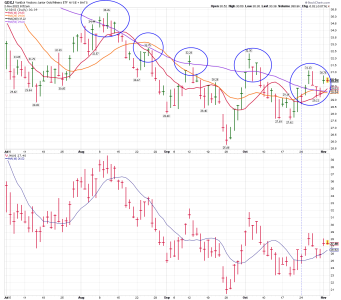
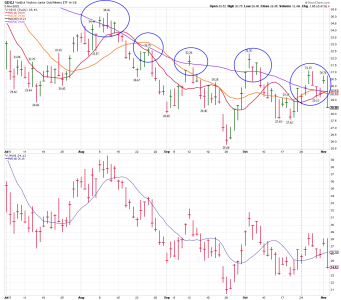
GDXJ daily: This is the 5th time since august that GDXJ has moved above the 50 dma. We shall see if this is the move that it heads back up to tag the 200dma. So far they have all failed. The 50 dma remains under the 200 dma in a downtrend. For a true Bull Market to really get going the 50 dma needs to get back above the 200 dma. LOL.... We shall see how that plays out.
I'm still long some GDXJ.
I'm still long some GDXJ.
Attachments
robo
TSP Legend
- Reaction score
- 471
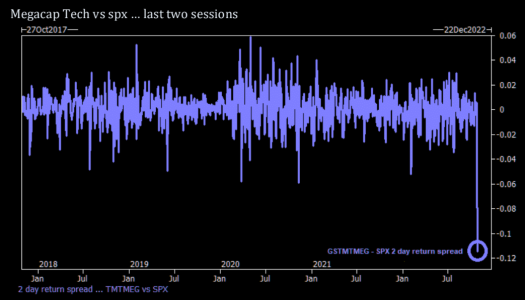
Killing the generals in a pic
Market able to move higher despite the mega cap puke. This is truly impressive...
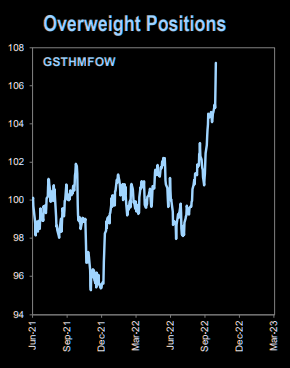
Consensus monkey crushing it
Overweight positions among mutual funds (US data) are crushing it right now....
https://themarketear.com/posts/cvfJtsErow
Market able to move higher despite the mega cap puke. This is truly impressive...
Consensus monkey crushing it
Overweight positions among mutual funds (US data) are crushing it right now....
https://themarketear.com/posts/cvfJtsErow
Attachments
robo
TSP Legend
- Reaction score
- 471
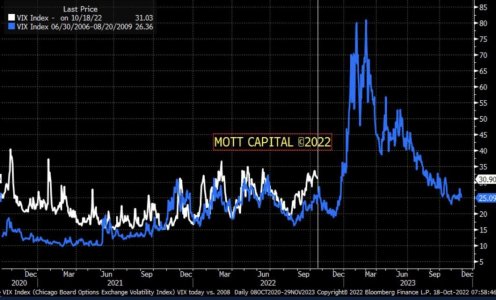
VIX - Comparing 2022 to 2008: Hmmm.....
https://www.reddit.com/r/wallstreet...ix_2008_vs_2022_update_from_michaelmottcm_on/
https://www.reddit.com/r/wallstreet...ix_2008_vs_2022_update_from_michaelmottcm_on/
Attachments
robo
TSP Legend
- Reaction score
- 471
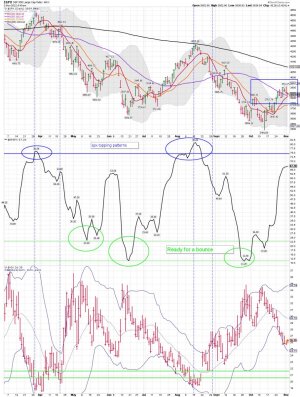
SPX daily trading pattern: Having some trouble as the pattern looks to be getting tired. We shall see how it plays out. We are still in the best two months of the year and one would think the 200 dma would get tagged during this run....
Flat SPY and VXF!
Why Bullish Investors Shouldn’t Get Their Hopes Up
By Jeff Clark, editor, Market Minute
October 2022 was the best month for the stock market since January 1976.
The Dow Jones Industrial Average (DJIA) gained more than 14% in October.
It was a bear-crushing rally.
And it has raised the hopes of bullish investors as we head into the seasonally bullish period of November and December.
Please allow me to crush those hopes…
https://www.jeffclarktrader.com/market-minute/why-bullish-investors-shouldnt-get-their-hopes-up/
Attachments
robo
TSP Legend
- Reaction score
- 471
SPX daily: A big day for the SPX as it bounces around the 50 dma.... 75 points is baked in the cake... It will be the Fed Speak that could cause some market action by investors. Will it be up or down is the question?
Bottom Line: For now the trend for the SPX remains up as the SPX remains above its 10, 20, and 50 dma's. Still thinking we could tag the 200 dma this run as the VIX moves back down the lower 20ish. However, that's a guess.
I remain flat the S and C fund.
Long the miners.....
Bottom Line: For now the trend for the SPX remains up as the SPX remains above its 10, 20, and 50 dma's. Still thinking we could tag the 200 dma this run as the VIX moves back down the lower 20ish. However, that's a guess.
I remain flat the S and C fund.
Long the miners.....
Attachments
Last edited:
robo
TSP Legend
- Reaction score
- 471
SPX cycles data: We shall see how this plays out.
Consolidation
Stocks closed above the upper daily cycle band last Tuesday, causing them to get extended above the 10 day MA.
Stocks have been trading sideways, which is allowing the 10 day MA to catch up to price. Stocks are in a daily uptrend.
stocks will remain in their daily uptrend unless they close below the lower daily cycle band.
https://likesmoneycycletrading.wordpress.com/
Attachments
robo
TSP Legend
- Reaction score
- 471
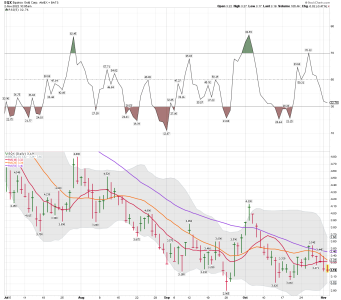
EQX daily: Buying some EQX again. We shall see if this move down ends up a higher low, a back test of the low, or a lower low.....
Limit orders = 3.15, 3.10, 3.00, 2.95 and ( 2.90 which would back test the low) EQX remains in a downtrend and there is NOTHING Bullish about this chart. Trying to catch the falling knife as I still think the miners are getting ready for another bounce like they did in September. I made some good money on that run and went back to only ST trading. This is a VERY TOUGH sector to trade as the Bear Market for the miners continues.
Limit orders = 3.15, 3.10, 3.00, 2.95 and ( 2.90 which would back test the low) EQX remains in a downtrend and there is NOTHING Bullish about this chart. Trying to catch the falling knife as I still think the miners are getting ready for another bounce like they did in September. I made some good money on that run and went back to only ST trading. This is a VERY TOUGH sector to trade as the Bear Market for the miners continues.
Attachments
Last edited:
robo
TSP Legend
- Reaction score
- 471
GDXJ daily: Lots of stops were probably hit today....... Waiting to see if it will be a higher low, a Back Test of the low or a lower low.......
I sure lost a few bucks today....
Long GDXJ and EQX..... We shall see how tomorrow plays out.... So far EQX looks like we "MIGHT" get a higher low, but that is still unconfirmed. I still have open limit orders under $2.90....
I sure lost a few bucks today....
Long GDXJ and EQX..... We shall see how tomorrow plays out.... So far EQX looks like we "MIGHT" get a higher low, but that is still unconfirmed. I still have open limit orders under $2.90....

