Bear Cave 2 (Bull Allowed)

Long some SSO

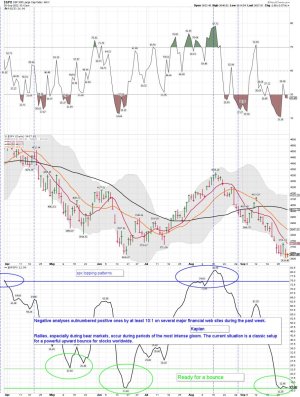
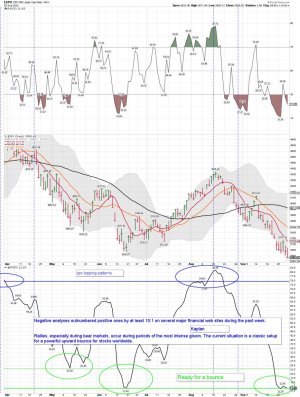
SPX - time for mean reversion agony

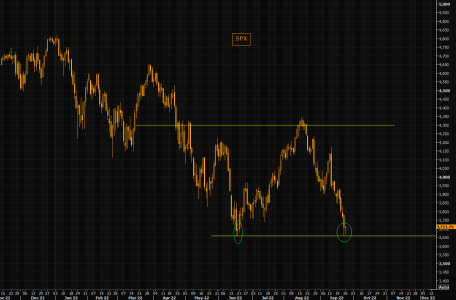
This is how it is supposed to feel; the world about to implode. SPX is down at June lows, currently putting in a hammer candle. We need a confirmation if this is to become a bounce, but don't forget that the SPX has traded stuck in a range for months. As we pointed out in our thematic email over the weekend, there is a lot of fear everywhere (more here). Dare to buy the fear?
https://themarketear.com/posts/cfNYysJw8T
 

Attachments

  • a.png
    a.png
    35.1 KB · Views: 62
Last edited:
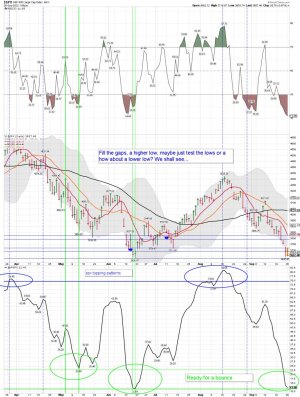
SPX daily: The June low marker continues to hold for now..... Adding a few more share of SSO. We shall see how we close!

Bottom Line: The trend remains down....
 

Attachments

  • a.jpg
    a.jpg
    186.1 KB · Views: 54
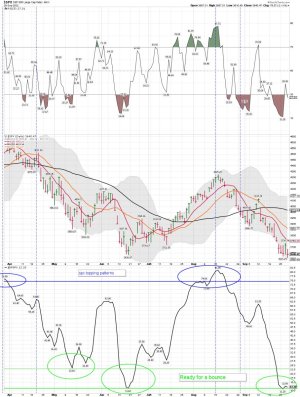
SPX daily: Today the SPX got a back test of the low marker, and an undercut.

Long SSO and I added some more shares. No TSP moves until Monday, but I will place a ST trade next week. We shall see if the pattern plays out and we get the bounce next week.


Bottom Line: The trend remains down and Bear Market rules remain in play.
 

Attachments

  • a.jpg
    a.jpg
    168 KB · Views: 46
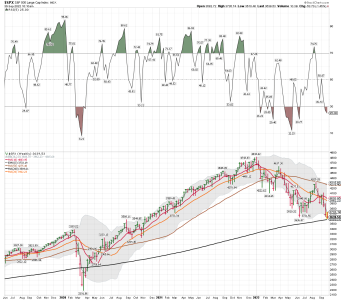
SPX weekly: We shall see if the 200 week MA holds and we get a bounce.....

Long SSO for a trade only.....

Bottom Line: The trend remains down and Bear Market rules are still in play.
 

Attachments

  • a.png
    a.png
    86 KB · Views: 44
SPX daily after the close today, and the completion of Quarterly Expiration:

A lower low...... Many traders don't like holding over the weekend. I normally don't , but I decided to hold my current positions.
 

Attachments

  • a.jpg
    a.jpg
    178.8 KB · Views: 43
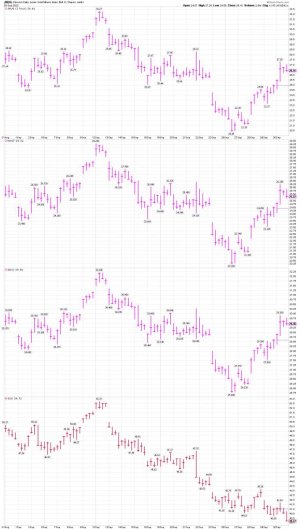
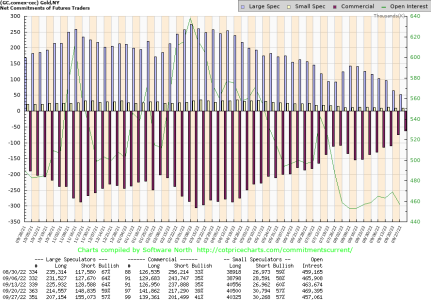
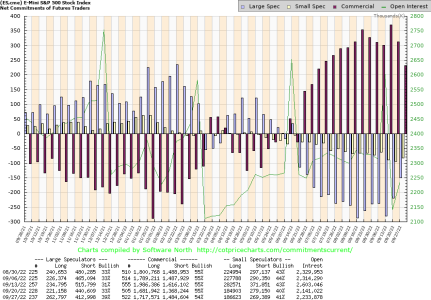
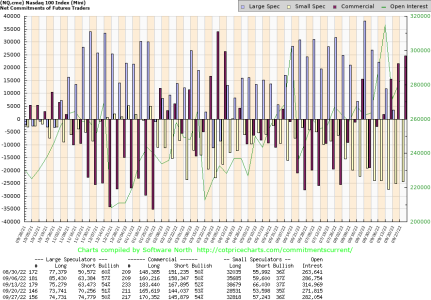
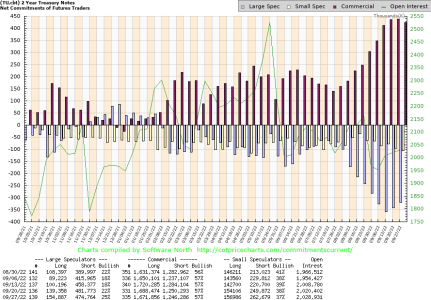
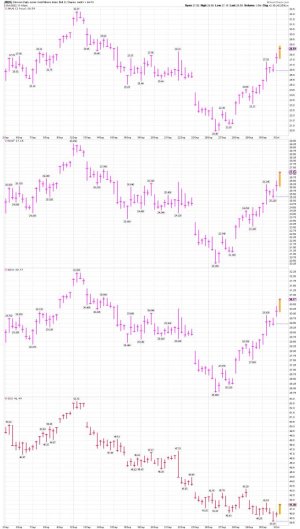
COT GOLD/SP mini and NQ 100/two year notes: I'm trading with the commercials right now. We shall see if we get the bounce..... If not I will get stopped out.


Lots of big money buying two year notes as indicated on the COT report below. Returns moving over 4% and could move higher.

September 20th

Prepare to purchase 26-week and Two year U.S. Treasuries at next Monday's auctions.


Tuesday's intraday high yields for U.S. Treasuries were as follows: 26-week 3.950%; 52-week 4.076%; 2-year 3.992%; 3-year 3.951%. These are compelling 15-year highs so I will be doing twice my usual allocation at Monday's auctions for the 26-week and 2-year U.S. Treasuries.

Kaplan


https://truecontrarian-sjk.blogspot.com/

Current Commitments of Traders Charts
 

Attachments

  • a.png
    a.png
    36.2 KB · Views: 43
  • a.png
    a.png
    40.6 KB · Views: 43
  • a.png
    a.png
    36.4 KB · Views: 43
  • a.png
    a.png
    42.6 KB · Views: 42
Last edited:
The FED DOES NOT have our backs right now......


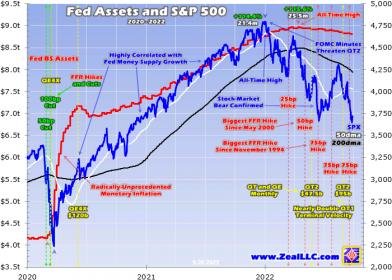
Despite the stock markets already soaring on that epically-unprecedented tsunami of new money, top Fed officials inexplicably kept their monetary printing presses redlined for two more years! By mid-April 2022, the FOMC had monetized an unbelievable $3,288b of Treasuries and $1,368b of MBSs since the eve of that stock panic in late February 2020! That was the most-extreme money-supply growth by far in US history.

In just 25.5 months, the Fed's balance sheet ballooned a stupendous 115.6% or $4,807b! Effectively the monetary base underlying the entire global US-dollar supply, it had been more than doubled in only a couple years! In mid-April 2022 when it finally peaked, that balance sheet weighed in at an outrageously-grotesque $8,965b. Launched before that panic, QE4's total girth had quickly expanded to an insane $4,913b.

The FOMC's mission of levitating US stock markets proved wildly-successful, as this next chart shows. It superimposes the benchmark US S&P 500 stock index (SPX) over the Fed's total balance sheet. That includes all the Treasuries and MBSs it monetized, or created new money to purchase. The stock markets soared as the FOMC's extreme-liquidity fire hoses deluged in, driving up US stock markets in lockstep.
Sep 30, Fed QT2 Imperils Stocks Adam Hamilton 321gold ...inc ...s
 

Attachments

  • z.jpg
    z.jpg
    28.4 KB · Views: 51
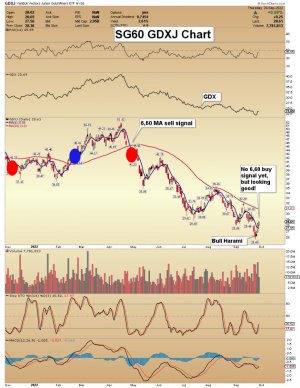
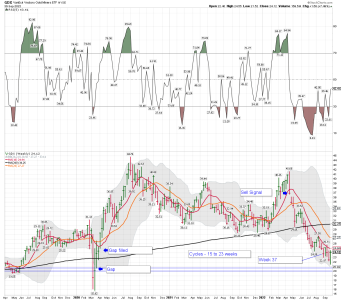
GDX weekly: I'm waiting too to take a larger MT position. I want to see a move above the 10 week MA. Looking good so far...... I continue to only ST trade the miners and had a very good week. LOL.... A good week getting back to even. I trade GDXJ using the GDX chart.....

Bottom Line: The GDX weekly remains below the 10 week MA so still NO BUY signal for me. This is week 24 since GDX moved below it's 10 week MA and produced a sell signal. Grasshoppers we must wait to take MT positions.


Morris: Sep 30, 2022 Mining Stocks: Signposts For A Rally Morris Hubbartt 321gold ...inc ...s
 

Attachments

  • a.jpg
    a.jpg
    145.3 KB · Views: 64
  • a.png
    a.png
    89.2 KB · Views: 63
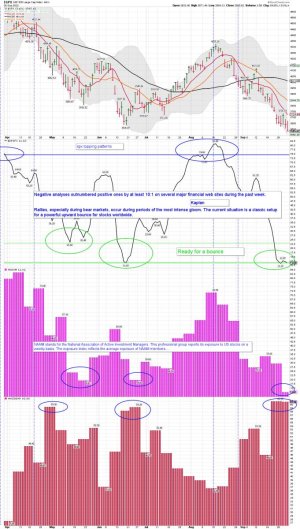
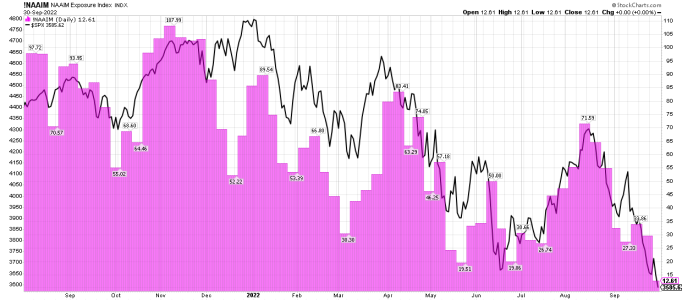
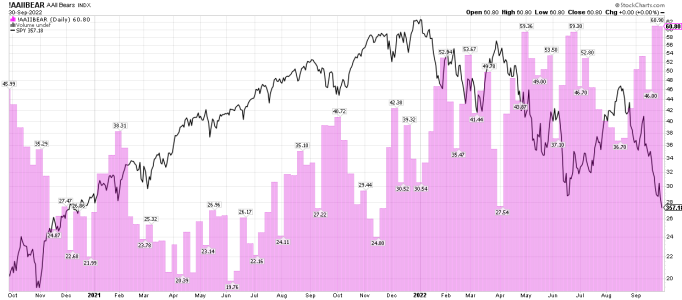
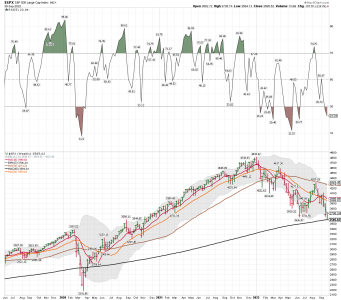
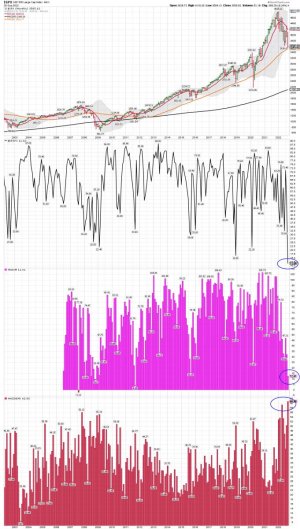
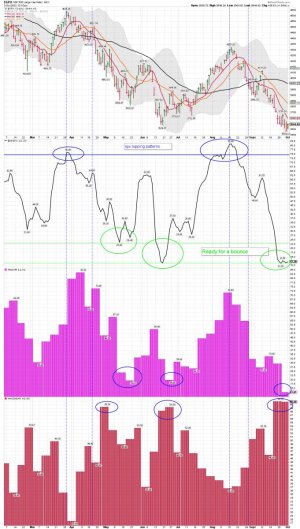
SPX daily and Bear Market Extremes. I stopped using sentiment for trading because of the extremes during the last Bull. Each extreme seemed to just get more extreme. I suspect this Bear Market will show us the same type of extremes, but in the other direction.

For the record: I no longer use sentiment for trading, but still track it. A few data points that I track that are getting very extreme on the daily charts.
 

Attachments

  • a.jpg
    a.jpg
    167.8 KB · Views: 63
SPX - do you nibble?
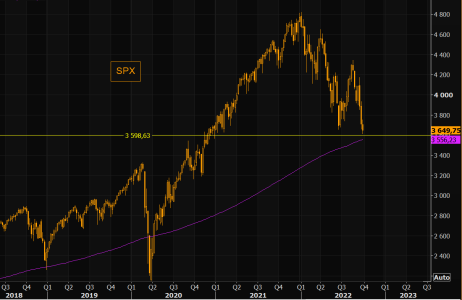
Hartnett says you should nibble around 3600. Note the SPX is basically at the 200 weekly moving average. We moved briefly below it during the Covid crash, but it held perfectly in late 2018. Maybe it is time to nibble...

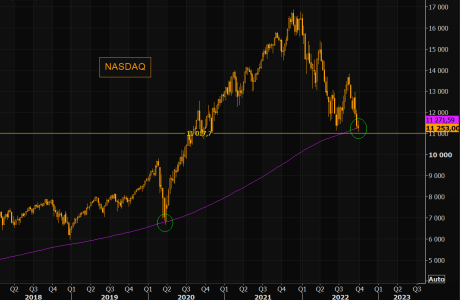
NASDAQ and the BIG 200 moving average
We are talking about the 200 weekly moving average. 11k ish is a huge level. Imagine the pain should this bounce from here?


A lot of things for the bounce bulls....but some things for the crash bears too...
The bounce case is more appealing to us right here right now. We have listed 10 observations on why it should (or at least could) bounce. However, we recognize that this is the consensus view among short term actors right now and it feels far from a high conviction call. At the end of this email we list 9 counter-observations to hold you off from becoming too "bounce-bullish".
https://themarketear.com/posts/cWSmmNFzkL
 

Attachments

  • a.png
    a.png
    27.3 KB · Views: 61
  • a.png
    a.png
    27.2 KB · Views: 62
I was 20 during the crash of 08, needless to say I didn't pay any attention to the markets then. I will say that this is a very scary time to be in right now. There is alot of people whom I work with that don't ever pay any attention to this. There is no way I could stand by and watch my nest egg diminish day by day after a lifetime of work.
 
I was 20 during the crash of 08, needless to say I didn't pay any attention to the markets then. I will say that this is a very scary time to be in right now. There is alot of people whom I work with that don't ever pay any attention to this. There is no way I could stand by and watch my nest egg diminish day by day after a lifetime of work.

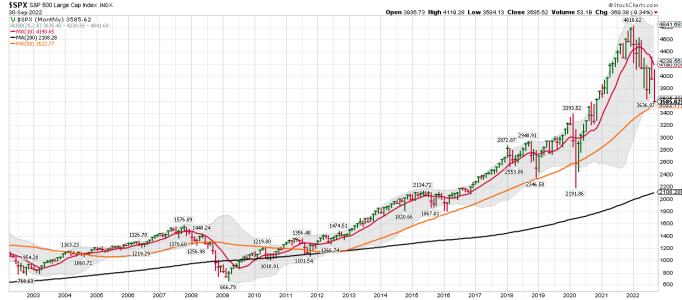
Well, buy and hold works great in a Bull market, but in a Bear Market one could lose a big chunk of your account balance. If you are within 5 years of retirement that can be very costly. One should at least use the rule of 100 if they are buy and hold long-term investors. We shall see if we get a bounce off the 50 month MA, but as you can see the SPX still remains very stretched above its 200 month MA. I will be looking to take a ST move in TSP soon. As you can see the 50 month MA was excellent support during the Bull Market ( orange line). However, during Bear Markets it normally comes back down and tags the 200 month MA (Black line). If that happens this Bear is far from over. One has to respect the historical data.

However, I'm a trader not an investor.
 

Attachments

  • a.png
    a.png
    35.3 KB · Views: 72
Last edited:
SPX daily: Not much to add for now. I'm ST trading my indicators and the current patterns.

LONG - SSO, and VXF
 

Attachments

  • a.jpg
    a.jpg
    153.3 KB · Views: 72
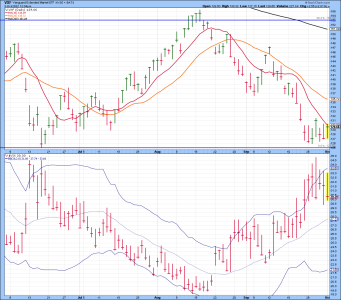
VXF daily ( S fund). Impossible to trade TSP in a market like this one ( Bear Market). The moves are more about luck, since the Bull can't save you it can get really ugly. You try and hold on and hope for a bounce to get back out or even. Sleepless nights etc...... Been there and done that. My final indicator was the VIX. I was waiting for the VIX to move back inside the upper BB for my final indicator. I don't now how this trade/move in TSP will play out, but for now I have a short-term (ST) buy signal. We shall see if the VIX moves back down to around 20ish again and the market trends up for several days. After that the normal trend which is currently down should resume. Don't look for a FED save anytime soon.

I added VXF Friday at Vanguard, but couldn't move TSP funds because no moves left. TSP is great during Bull Markets, but Bears will chop up your account if you are not careful. I traded the 2000, and 2008 Bears and took Big HITS...... LOL... Not this time..... This is still a high risk trade, but I just trade my indicators and IGNORE all the noise and comments on CNBC...etc....

Good trading to all those trying to make money in this market. 2 year notes making around 4% now.... and some CD's close to that. That is were most of our retirement money is right now.

For the record: I only use 100k for making TSP moves. A 25% move for me is 25k, and a 100% move is 100k. At Vanguard I can buy or sell whenever I want during the trading day.


LOL.... Risk taker is really not my account name at Vanguard, but if you are going long during a Bear Market you had better KNOW you are taking a BIG RISK! NO ONE KNOWS for sure how this will play out. However, if you look at the historical charts above I posted we have a long waaaaay to go before the SPX tags its 200 month MA again. That is a normal tag/move down during a Bear Market which could take a couple of years to complete.

Dear Risk Taker

The following order executed on 09/29/2022 at 9:53 AM, Eastern time:

Account: Risk Taker
Transaction type: Buy
Order type: Market
Security: VANGUARD EXTENDED MARKET ETF (VXF)
Quantity: 100 share(s)
Price:* $127.63
 

Attachments

  • a.png
    a.png
    49.3 KB · Views: 71
Last edited:
Back
Top