Bear Cave 2 (Bull Allowed)

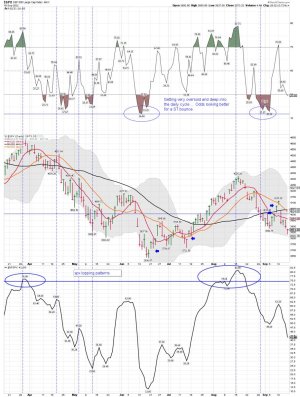
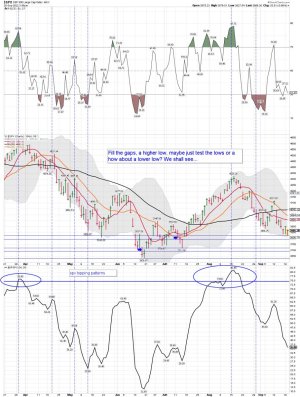
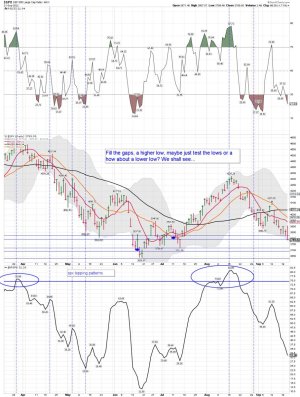
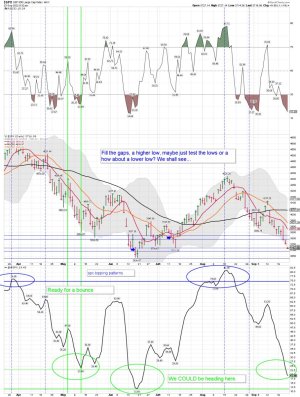
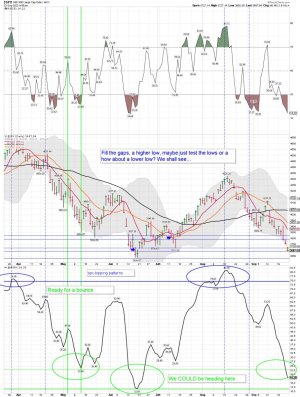
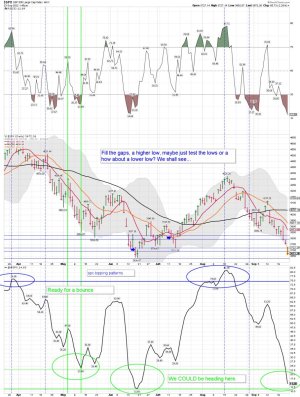
SPX daily: I still have some concerns too..... Day 4 since the SPX moved below it's 10 dma..... Well, we did get the bounce based on the pattern, but now what? We shall see how the lower BB tag plays out, and if the pattern is still in play as it indicates. The SPX could still move lower. I'm trading the MA's and cycle data, not the pattern. However, the patterns are warning signals just like sentiment data many like to use. The pattern does indicate the odds for another bounce is getting close, and the cycle data supports it. Let us not forget those lower gaps. Will they fill? They could, so one has to be careful here. LOL..... we shall see how it all plays out, and I will be trading SSO again once I like the setup. I will not be making many TSP moves as I wait for all this to play out. The Fed remains with it's foot on the gas pedal for additional rate increases and the market/investors are running for safety. If you are buying CD's or 2 year notes look for 4% rates soon.... That is what many investors are doing. If you are down big in TSP there could be some nice rips as Bear Markets are known for this, but it's impossible to trade using a TSP account with only two moves a month. TSP is great in a Bull Market, but in a Bear Market one needs to be very careful and spend time in the G Fund while you wait for the next Bull to show up. It takes rare extremes before Bear Markets end.
 

Attachments

  • a.jpg
    a.jpg
    176.6 KB · Views: 57
Last edited:
SevenSentinels
@SevenSentinels
·
Sep 16
September 8, 2022

We Have Opened Our Latest Weekly Article To Any Who Wish To Understand What The Recent NYMO Low < -101 Is Telling Serious Traders:

The REST of the Story- When NYMO Falls Below -100
September 3, 2022

Our story today may not be “The Godfather.” But it’s one that every serious trader might find at least as compelling.
The story begins with the 1929 stock market crash and the Primary Bear Market that followed:

That pattern over the last century is clear, and to quote Jesse Livermore again:
“What happens today has happened before and will happen again.”

https://sevensentinels.com/the-rest-of-the-story-when-nymo-falls-below-100/
 
Depending on who you ask the opinions will vary


"We should test the lows later this year"

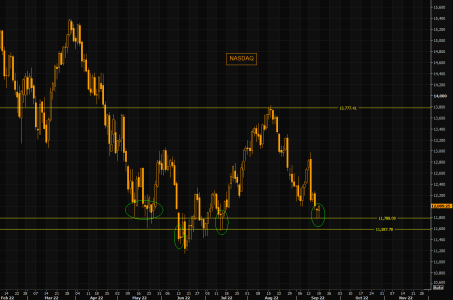
"There are many reasons to believe that we will revisit the lows later this autumn. Overall tactical & macro backdrop just do not add up to the ultimate bottom. We can bounce small this week - we list some observations on why this is at the end of this email - but overall medium term view is still bearish.""

"This is not a bottom"

BofA private client equity holdings at 63% of AUM. Should be much lower for a...

https://www.zerohedge.com/premium?u...campaign=premium&utm_content=tme_website_link
 

Attachments

  • a.jpg
    a.jpg
    181.9 KB · Views: 63
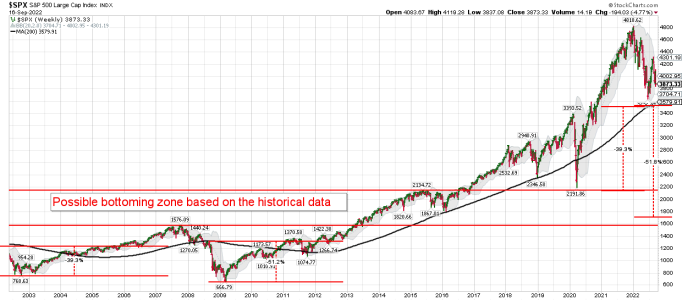
SPX weekly: During the last two Bear Markets how far did the SPX move below its 200 week MA before bottoming? This chart gives you an idea. We shall see how this Bear Market plays out!

Bottom Line: The weekly trend remains down....
 

Attachments

  • a.png
    a.png
    35.2 KB · Views: 76
Bear market rallies are some really good ones if you can time it correctly!

Hammer time!

If it doesn't want to go down..
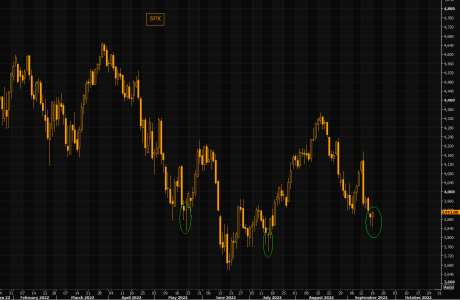
Quick update of those powerful hammer candles in the making.
 

Attachments

  • a.png
    a.png
    35 KB · Views: 75
  • a.png
    a.png
    34.7 KB · Views: 76
SPX daily: The talking heads on TV are telling folks the market keeps selling off because the Fed will keep increasing rates.... I say great- Because I have some CD's coming due very soon.

Bottom Line: The SPX remains on a sell signal as investors continue to sell the rips! It looks like 4% rates or higher are probably in the bag! Another nice bounce off of the lows...... Someone is BTD today.... It's not me.....

Waiting another extreme to buy SSO as we get deeper into this daily cycle.
 

Attachments

  • a.jpg
    a.jpg
    180.6 KB · Views: 72
Hmmmm..... Not sure about this recovery just yet, but buyers did come in.

Undercut -> Recovery

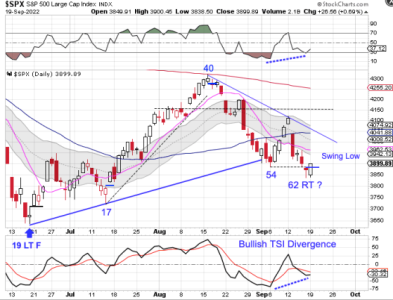
Stocks formed a swing low on Monday.

Stocks undercut the day 54 low on Friday. Monday's swing low recovered the breakdown level to indicate that day 62 was the DCL. A close back above the 10 day MA will provide more assurance that day 62 was the DCL. But we will really need to see a close above the declining trend line in order to label day 62 as the DCL.

https://likesmoneycycletrading.wordpress.com/2022/09/19/undercut-recovery/
 

Attachments

  • a.png
    a.png
    115.6 KB · Views: 69
SPX daily: Cycles..

Undercut –> Still In Play

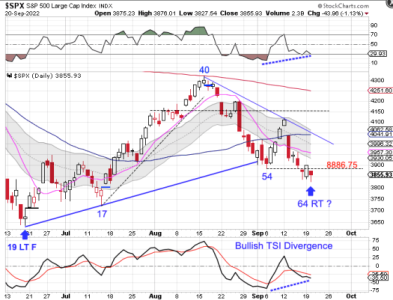
Stocks printed a lower low on Tuesday.

Tuesday was day 64 for the daily cycle, placing stocks very deep in their timing band for a DCL. There are bullish divergences developing the oscillators that often proceed the cycle low. A swing low and recovery of the 8886.75 breakdown level will indicate the DCL. A close back above the 10 day MA will provide more assurance that day 64 was the DCL However stocks will not be out of the woods until they can close above the declining trend line.
https://likesmoneycycletrading.wordpress.com/2022/09/20/undercut-still-in-play/
 

Attachments

  • a.png
    a.png
    111.7 KB · Views: 70
SPX daily: The pattern is getting closer to completing, and the first gap has filled..... We shall see how the rest of the week plays out. As deep as we are into this daily cycle one would think we should get a nice bounce soon....
 

Attachments

  • a.jpg
    a.jpg
    182.1 KB · Views: 67
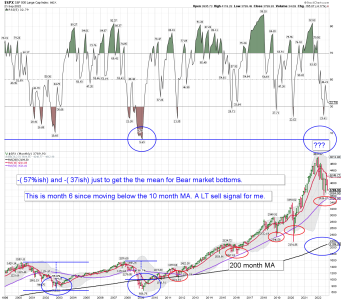
SPX monthly: So far a very ugly monthly candle! How about a bounce off the 50 month MA...... A bounce off the 50 month MA happens during in a Bull Market, but how about a Bear Market? We shall see.....
 

Attachments

  • a.png
    a.png
    99 KB · Views: 81
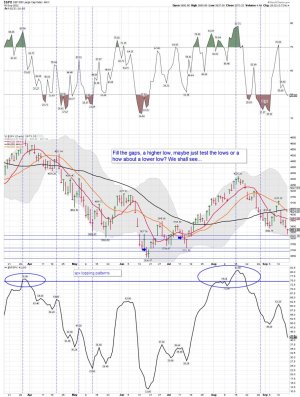
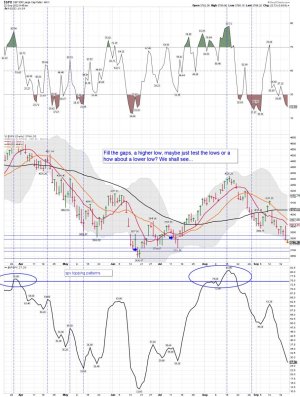
SPX daily: It looks like the lower gap fill is in play..... What happens if it does fill? Then what? A higher low, maybe a lower low, or just a back-test. We could be moving into a possible bloodbath phase before the next bounce. That would take us into next week and a possible lower low. Those are all guesses..... we will just have to wait and see!

Bottom Line: Bear Market rules apply, and the trend remains down.
 

Attachments

  • a.jpg
    a.jpg
    180.1 KB · Views: 77
Last edited:
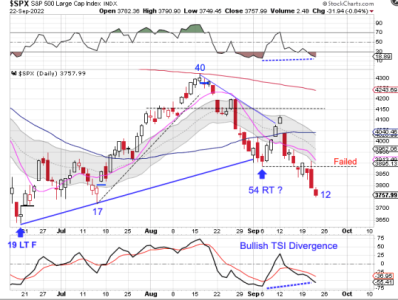
SPX daily: We shall see how it plays out. If the cycle data proves correct we COULD see a lower low.... I will just be watching as I remain on a sell signal for the SPX.

Bloodbath Phase

When stocks undercut the day 54 low last Friday, the bullish divergence on the oscillators indicated a continuation of the daily cycle decline. Recovery of the breakdown level would have indicated an extended daily cycle low.

When stocks formed a swing low on Monday it looked, in real time, that the undercut-extended daily cycle low scenario was valid. Then stocks were rejected by the breakdown level on Wednesday then delivered bearish follow through on Thursday. Which makes me think we need to label day 54 as the DCL which would make Thursday day 12 of a failed daily cycle. And loosing the breakdown level signals that stocks have entered a bloodbath phase - which can last 5 to 10 days.
 

Attachments

  • a.png
    a.png
    100.7 KB · Views: 67
SPX daily: Filling the lower gap......


Market Bearishness Is Reaching a Tipping Point
By Jeff Clark, editor, Market Minute
This has been a tough month for the stock market.

As of Wednesday’s closing price, the S&P 500 was down more than 4% for September. The Russell 2000 has been hit with a 4.5% decline. And the Nasdaq Composite Index has fallen 5%.

Unsurprisingly, lots of investors are nervous heading into the end of the month. And the aggressive folks are talking about making big bets on the short side.
But the market is setting up for a bounce…

https://www.jeffclarktrader.com/market-minute/
 

Attachments

  • a.jpg
    a.jpg
    186.7 KB · Views: 69
Last edited:
SPX daily update: Well, we filled the gap! Waiting to see if we really are entering the bloodbath phase or the SPX bounces soon. If we are in the bloodbath phase we should see more pain going into next week.

Back test of the lows or a lower low is up next..... Buying some SSO for a trade - ( a possible lower high and I will be using a stop) 09/23/2022 10:02:45 Bought SSO @ 42.165

Tough market to be counter-trend trading in, but I like the odds for a ST trade based on my data.

Bottom Line: The trend remains down and Bear Market Rules are in play!
 

Attachments

  • a.jpg
    a.jpg
    186.8 KB · Views: 70
Last edited:
SPX daily update with 2 hours left to trade: 2 hours to go and the Bloodbath phase is currently in play.... The SPX is currently back testing the June lows and the pattern is almost complete... I have NO IDEA if it will hold...... We shall see how it all plays out and if buyers come in before the close. I'm adding a few more shares of SSO...... Using a stop below the current June low marker.

Bottom Line: The trend remains down, Bear Market rules in play, and this is a counter-trend trade.
 

Attachments

  • a.jpg
    a.jpg
    186.9 KB · Views: 64
Last edited:
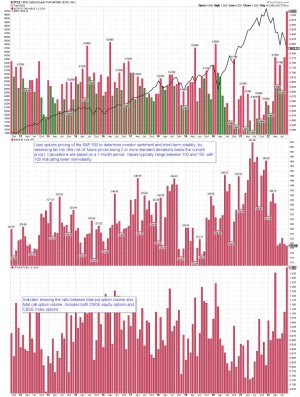
PUT/CALL ratio: Lots of indicators continue to increase the odds for a bounce.

Long SSO
 

Attachments

  • a.jpg
    a.jpg
    228.6 KB · Views: 64
Bottom Line: Don't buy and hold.

Are Investors Staring Down Another ‘Lost Decade’ In The Stock Market?

jessefelder
September 21, 2022

As a result, investors are likely going to have to do more than just passively buy and hold a broad stock market index if they want to avoid a prolonged period of negative real returns.
https://thefelderreport.com/2022/09...down-another-lost-decade-in-the-stock-market/


It has been tough to hold on to your positions:

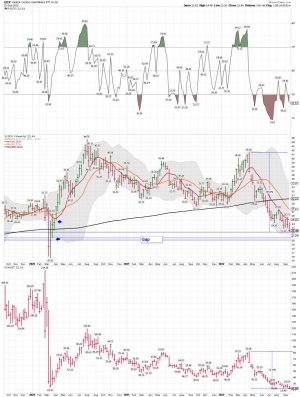
False Gold-Stock Panic

Sep 23, 2022
The left-for-dead gold miners' stocks are literally trading at stock-panic levels today! But they've been slammed to extreme lows in recent months on a false premise. Traders assume gold's parallel plunge must be fundamentally-righteous. But that was driven by enormous gold-futures selling on anomalous market events. As these unsustainable extremes inevitably reverse hard, the battered gold stocks will soar.

Without any doubt, the most-contrarian sector in the markets today is the despised gold stocks. They've been long-forgotten by mainstream traders, and they're pretty loathed even by contrarians who ought to like buying low. It's hard to imagine anything more deeply-out-of-favor than the gold miners, as there is virtually zero interest in them. That has left them languishing at exceedingly-oversold stock-panic levels.

Sep 23, False Gold-Stock Panic Adam Hamilton 321gold ...inc ...s

GDX weekly Chart: The trend remains down.
 

Attachments

  • a.jpg
    a.jpg
    163.3 KB · Views: 59
Last edited:
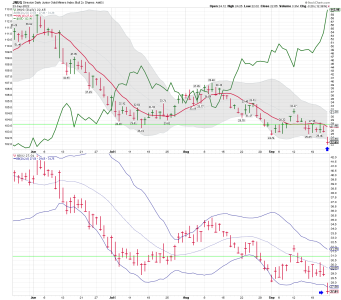
GDXJ/JNUG daily: A move below the lower BB, this late in the daily cycle, is usually good for a bounce.

Long GDXJ for a trade..... We shall see how it plays out, after the huge move up by the dollar!
 

Attachments

  • a.png
    a.png
    65.9 KB · Views: 60
Last edited:
The 9/24/22 Weekend Report Preview

likesmoneystudies

Sep 24

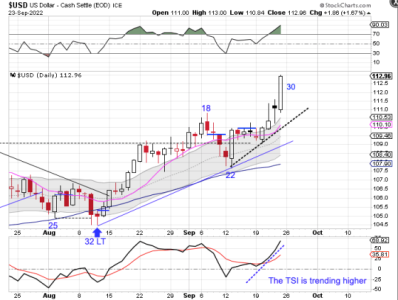
The Dollar

The Fed decision to raise rates caused the dollar to break out to a 20 year high.

Friday was day 30 for the dollar’s daily cycle. The new high on day 30 locks in a right translated daily cycle formation. 30 days also places the dollar in its timing band for a daily cycle decline. The dollar will need to form a swing high and break below the accelerated (dashed) trend line to signal the daily cycle decline. The dollar is currently in a strong daily uptrend. The dollar will remain in its daily uptrend unless it closes below the lower daily cycle band.

https://likesmoneycycletrading.wordpress.com/2022/09/24/the-9-24-22-weekend-report-preview/
 

Attachments

  • a.png
    a.png
    78.8 KB · Views: 62
Back
Top