Bear Cave 2 (Bull Allowed)

We shall see how it plays out!

Daily Cycle Update

likesmoneystudies

Sep 8
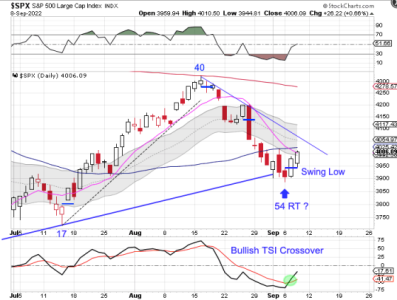
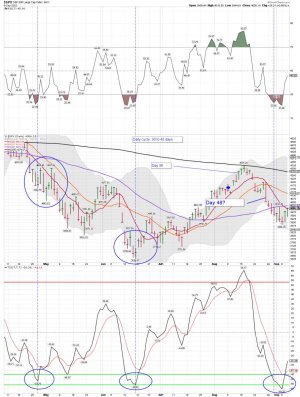
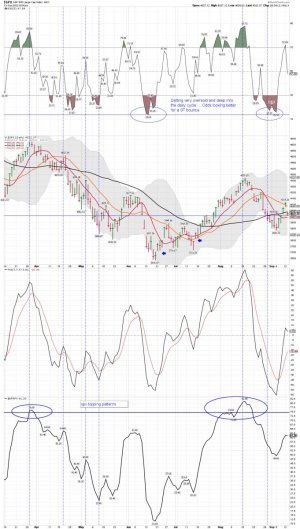
Stocks printed their lowest point on Tuesday, day 54. That places them deep in their timing band for a DCL.

Stocks formed a swing low on Wednesday then closed above the 10 day MA on Thursday to signal the new daily cycle. I would like to see a close above the 50 day MA before we day 54 as the daily cycle low. Stocks should then go on to break above the declining trend line as they rally out of the DCL. Stocks are currently in daily downtrend. They will remain in their daily downtrend unless they close back above the upper daily cycle band.
https://likesmoneycycletrading.wordpress.com/2022/09/08/daily-cycle-update/
 

Attachments

  • a.png
    a.png
    78.6 KB · Views: 53
SPX daily: Looks like the bounce is in play..... Now will it have some legs?
 

Attachments

  • a.jpg
    a.jpg
    171.3 KB · Views: 54
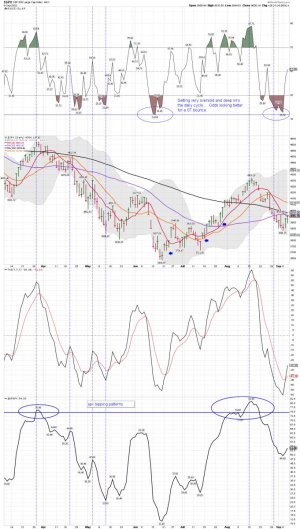
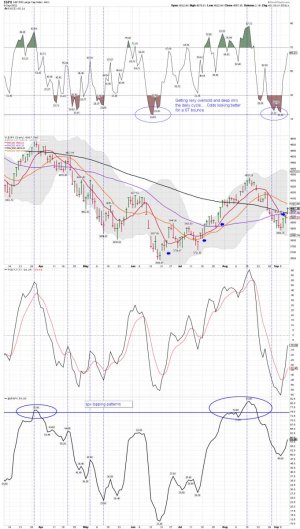
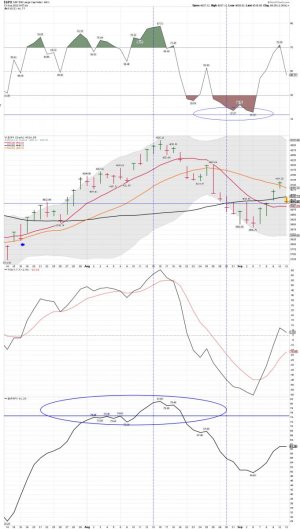
BPSPX daily: Hmmmmm...... Waiting to see how this plays out. I still have a 10% position in play (S Fund) , but out of moves. LOL..... That might be a good thing. I'm trading this like we are in a Bear Market NOT a BULL Market so I'm using the ST daily data for trading and NOT the weekly for the SPX. I would be using the weekly too for MT positions IF I thought we were in a BULL Market. We still have two gaps left behind.... It's looking like the might not fill just yet.....
 

Attachments

  • a.jpg
    a.jpg
    139.5 KB · Views: 55
Last edited:
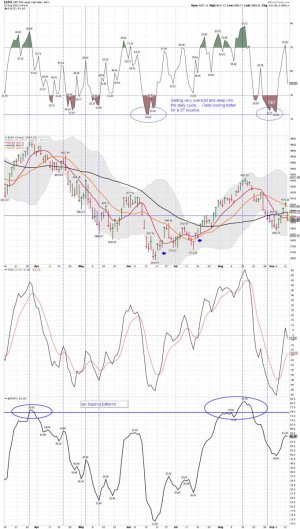
SPX daily: So we got the daily buy signal. Now what? If you are ST trading no problem as you can use stops, but investors are still wondering how this will play out. The insiders continue to sell as the Fed keeps its foot on the rate hike gas pedal..... I say we shall see....

I'm flat stocks right now except for 5% in the S Fund.

We did get the bounce: We shall see if it has legs....

Pouncing on bouncing (part II)

We are definitely still in bounce mode. Once again, the crowd got too bearish at the bottom. The big question now is if this bounce will morph into a proper squeeze like the one we saw this summer. Our feeling right now is that it won't and that we would want to dance very close to the exit door for now, but are, as always, open to re-evaluate in real time. Earlier this week we focused on CTAs, the massive put buying, gamma and the technical backdrop. Let's examine the "new" latest data-points on the bounce.
 

Attachments

  • a.jpg
    a.jpg
    137.2 KB · Views: 42
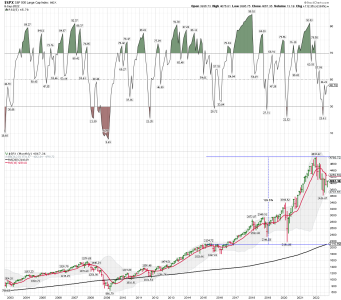
SPX monthly: The SPX monthly remains very stretched above the 200 month mean, and at some point we will get a 4 year cycle low. Month 6 since the the SPX moved below its 10 month MA . Plenty of things for investors to be concerned about. I remain in the Bear Market Trading camp. That doesn't mean I don't go long. I just take less risk since I'm counter-trend trading.
 

Attachments

  • a.png
    a.png
    81.4 KB · Views: 43
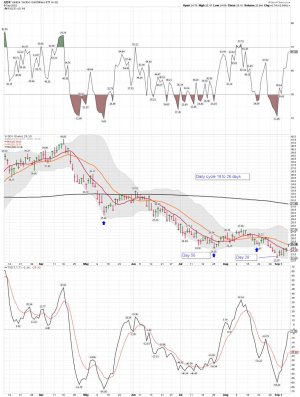
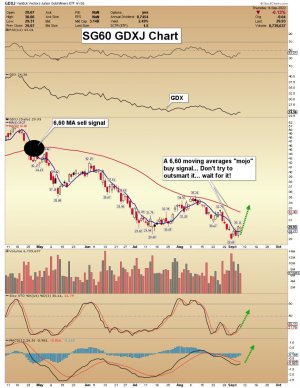
GDX daily: Well, the DCL and the daily buy signal are in play..... We shall see how it plays out and if the weekly can show us the money too!
 

Attachments

  • a.jpg
    a.jpg
    152.6 KB · Views: 43
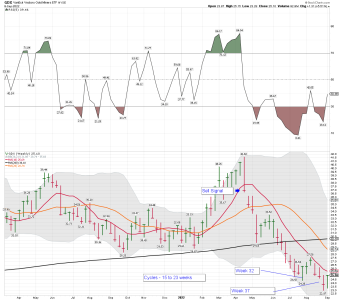
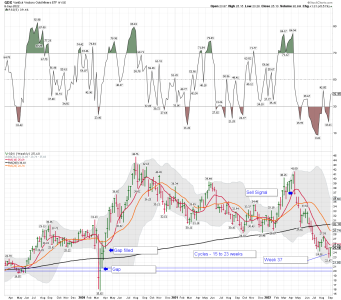
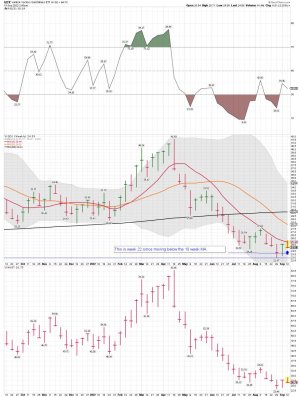
GDX weekly: Next week will be week 22 since moving below the 10 week MA.
 

Attachments

  • a.png
    a.png
    62.3 KB · Views: 45
GDX daily: Morris use the 3 and 60 dma for his MOJO buy signal (6-60 buy or sell signal). I will stick with the 10 and 50 dma's. However, I do use the 3 ema for ST trading, but that's another story.

If you are looking for an index you can hold for months.....then in my opinion you should start buying some shares of the gold miners.....

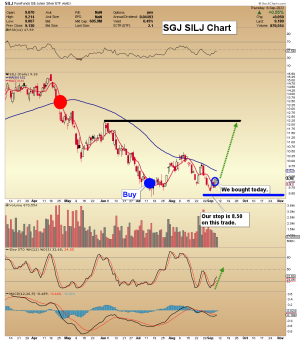
I like to buy SILJ and GDXJ, but in my opinion one should keep it under 10% of your total account value. It is very tough to invest/trade in this sector.

Sep 9, 2022 Gold & Key Commodity Stocks: Rally Time Morris Hubbartt 321gold ...inc ...s


Have a nice weekend!
 

Attachments

  • a.jpg
    a.jpg
    142.4 KB · Views: 51
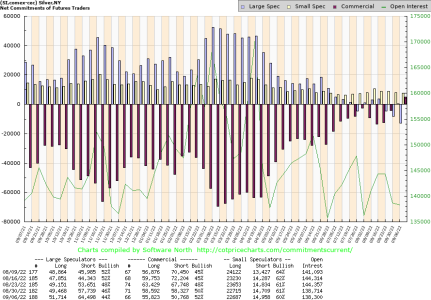
Silver COT: You will NOT see this very often. Getting very extreme and Silver/Silver miners should be a nice winner in the months ahead.

( SIL or SILJ are good indexes to trade/invest for the miners) Stay away from leverage in this sector!

I will post some weekly charts later. I use the weekly GDX chart for all my medium-term trading in the gold miner sector.
 

Attachments

  • a.png
    a.png
    31.5 KB · Views: 54
Last edited:
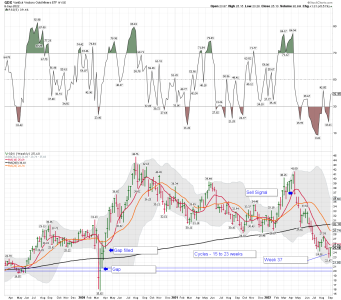
GDX weekly: Still waiting on a buy signal and a confirmed ICL. Next week will be week 22 since GDX moved below its 10 week MA and produced a sell signal. I have been whipsawed using the daily data, but I use stops and I'm only ST trading. Until the GDX weekly data moves back above the 10 week MA all my ST miner trades are counter-trend trading. We are deep into this cycle, but during a Bear market for stocks, with the Fed increase rates, I don't know how many weeks it will take before a bottoming, and a confirmed ICL. I will post the the last two Bear Market patterns for Gold/SPX later. If this is like the 2000 pattern then gold is close to bottoming. However, during the 2008 Bear market bottom GOLD/SPX bottomed a tad closer. I will be looking to take around a 15% position at first using SILJ/GDXJ once the MT data is confirmed. That run should give me better then average odds of doubling my money in the months ahead. I always take some profits and reduce to a around a 10% position in this sector. I don't care about LT capital gains. One should be careful having over a 10% position in this sector. I will just wait for the next sell signal. There are times I have been whipsawed out of my MT position, but I just go back to ST trading as I wait for the next MT buy signal. A move back above the 10 week MA using GDX not SILJ or GDXJ.
 

Attachments

  • a.png
    a.png
    87.8 KB · Views: 51
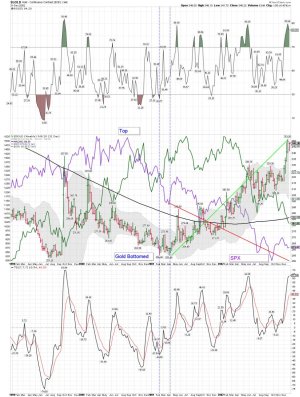
The 2000 Bear market: (SPX/GOLD/USD data) Note when the SPX bottomed (purple line) and when Gold bottomed (HLC red and green bars) Gold bottomed way before stocks. It has been my opinion that we are in a Bear Market like 2000 because of the extreme valuations we saw, but that is just a guess. I will post the 2008 Bear Market chart (SPX to Gold) data next . None of really matters to me, because I will still trade using the same method. However, investors want to hold for LT capital gains and sometimes buy large positions to early. I will wait for the weekly buy signals even if I get whipsawed since I'm also counter-trend trading using the daily data.

Bottom Line: Note how much lower the SPX went after gold bottomed. I have NO IDEA if this pattern will repeat or will it be more like the 2008 Bear market pattern. Again, it doesn't matter to me as I will still trade using my trading system.
 

Attachments

  • a.jpg
    a.jpg
    192.7 KB · Views: 46
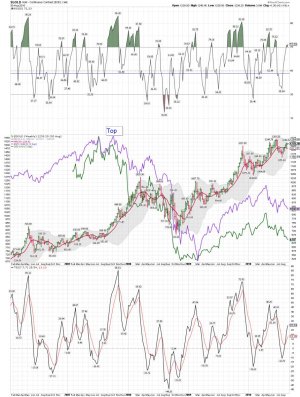
2008 Bear Market pattern: I point these patterns out because I often read that gold and the SPX will bottom together like they did in 2008. Sure, that is possible. But I use cycles/MA's and other indicators for my buy and sell signals. So it just doesn't matter to me as I wait for the next signal. Once I get the next weekly MT buy signal, we shall see if I get whipsawed out of my MT position. LOL..... Guess what? If I do I just buy the shares back.....
 

Attachments

  • a.jpg
    a.jpg
    187.2 KB · Views: 45
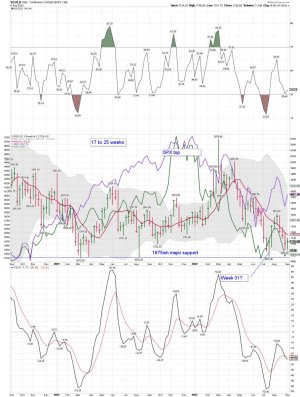
The 2022 Bear Market weekly data SO FAR: It sure is looking like the 2008 pattern so far. But it's my opinion we are early into this bear market, and the SPX has a ways to go before it bottoms. So we shall see in the next few years how it all plays out.

Bottom Line: I'm waiting for my next weekly buy signal. You can see how the moves are currently playing out for gold/usd/spx on the chart below. Ignore the noise, keep it simple and trade your system. If you don't don't have a system just use the 10 week MA for GDX. Most importantly, DO NOT over invest or use leverage in this sector. For most that S/B under a 10% position of your total account. I have one account I use for only trading the miners. But even when I'm all in it's still less the 20% of my entire trading accounts. I sometimes take a tad more risk coming out of ICL's. I have taken some huge losses trading the miners over the years getting greedy and swinging for the fence using leverage. So I speak from lessons learned. You will not catch bottoms or tops using MA's, but you can catch most of the big trending moves up, and be on the sidelines for most the big moves down. With that said, if you have a paid service that is making you money just stay with them, and use good risk management. Don't bet the farm on a single trade and don't use leverage. Betting the farm during Bull markets works out ok most of the time because the trend remains up. But in a Bear Market placing a big bet to early can be an account buster, and could take many years to get back to even. Not a good thing if you are getting close to retirement.

USD green line
SPX purple line
Gold HLC bars red and green
 

Attachments

  • a.jpg
    a.jpg
    158.5 KB · Views: 53
Last edited:
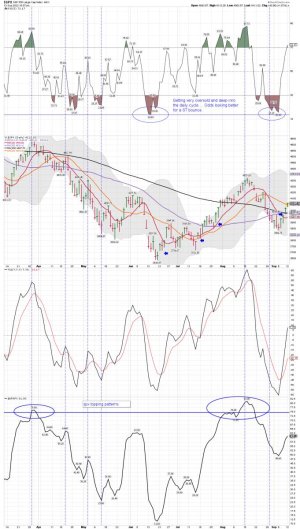
SPX daily: A nice move back above the 10 and 20 dma's. We shall see if it has legs.... The pattern indicates a bounce and then we move lower. However, these patterns don't always repeat. Still, I'm trading like we are in a Bear Market.
 

Attachments

  • a.jpg
    a.jpg
    138.5 KB · Views: 49
SPX daily: Filled the recent gaps, and the SPX is now back below the 20 and 50 dma's. We shall see if buyers come in and if the 10 dma holds. For now the pattern remains in play with two lower gaps left. I have NO IDEA how this will play out.....we will just have to wait and see. I will continue to trade this like we are in a Bear Market. As they say, don't fight the Fed, and it looks like the Fed is going to continue to increase rates.
 

Attachments

  • a.jpg
    a.jpg
    137.5 KB · Views: 39
Last edited:
SPX daily: Well, the SPX lost it's 10 dma so we shall see if buyers come in before the close. Lots of talk about where support levels are for the SPX. I had some SDS going into today, but took profits quickly. A lucky trade as I sure didn't know the market would sell-off this much today. Buying the dip and picking up some miners again after going flat. However, it's a counter-trend trade because the GDX weekly chart still remains in a down trend below its 10 week MA.

Beer Money for my trading account, and I was already in flat (G fund) in the TSP account. It sucks that only being off a day or two for your move can be a huge loss. I will have to see a rare extreme again before making another ST move.


09/12/2022 10:50:57 Bought 150 SDS @ 41.835

09/13/2022 09:05:07 Sold 150 SDS @ 43.75 I'm not sure why that ICON is there... YES folks..... I sold way to early.....
 

Attachments

  • a.jpg
    a.jpg
    137.8 KB · Views: 34
Last edited:
GDX weekly: Week 22 since GDX moved below its 10 week MA. So, I remain on a MT sell signal, and will only short-term counter-trend trade the rips and dips on the daily chart! Waiting for a confirmed ICL and a weekly buy signal before taking a full position in the miners.

This is a crazy market to be trading in! In my opinion one should stay nimble when placing trades..... For me that means keep it small and Risk Management is huge right now..... Lots of places to get over 3% returns right now while we wait for this Bear to run it's course.

Bear Market rules: Cash is King so you will be ready to buy a major bottom or make some ST trades during ST extremes.

A rough day for investors no matter how you slice it.

Long some miners again for a ST trade.
 

Attachments

  • a.jpg
    a.jpg
    152.7 KB · Views: 35
Last edited:
Back
Top