Bear Cave 2 (Bull Allowed)

David Rosenberg
@EconguyRosie
·
9h
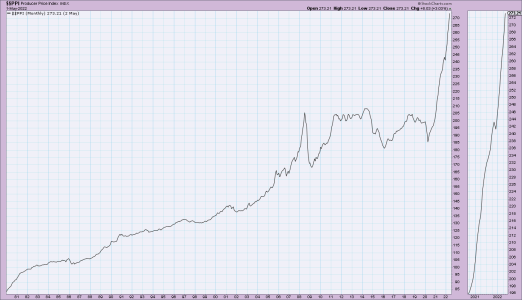
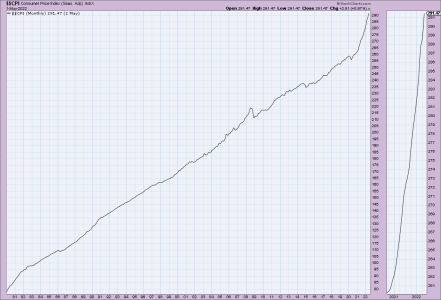
I keep getting asked when I will finally turn bullish. Answer -- the day I flip my charts upside down.

#RosenbergResearch
David Rosenberg
@EconguyRosie
·
Jun 13
We've had 8% inflation before. Been a while, but we've had it. What we've never had before was the Fed hiking rates into an official bear market. Brand spanking new. More downside coming.

#RosenbergResearch
David Rosenberg
@EconguyRosie
·
Jun 13
Down 4% on a day with no new news. Incredible. What will tomorrow bring? I sense margin calls.

#RosenbergResearch #Markets
David Rosenberg
@EconguyRosie
·
Jun 13
I don't know about anybody else, but this looks like a prelude to a crash. Get out of Dodge if you haven't already done so. It's not too late.

https://twitter.com/EconguyRosie?lang=en
 
Miners Form Failed Daily Cycle

likesmoneystudies

Jun 14

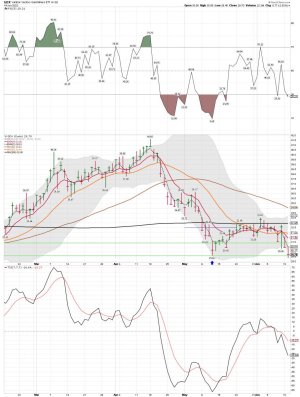
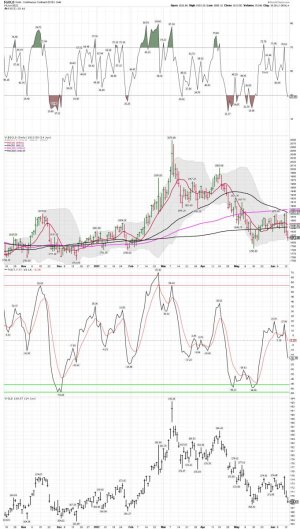
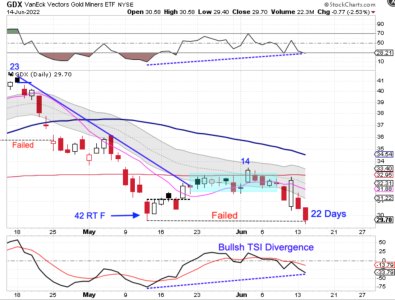
The Miners broke below the previous daily cycle low on Tuesday.

Breaking below the previous daily cycle low forms a failed daily cycle and extends the intermediate cycle decline. There are bullish divergences developing on the oscillators that often herald the cycle low. And with the Miners being in their timing band for an intermediate cycle low, the odds are good that once the DCL forms it will mark the ICL as well.

We shall see! I'm long the gold miners....


FOMC Day: The Low For Gold?

24. For many years, I’ve been adamant that the “big show” for gold stocks begins only after not just one aggressive series of Fed hikes, but numerous bouts of them, and only when it becomes obvious that the hikes are failing to tame inflation. A mini version of the “big show” lies directly ahead, and while the target is not the moon, a very nice rally… is coming soon!

Thanks!

Cheers
st
Jun 7, 2022 FOMC Day: The Low For Gold? Stewart Thomson 321gold ...inc ...s
 

Attachments

  • a.png
    a.png
    298.2 KB · Views: 58
  • a.jpg
    a.jpg
    136.9 KB · Views: 59
  • a.png
    a.png
    85.6 KB · Views: 59
Last edited:
Mark Hulbert
With the S&P 500 now in a bear market, despair and capitulation are the next stages of investors’ grief
Published: June 13, 2022 at 4:01 p.m. ET
By Mark Hulbert
comments
At the bear market’s final low, investors will no longer trust rallies. That’s the time to get bullish

The S&P 500 SPX, +1.46% officially entered a bear market on June 13, down more than 20% from its January 2022 high. While there’s no way of knowing how much further stocks will fall until their final bottom, odds are good that when that happens you won’t the feel much worse about the stock market’s prospects than you do already.

That’s the conclusion I reached upon analyzing sentiment in past bear markets. I found that the biggest drop in investor mood tends to occur earlier rather than later in bear markets. At the point when the market slips below the 20% loss threshold, investor sentiment is already close to being as pessimistic as it will be at the bear market’s final low..

This doesn’t mean the bear market is over. But crossing the 20% loss threshold does mean we have progressed further along the five stages of bear-market grief, about which I wrote a month ago.

A good illustration comes from three different sentiment surveys during the 2007-2009 bear market. When that bear market first broached the 20% loss threshold in July 2008, market sentiment was nearly as pessimistic as it was at the final bottom in March 2009, when the S&P was 57% lower than where it stood at its October 2007 bull market high. Here are the specifics:
https://www.marketwatch.com/story/w...he-next-stages-of-investors-grief-11655150513
 
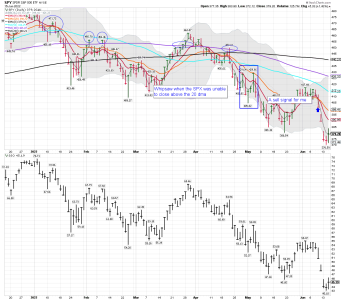
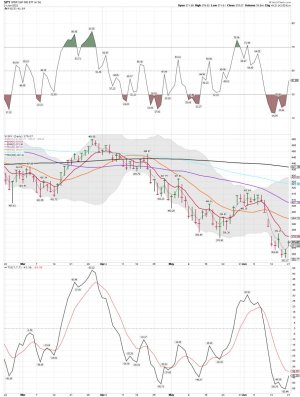
SPY daily: A gap down and the back test of the low marker ( @ 370.59 ) again this morning. It looks like an undercut and a lower low. We shall see how we close.
 

Attachments

  • a.png
    a.png
    65.8 KB · Views: 50
This Move Creates Extreme Conditions and Opportunities
Jeff Clark | Jun 16, 2022 | Market Minute | 2 min read
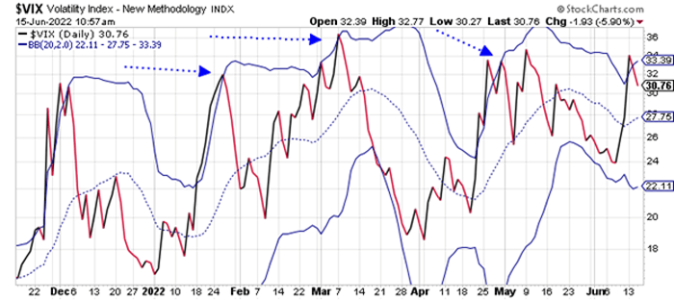
The Volatility Index (VIX) just generated a new stock market buy signal.

This is the fourth buy signal of 2022. And if this one plays out like the previous three, then stocks should be higher in the weeks ahead.

Take a look at this chart of the VIX along with its Bollinger Bands…
https://www.jeffclarktrader.com/mar...creates-extreme-conditions-and-opportunities/
 

Attachments

  • a.png
    a.png
    51 KB · Views: 50
THE buy signal?
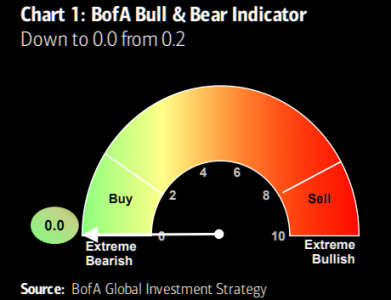
BofA's bull and bear indicator is currently at 0. This is probably the slowest of all indicators among investment banks. Track record when this hits zero is rather strong (unless double dip recession or systemic event). Last time we hit zero was in Aug’02, Jul’08, Sep’11, Sep’15, Jan’16, Mar’20 according to BofA.
 

Attachments

  • a.png
    a.png
    40.5 KB · Views: 39
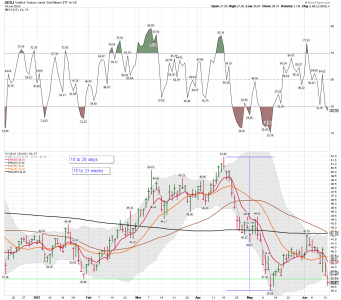
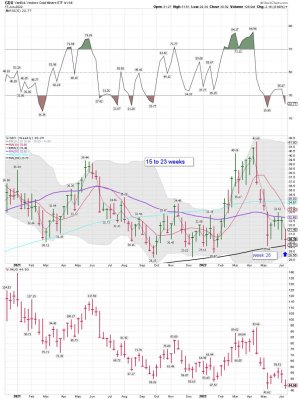
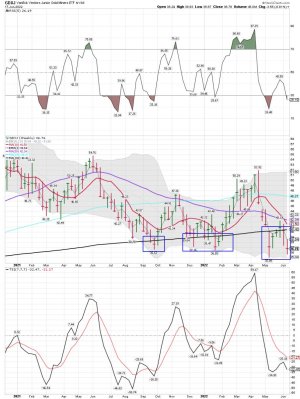
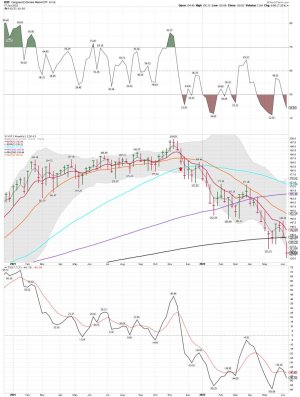
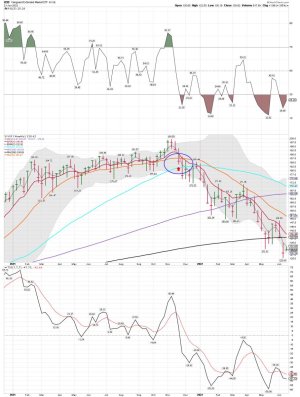
GDX weekly: A tag and a bounce off the 200 week MA. A possible ICL..... GDX needs to get back above the 10 and 50 week MA before a new trend is confirmed.
 

Attachments

  • a.jpg
    a.jpg
    152.6 KB · Views: 43
  • a.jpg
    a.jpg
    153.1 KB · Views: 43
VXF weekly: 31 weeks since moving below the 20 week MA on a weekly closing price. Closing below the 20 week MA is a confirmed sell signal for me. I was early and whipsawed during this move down too trying to trade the short-term bounces using TSP funds, but overall doing well in my trading accounts. Counter-trend trading in a down trend and in this case, a Bear Market is something TSP Funds is impossible to do unless you are just very lucky.

I'm still trading like we are very close to a low and an ICL. We shall see "IF" we get an ICL soon can VXF can move back above the 100 week MA.
 

Attachments

  • a.jpg
    a.jpg
    138.8 KB · Views: 56
Last edited:
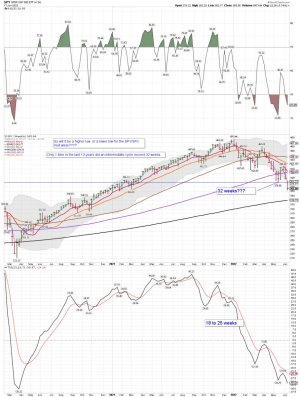
SPY weekly: Still NO TEST of the 200 week MA. We shall see how next week plays out!
 

Attachments

  • a.jpg
    a.jpg
    160.5 KB · Views: 57
The SPX weekly 2000ish historical Bear Market chart. A chart many are watching now. Some very nice weekly rips and dips to trade if we are about to see a similar pattern.


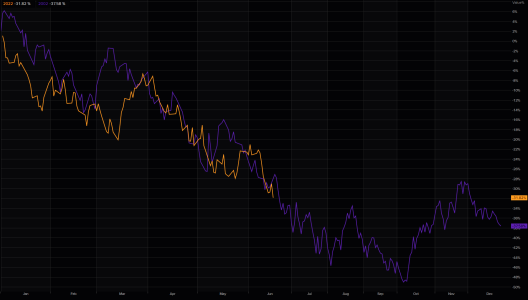
2002 trajectory remains the base case, or?

So far the 2002 NASDAQ analogy has worked very well. Selling violent squeezes is an art itself, but bounces can also be interesting plays. Let's see how things develop post FOMC and if we resume the "base case" trajectory with the "grinding" bear continuing to create huge frustration and p/l pain.
 

Attachments

  • a.png
    a.png
    107.7 KB · Views: 50
  • a.jpg
    a.jpg
    169.3 KB · Views: 52
Last edited:
My answer is it depends on your time you will be holding positions. I buy and sell often.....

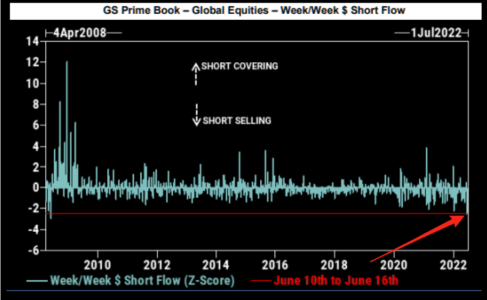
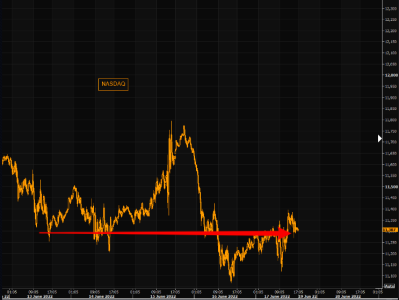
Shorting is huge
We have seen some extreme shorting take place lately. As we noted on Friday, the perceived bear is stronger than the actual bear. NASDAQ futs basically closed at the same levels we traded at on Monday lows, after having moved both higher as well as lower. Imagine the short pain should this decide to bounce from here...
 

Attachments

  • a.png
    a.png
    122.8 KB · Views: 54
  • a.png
    a.png
    52.9 KB · Views: 52
This would sure change my trading style.....

The SEC is trying to reshape the US stock market - but that could mean retail investors will have to start paying fees on trades again
Carla Mozée Jun 11, 2022, 7:22 AM

The Securities and Exchange Commission is aiming to shake up the mechanics of US stock trading in the wake of last year's meme-stock frenzy, and some experts in the markets say changes could lead to a shift back to retail investors paying commissions to make trades.
https://markets.businessinsider.com...-investors-gary-gensler-robinhood-fees-2022-6
 
SPX 2000 Bear Market


This is what the bulls are focusing on

Bear market rallies
Bear market rallies get bigger the longer the bear market continues. We are now entering our 4th squeeze of the 2022 vintage bear. Magnitude of 4th squeeze in 02 and 08 bear vintages: 21% and 19% respectively
https://themarketear.com/
 

Attachments

  • a.jpg
    a.jpg
    169.4 KB · Views: 42
  • a.jpg
    a.jpg
    165.8 KB · Views: 42
VXF weekly: This is week 30 since moving below the 20 week MA.....
 

Attachments

  • a.jpg
    a.jpg
    139.8 KB · Views: 34
"If Friday was the DCL, then a Tuesday entry provides the least risk of loss if stopped out."

Risk/Reward

likesmoneystudies

Jun 21

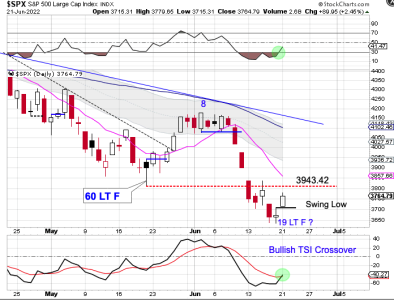
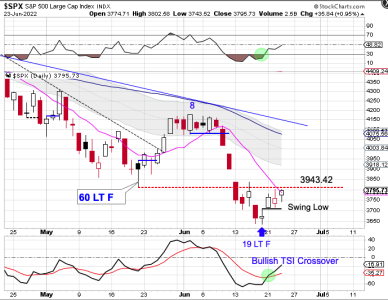
Stocks formed a swing low on Tuesday.

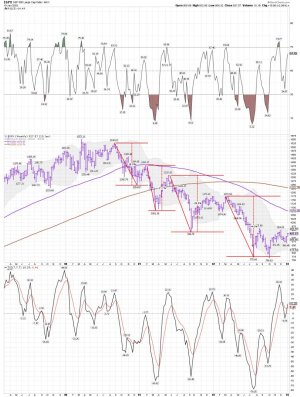
Stocks printed their lowest point on Friday, day 19, which is very early for a DCL. But with the previous daily cycle being stretched at 60 days, a shortened daily cycle would help to balance out the cycle counts. The weekly cycle is also stretched, which increases the odds for an early DCL. Still, we will need to see a close above the declining 10 day MA, along with some bullish follow through to be assured that day 19 hosted an early DCL.
"IF" Friday was the DCL, then a Tuesday entry provides the least risk of loss if stopped out. Waiting for more confirmation, such as recovering the 3943.42 break down level or a close above the 10 day MA provides more assurance that the DCL is set at the cost of a greater loss if stopped out at Friday’s low.
https://likesmoneycycletrading.wordpress.com/2022/06/21/risk-reward-2/
 

Attachments

  • a.png
    a.png
    48.4 KB · Views: 35
  • a.png
    a.png
    43.9 KB · Views: 36
  • a.jpg
    a.jpg
    136.4 KB · Views: 35
What Alarm Bells Go Off at the Market Bottom?

Hmmmm...... We shall see how it plays out!


What Alarm Bells Go Off at the Market Bottom?
David Rosenberg
@EconguyRosie
·
30m
Check out the latest edition of my YouTube series Navigating the Noise – What Alarm Bells Go Off at the Market Bottom?


https://twitter.com/EconguyRosie?lang=en
 
I wonder who the folks in Canada will blame for their inflation numbers - Headline #inflation in #Canada is also in "the highest for some 40 years" camp:
Mohamed A. El-Erian
@elerianm
·
5h
Headline #inflation in #Canada is also in "the highest for some 40 years" camp:
CPI inflation for May came in at 7.7%, above both the April 6.8% print and consensus expectation of 7.3%.
Core measures are at the highest levels on record.
#EconTwitter #economy

Mohamed A. El-Erian
@elerianm
·
7h
More people are experiencing the basic policy dilemma associated with central banks, and particularly the Fed,having fallen so far behind in reacting to inflation:
Wishing for a more aggressive front-loaded policy response AND worrying about the negative impact on economic growth
https://twitter.com/elerianm
 

Attachments

  • a.png
    a.png
    31.6 KB · Views: 34
  • a.png
    a.png
    25 KB · Views: 33
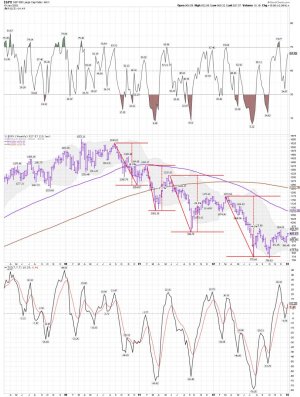
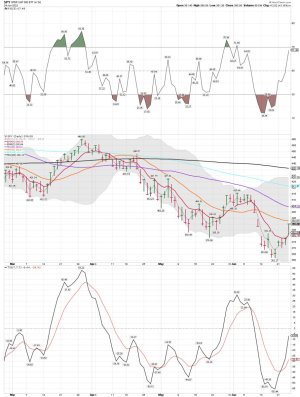
SPY daily: The index did move back above the 10 DMA..... I'm using the 9 ema on my chart. We shall see if it has some legs next week....

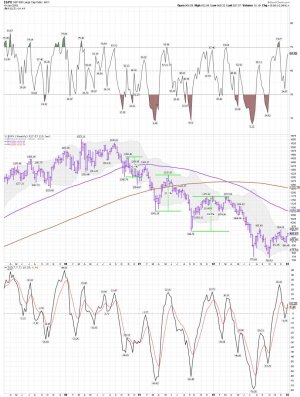
Stocks closed above the declining 10 day MA on Thursday

Stocks printed their lowest point on Friday, day 19, which is very early for a DCL. But with the previous daily cycle being stretched at 60 days, a shortened daily cycle would help to balance out the cycle counts. We will Thursday’s close above the 10 day MA to label day 19 as an early DCL. Stocks still need to break above the 3943 resistance level and turn the 10 day MA higher to be assured that day 19 did, indeed, host an early DCL.
 

Attachments

  • a.png
    a.png
    45.1 KB · Views: 29
  • a.jpg
    a.jpg
    135.7 KB · Views: 29
Back
Top