Bear Cave 2 (Bull Allowed)

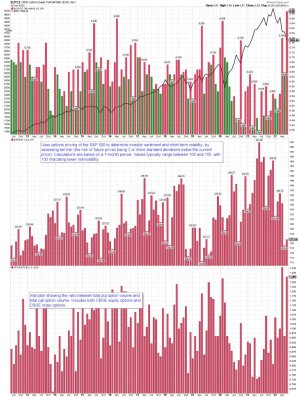
$CPCE monthly: We shall see how all of this plays out the rest of June. A gap down for the SPY futures at the open, as was expected.


SevenSentinels
@SevenSentinels
·
5h
Panic Comes at the BOTTOM Of Each Intermediate Term Cycle.

We are barely BEGINNING that stage with

Friday's One Day

CPC of 1.28 &
CPCE of 0.89

The Real PANIC Emerges This Week

See this week's article on Sludin?jumi - SS.COM

Sleeping Giant Awakens & His Name Is PANIC
Quote Tweet
Daniel
@exposurerisk
· 18h
6) One can understand a lack of fear in a sharp rally but a lack of fear in today's drop? The same thing happened in July 2008 before the plunge. And there you go, it doesn't matter the extremes reached but the response to a move especially when it is bizarre. Never boring.⚠️


SevenSentinels
@SevenSentinels
·
8h
...2/2


This week's article entitled "A Sleeping Giant Awakens, and His Name Is PANIC.."

Is ready and will be available when we come back online.

Serious Traders Take Note- This is the stuff of which trading careers are made when you "get it right."

Good Trading, All! D
SevenSentinels
@SevenSentinels
·
8h

https://twitter.com/SevenSentinels?ref_src=twsrc^google|twcamp^serp|twgr^authorSince we were down for maintenance Friday, we had our tech team take the opportunity to do a complete upgrade to speed up response times and beef up security.

They did so, and we are just waiting for Blue Host to reactivate website within 24 hours.

Meantime... 1/2
 

Attachments

  • a.jpg
    a.jpg
    234.2 KB · Views: 36
Last edited:
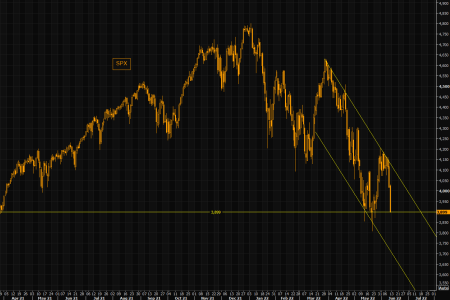
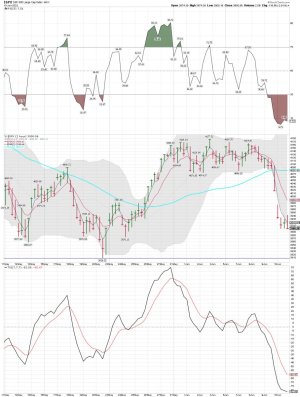
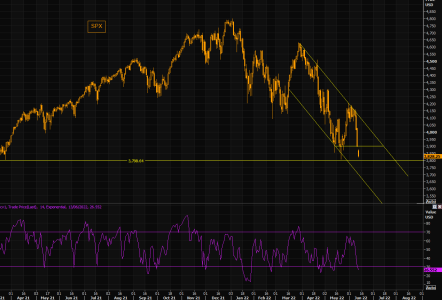
SPX daily: "A close below 3850 and things risk getting ugly." The futures are under 3850 - We shall see how it plays out next week!

SPX - catching falling knives
On May 30, in our thematic email, "You sell here if you think this is a "normal" bear market squeeze" (subs only, sign up here), we suggested that the back then violent bear market was to be faded and sold. We wrote: "Getting excited about SPX after it has rallied almost 11% from recent lows is probably a late trade...It is soon time to fade if you dared to buy it." Equities managed trading around the 4150 level for some 10 sessions until it all decided "collapsing" over the past two sessions. Since then we are down +250 points. Let's see how this plays out from here, but 3900/3850 is the make or break area, and we must admit this latest bear feels somewhat different. A close below 3850 and things risk getting ugly. Catching falling knives is a painful strategy.
https://themarketear.com/
 

Attachments

  • a.png
    a.png
    37.4 KB · Views: 33
  • a.jpg
    a.jpg
    131.9 KB · Views: 33
Last edited:
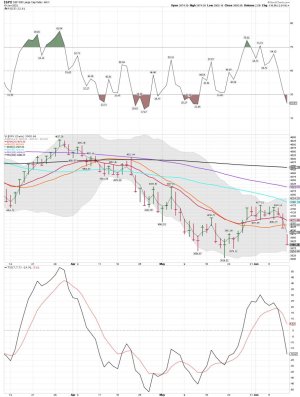
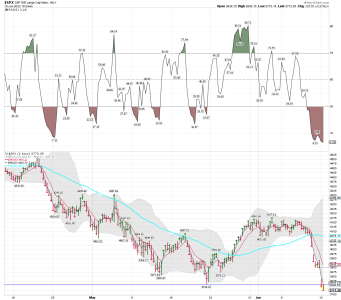
SPX 2 hour: The futures have already undercut the 3810.32 low marker. Waiting to see how we close today!
 

Attachments

  • a.jpg
    a.jpg
    142 KB · Views: 29
  • a.jpg
    a.jpg
    146.2 KB · Views: 30
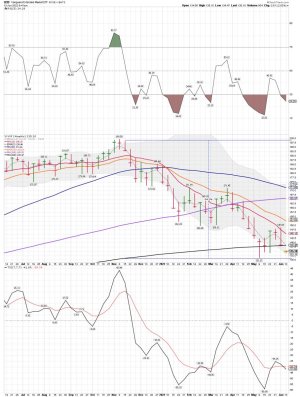
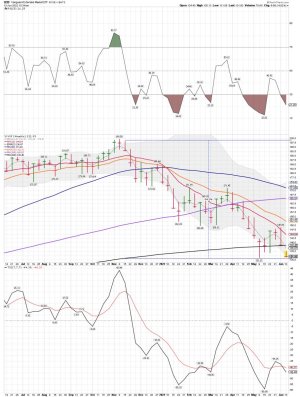
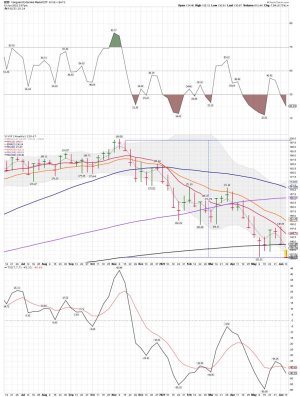
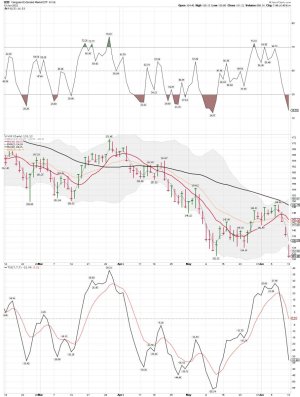
VXF weekly: ( S Fund) VXF has back tested and held ( weekly closing price) above the 200 week MA for 5 weeks so far. Will it make it 6 weeks? We shall see..... A gap down and an undercut to start the week out.
 

Attachments

  • a.jpg
    a.jpg
    157.8 KB · Views: 28
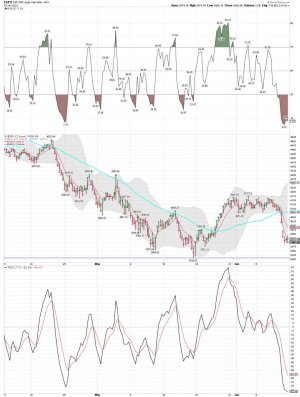
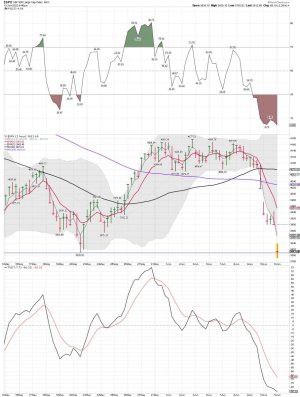
SPX 2 hour chart: Undercut of the low marker (3810.32) at the open: We shall see if buyers come in .....
 

Attachments

  • a.jpg
    a.jpg
    138.9 KB · Views: 33
Last edited:
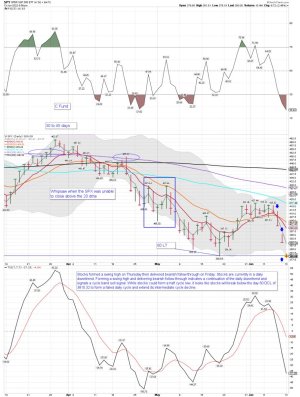
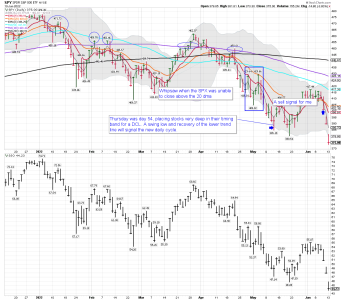
SPY daily: It looks like we will get plenty of action this week!

Back testing the lows.....
 

Attachments

  • a.jpg
    a.jpg
    154.2 KB · Views: 34
Last edited:
OUCH!


S fund already down -4.26% this morning.


that smarts!

( i hate that we are limited to 2 trades per month. I've already blown one, and if I pull the trigger and bail today, I'm locked into a three-day loss of almost 10%).
 
SPX 2 hour chart: I'm trading both ways today. We moved below the SPX 3800 mark.....We shall see where we close today!

SPX - the waterfall formation
SPX is closing in on the big 3800 level. We have not closed this low since March 2021. Note RSI is becoming very oversold here and let's not forget we touched 4144 as day highs on Thursday. The move lower has been brutal. SPX continues trading inside the trend channel, and there is more room to the downside, but 3800 is an important level to watch for possible short term supports.

https://themarketear.com/posts/cijZjCPGR2
 

Attachments

  • a.png
    a.png
    47.3 KB · Views: 33
  • a.png
    a.png
    77.6 KB · Views: 34
"S fund already down -4.26% this morning."

( i hate that we are limited to 2 trades per month. I've already blown one, and if I pull the trigger and bail today, I'm locked into a three-day loss of almost 10%).

That is why I went 100% long Friday because I'm trading the weekly chart. However, I'm also long SDS. It really does suck. I'm performing this test for my son using 100k. Lucky to only be down around 3% YTD, but that will change today. However, I'm trading the weekly chart and will let this run some more. Using the VXF weekly chart and long the S Fund. Back testing the weekly low marker this morning (131.31). I will be holding for now, but this remains very ugly if you are not hedge. Like I said I'm using SDS.

Bottom Line: Is sure does SUCK BROTHER!
 

Attachments

  • a.jpg
    a.jpg
    157.9 KB · Views: 36
Last edited:
VXF weekly: Remains a tad under the old low marker at (131.31)..... I'll be watching to see if the VXF weekly price can close out the week above the 200 week MA again. If it does that would make it 6 weeks in a row. This could be a "possible support zone" and maybe a ICL in the works. Someone is buying around that level with deep pockets. Still, for NOW MORE PAIN for investors..... We shall see how the rest of the week goes..... Still long SDS, but will close out that position before the close. Made some nice money on it the last two trading days. No need to get to greedy. My miner position sure took a big hit today.....adding at the close.
 

Attachments

  • a.jpg
    a.jpg
    157.6 KB · Views: 32
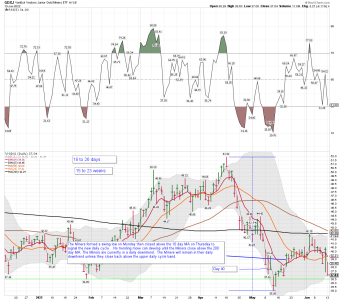
GDXJ daily: Trending down again in the ST, and was UNABLE to move back above the 200 dma. I will be adding shares.
 

Attachments

  • a.png
    a.png
    84.6 KB · Views: 42
Always love the charts Robo, maybe silly question considering where we are last couple days, but you think we could get some bounce off that downtrend channel at around 3700? Just curious. I feel like these down moves have been sticking to the bottom of the channels and bounces, just like the updside, hits it and then drops. If it stays true to form then perhaps we get a bounce soon. My guess is we get one this week. But there is so much negativity and blood in the streets that it might be harder to get those bounces. And to add even if we get that bounce it will probably not head back up to 4100 in a straight 2-3 day move. The channel continues to move down so as you go back up the top of your channel will be further down so maybe it tags it at 3880-3920? Probably enough to fill that gap and maybe that's your highwater mark idk. Just thinking out loud lol.

But always enjoy the charts! Keep em coming!
 
Sure do wish Birchtree was still around and posting. Always the PermaBull. Sit tight and be right. ;)

I use odds and have been trying to catch an ICL and have been wrong twice. Brother sitting tight in a Bear Market is not the way to play a Bear Market. However, in a Bull Market buying early is not a problem. I'm still playing this like it's a Bear Market, but still looking for a ST bounce.... LOL..... So far no such luck, and trying to pick bottoms is all about luck Brother. Especially in a Bear Market.

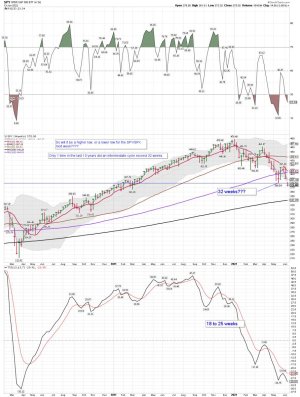
SPY weekly: Are we headed to tag the 200 week MA? Maybe......I took a hit too today on all my long positions. Starting out the week poorly. Lucky I had a above average position of SDS.
 

Attachments

  • a.jpg
    a.jpg
    159.8 KB · Views: 40
Always love the charts Robo, maybe silly question considering where we are last couple days, but you think we could get some bounce off that downtrend channel at around 3700? Just curious. I feel like these down moves have been sticking to the bottom of the channels and bounces, just like the updside, hits it and then drops. If it stays true to form then perhaps we get a bounce soon. My guess is we get one this week. But there is so much negativity and blood in the streets that it might be harder to get those bounces. And to add even if we get that bounce it will probably not head back up to 4100 in a straight 2-3 day move. The channel continues to move down so as you go back up the top of your channel will be further down so maybe it tags it at 3880-3920? Probably enough to fill that gap and maybe that's your highwater mark idk. Just thinking out loud lol.

But always enjoy the charts! Keep em coming!

Thanks for the kind words!

I'm playing it (positioned) for a bounce, but for NOW I'm LONG and WRONG Brother! However, I'm using the weekly data so I will let it run for now. Keep in mind I'm using other funds too. I'm trading from the LONG and SHORT side, and when I'm 100% long in TSP I move 100k not my entire account. I have posted that before.

We shall see how this plays out. Using VXF this trade and down over (5.4% ) today on this trade. I sure didn't think we would move this low today, but I was not going to sell today. In fact I went long a few things today and sold my SDS position.

A rough day for all those that ONLY use TSP for trading/investing.

Take Care and good trading Brother!
 

Attachments

  • a.jpg
    a.jpg
    133.6 KB · Views: 47
I'm back to only doing TSP for now. Took a break around November last year from trading anything else. Basically been in cash since then outside TSP, probably a good time that I decided to sit on my hands.

Anyway I'm just trying to catch some small gains here in TSP but agree that I didn't think we'd drop so far today. Main reason why I went in 50% on Friday instead of all in, I figured we would have another down day but man. I knew I should have waited until today to make my 1st move. So I did add the rest today but I'll set myself a mark on the downside and if I hit it then I'll head back to G. I made the move going in as a short term move anyway. Just hoping the rest of the week is green and I'll re-evaluate when I need to.

In my opinion your plan was sound based on the ST trading tools I use. I use the 10 dma and the 20 dma for trend trading and should be in cash right now as my system is on a sell signal. Once the SPY moved below the 10 and 20 dma I should have went to cash, but instead I took a TSP position. I went against my own trading system to try and get lucky. But sometimes, I just like to try and catch the lows based on the cycle data and a few other tools I use. I thought the odds were above average, but they were still only above average odds, not a for sure winner. A tad early so far. My trending trading system was correct this time. This move down today was huge, and caught me off guard too. My other tools for ST trading was NOT the way to go.
 

Attachments

  • a.png
    a.png
    69.5 KB · Views: 62
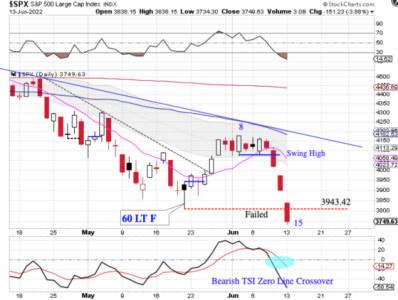
Stocks broke the previous daily cycle low on Monday.

Breaking below the previous DCL forms a failed daily cycle and extends the intermediate (weekly) cycle decline. At 15 days, stocks could trend lower for another 15 - 25 days before printing their DCL. Sentiment is very bearish and a technical level has been broken which would align with stocks declining for another 3 - 5 weeks.

The previous daily cycle ran long, so we could see a shortened daily cycle form here, which would balance out the cycle counts. Stocks are overdue for both a weekly and yearly cycle low. So if this undercut reverses quickly and closes above 3943.32, it could mark the daily, weekly and yearly cycle low.
https://likesmoneycycletrading.wordpress.com/2022/06/13/failed-daily-cycle-4/
 

Attachments

  • a.png
    a.png
    109 KB · Views: 60
Sometimes it just feels that way!

Stocks will never go up again in our lifetime

Yes, we are as bearish as you and do believe stocks will set new significant lows. However, some of the short-term sentiment indicators we are looking at are starting to indicate "too much too fast" and we wanted to examine why stocks could have a small bounce.
https://themarketear.com/
 
I now have my biggest trade of the year in play...... So far it remains a loser, but still up YTD.

Long- GDXJ, EQX, AGQ, TKC, TLT, and VXF.

Day trading - JNUG, long @ $43.50.....
 
Back
Top