Bear Cave 2 (Bull Allowed)

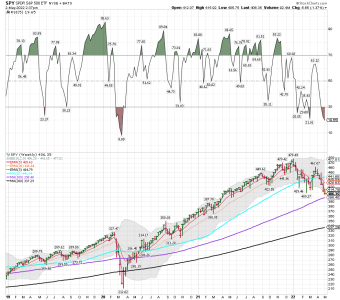
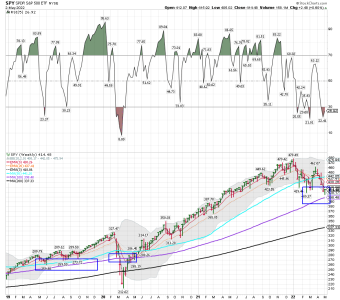
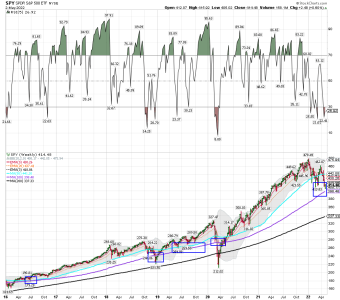
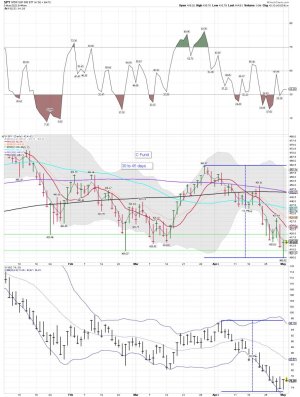
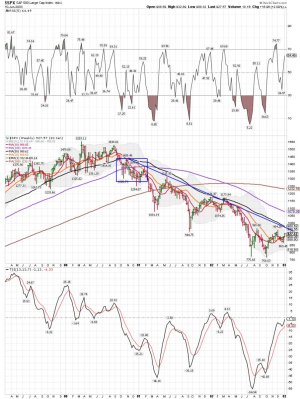
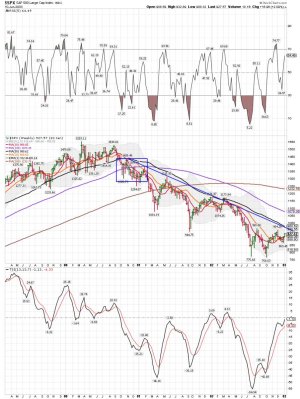
SPY weekly: A bounce off the 100 week moving average before the next move down gets started? We shall see!

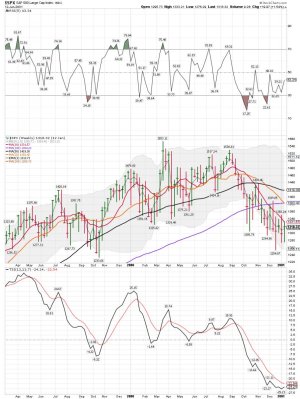
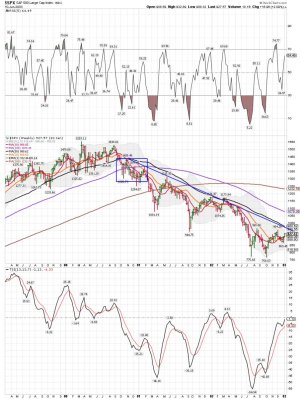
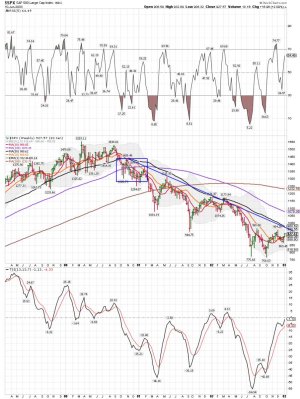
The 2000 weekly Bear Market pattern.... The second time the SPX moved below the 100 week moving average it trended down making lower highs for years. However, there was some nice swing trades to play if your timing was good. Both ways - I use SSO and SDS.
 

Attachments

  • a.png
    a.png
    64 KB · Views: 75
  • a.jpg
    a.jpg
    160.7 KB · Views: 78
  • a.jpg
    a.jpg
    173.6 KB · Views: 78
Last edited:
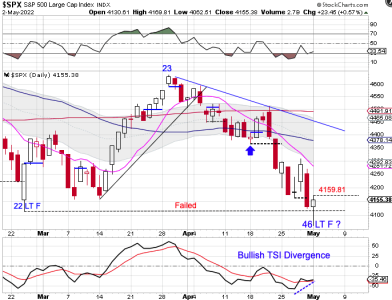
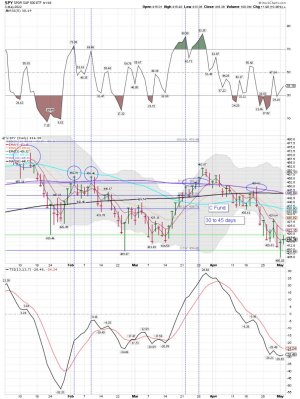
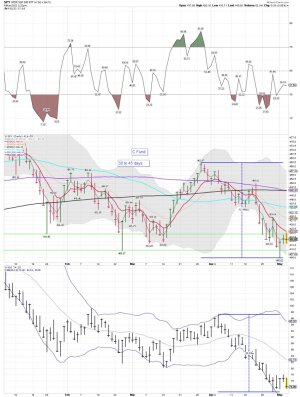
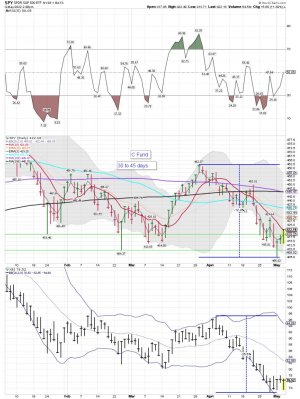
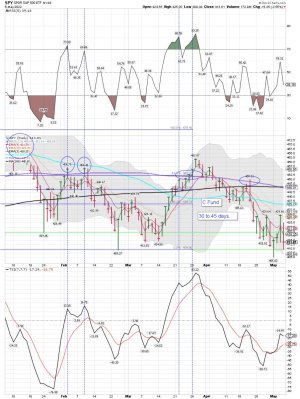
SPY daily: We shall see how this cycle data plays out....

Bullish Reversal

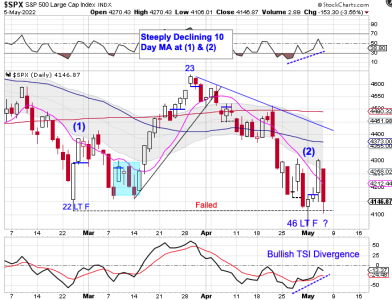
Stocks printed a bullish reversal on Monday.

Stocks began Monday lower, eventually breaking below the previous daily cycle low to form a failed daily cycle. Monday was day 46, placing stocks very deep in their timing band for a DCL. Recovering the breakdown level is a good sign that stocks printed their DCL. A break above 4159.81 will form a swing low and have us label day 46 as the DCL. Stops can then be set to Monday’s low. Stocks should then go on to recover the 10 day MA as they really out of the DCL.
https://likesmoneycycletrading.wordpress.com/2022/05/02/bullish-reversal-8/
 

Attachments

  • a.png
    a.png
    46.1 KB · Views: 70
SPY 2 hour: Nice close!

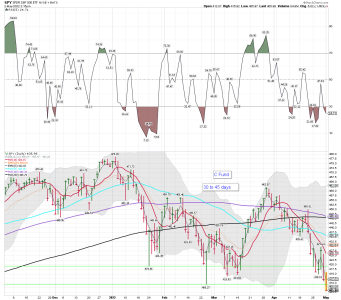
Spy weekly: Close enough to the 100 dma? We shall see how this plays out and I'm trading in a Bear Market? Are you?

The 2000 SPX Bear Market data chart and the importance of the 100 week moving average. ( Last Chart )
 

Attachments

  • a.png
    a.png
    81.6 KB · Views: 70
  • a.png
    a.png
    64.3 KB · Views: 69
  • a.png
    a.png
    72.1 KB · Views: 72
  • a.jpg
    a.jpg
    173.5 KB · Views: 74
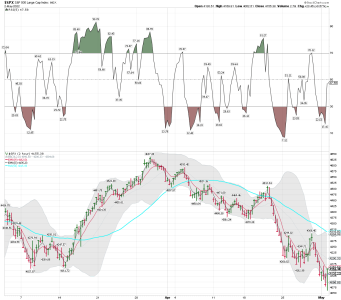
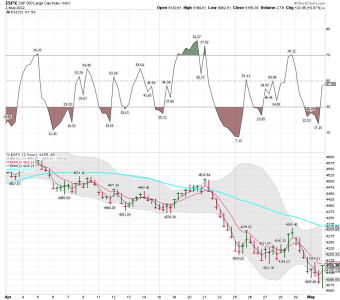
SPX 2 hour chart from yesterday: A nice close as we wait on the Fed:

The Bear Case Is Getting Played Out
Eric Shamilov | May 3, 2022 | Market Minute | 4 min read
On March 15 – a day before one of the most anticipated Fed meetings in recent history – the market found itself down 11% for the year.

All eyes were on this one…

The market was shellshocked that the stock bubble of 2021 had just popped. And combined with the financial panic from the Russian invasion, it seemed hopeless.

On paper it made sense. There was already an assumption that the Fed would lift rates.

And not just once, but at every meeting thereafter.

A regime shift like this, where a high-rate environment becomes official Fed policy, can only mean one thing…

Stocks needed to drop.

But then something funny happened…

The market rallied.

Judging from today’s 2% rally from the 4050 level on the S&P 500 – after it seemed like there was no bottom in sight – another relief rally may be taking shape.

Now would be a good time to start buying high quality stocks… those displaying profitability and growth in a challenging market.

Regards,

Eric Shamilov

Analyst, Market Minute
https://www.jeffclarktrader.com/market-minute/the-bear-case-is-getting-played-out/
 

Attachments

  • a.png
    a.png
    49.4 KB · Views: 75
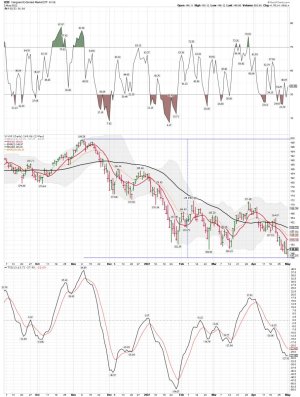
VXF daily: The S fund daily..... A lower low and and a possible DCL. To early to know, but I'll be trading it from the long side. I sold all my SDS, and now I'm flipping to some SSO. Looking to also trade some KBI. Keep in mind I'm trading in a Bear Market, so I will NOT be holding these positions very long. Waiting on the Fed.....
 

Attachments

  • a.jpg
    a.jpg
    166.2 KB · Views: 80
  • a.jpg
    a.jpg
    147.1 KB · Views: 81
Last edited:
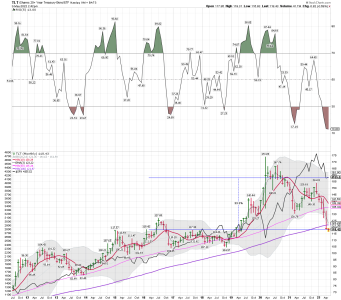
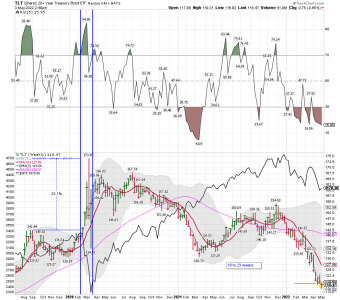
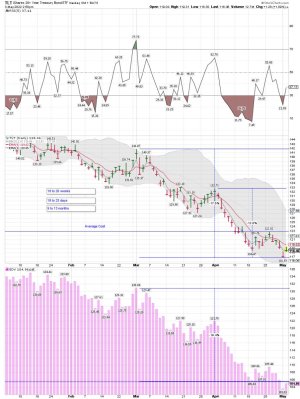
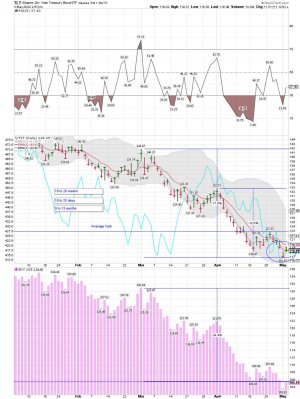
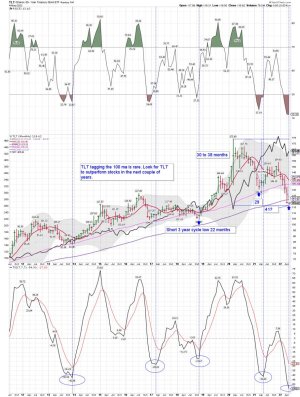
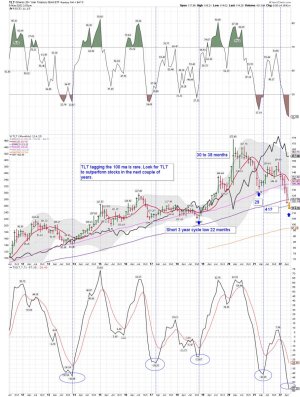
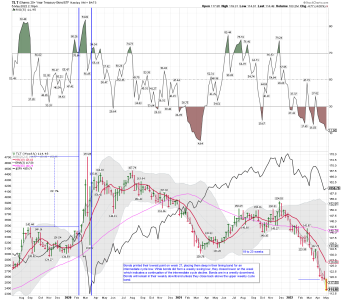
TLT daily, weekly, monthly: Rare and extreme ratio between TLT and SPY on the weekly and monthly chart. The divergence will correct, but when is the money maker. We shall see how it plays out! Note the move TLT made during the March 2020 sell-off.

Long some TLT again

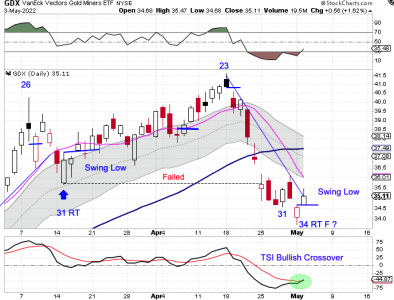
Long - SSO, XBI, GDXJ, JNUG, VXF These positions change often.....
 

Attachments

  • a.png
    a.png
    84.7 KB · Views: 76
  • a.png
    a.png
    70.9 KB · Views: 76
  • a.jpg
    a.jpg
    160.6 KB · Views: 79
  • a.jpg
    a.jpg
    167.5 KB · Views: 79
We shall see how it plays out!

Daily Cycle data: Stocks Complete Swing Low

Stocks broke below the previous daily cycle low on Monday to form a failed daily cycle. Monday was day 46, placing stocks very deep in their timing band for a DCL. Stocks managed to recover the breakdown level on Monday, forming a bullish reversal. On Tuesday stocks completed a swing low so we will label day 46 as the DCL, using Monday’s low as the stop. Stocks should go on to recover the 10 day MA as they really out of the DCL.

https://likesmoneycycletrading.wordpress.com/2022/05/03/stocks-complete-swing-low-2/
 

Attachments

  • a.png
    a.png
    43.9 KB · Views: 66
  • a.jpg
    a.jpg
    167.5 KB · Views: 68
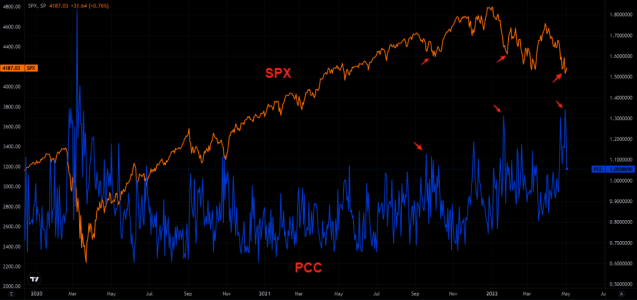
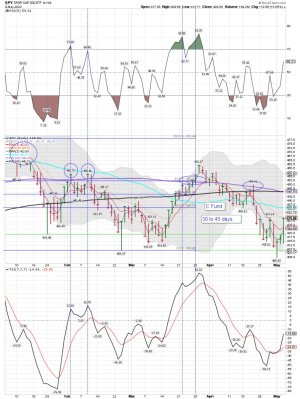
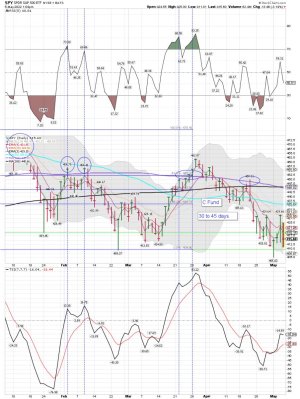
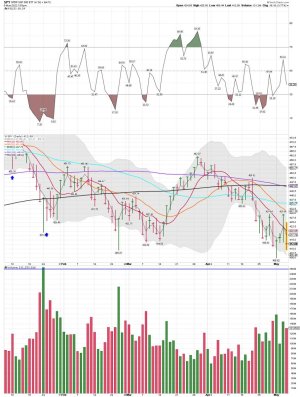
SPY daily and the DCL: This is the 4th time in the last few weeks the SPY has been unable to close above the 9 ema. Waiting to see how this daily cycle plays out. I might have to move back to cash. We shall see if buyers come in during the last hour of trading, or if selling increases.

Keep in mind I think we are in a Bear Market and that is how I'm trading.


This is more like the 2000 Bear Market in my opinion based on the patterns. See the rips and dips below on the 2000 Bear Market weekly chart. Some good trading both ways, but not using your TSP account.
 

Attachments

  • a.jpg
    a.jpg
    145.9 KB · Views: 65
  • a.jpg
    a.jpg
    173.6 KB · Views: 63
SPY daily going into the last hour of trading: The DCL has promise right now. We shall see if the SPY can close back above the 10 dma. A tag so far..... As you know the rate increase was already priced in the market..... Watching the close to see what kind of volume we get..... To me a possible ST Bear Market rally could be in play.

LONG GDXJ, SPY, VXF, SSO XBI, and TLT

Good trading as I'm done for the day!
 

Attachments

  • a.jpg
    a.jpg
    161.1 KB · Views: 69
TLT monthly: Why TLT now. Based on the monthly data below, and where TLT is now in the current cycle, the data indicates TLT will outperform the SPY the next couple of years. That is based on the monthly pattern on the chart below. So unless it's different this time the divergence should close up, SPY should move down, and TLT should start climbing out of it's 3 year cycle low. This is NOT my opinion it is based on the chart pattern below, as TLT hits an extreme pattern tagging the 100 mma. Sure, it might be different this time, but in the long run it looks like TLT will outperform SPY based on the data I'm looking over. Remember that those candlesticks below are monthly, and please note the 100 month moving average and the current TSI number.

Kaplan likes them too.... I do get his newsletter, and watch his twice weekly Zoom meetings. However, I'm a trader not an investor, but I like the his true contrarian data and prospective he provides me that I use along with my trading.

Safe havens are likely to significantly outperform for two or three years.


Safe-haven investments including U.S. Treasuries, government bonds of other countries, the Japanese yen, the Swiss franc, and probably also the British pound are likely to notably outperform U.S. large-cap growth shares for two or three years.


Investors who may be considering safe-haven investments have been avoiding them for the worst reasons including the fact that they have been poor performers in recent months. That makes them better, not worse, as their percentage gains will have to be higher to make up for their recent losses. Investors aren't paying enough attention to the amazing similarities between 2022 and previous years like 2000 and 1929 when large-cap growth stocks were in the early stages of their bear markets. Whatever happened under similar past circumstances is highly likely to reoccur with investing just as with most of life.
https://truecontrarian-sjk.blogspot.com/


True Contrarian
@TrueContrarian

Apr 5
Investors overall are too eager to take risks because those who took the most dangerous chances in recent years have generally been the most rewarded. People are obsessed with return ON capital and aren't considering the necessity to have return OF capital (i.e., not losing money
https://twitter.com/truecontrarian
 

Attachments

  • a.jpg
    a.jpg
    186.5 KB · Views: 70
Last edited:
SPY daily: Sold my positions at the close yesterday in my trading accounts. Still holding only TSP positions, but will reduce. The 20 dma is up next! I thought we might get some pullback after yesterday's move higher. We shall see how we close today.
 

Attachments

  • a.jpg
    a.jpg
    173.7 KB · Views: 71
SPY daily and Bear Market Trading: This is normal type trading in a Bear Market. We shall see how the DCL data plays out.....
 

Attachments

  • a.jpg
    a.jpg
    172.2 KB · Views: 66
SPY weekly 2000 Bear Market chart: In my opinion this is what is coming our way the next few years. I traded the 2000 and 2007 Bear markets and I don't plan on making some of the same mistakes I made back then. However, back then I had different tools and followed to many Guru's that took to much risk. Some of the weekly moves up in Bear Markets are very tradable. But buying the dip in a Bear Market using TSP ,when you only have two moves, have to buy in the morning, and can't use stops, or sell during the trading day, is not a fund to be using to much.

I went long this time based on my tools, but this could still end up being a failed daily cycle. For now I will hold because I'm testing a trading system for my son. He is a GS13. The system is based on a 100k of his funds used for stocks. So 100% long is a $100k position, not ALL of his money in TSP. A position 60% in stocks means he still has 40% in reserve to add and buy more shares. If gains increase to quickly they will be pulled out. The withdraws are based on I have unlimited moves exiting stocks back into the G Fund. I tried to get him to put more money in a Roth IRA at Vanguard, but because he is single he went for the tax break and puts 15k a year into his TSP account.

Anyway, wanted to let folks know what is going on when I go 100% long based on my tools. If I go to 100% long the max for that trade will never exceed 100k....

Again, waiting to see how this DCL plays out.

Good Trading, and I'm trading both ways today!
 

Attachments

  • a.jpg
    a.jpg
    173.6 KB · Views: 68
Last edited:
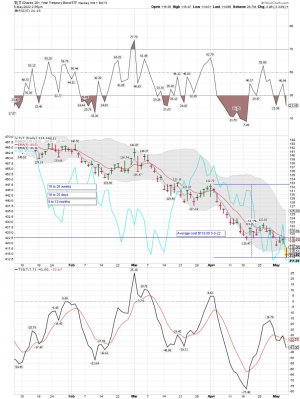
TLT monthly: Another huge move down for TLT this morning...... I added to my TLT position this morning and it remains a loser..... I trade using the daily and weekly data, but TLT moved beolw the 10 moth ma 5 months ago. It's been 19 weeks since TLT went to a weekly sell signal. A move below the 10 week ma is a confirmed sell signal. TLT remains in a brutal very extrem downtrend as it moves into it's 3 year cycle low. See the weekly chart below. As you look it over remember that cycle data is a huge part of my trading system.


For the record: I use likesmoney for my cycle data, but I DECIDED when to buy and how much.

https://likesmoneycycletrading.wordpress.com/Global Bond Market Decimated, Future Performance ‘Policy Dependent’

By Andrew Moran

http://truecontrarian.com/hedgefund/epochtimes.html

A picture of him below: I'm a longtime sub as I like to hear and read over his contrarian thoughts, and I do use some of his ideas in my trading system. Since I'm a short-term trader he doesn't care for my style, but I'm happy with my current trading tools using cycles and a few other indicators. I do track some of Steve's data, and join his weekly Zoom meetings, but I use them more as a warning indicator alone with my trading system.

https://truecontrarian-sjk.blogspot.com/


A finally thought: Sell in May is looking good for those that might use those type indicators for trading. We shall see how this daily cycle plays.

TSP Long: VXF, SPY, and hedge with SDS ( Trading SDS today ). I will take the gains and sell SDS before the close. I also sold all other positions yesterday before the close.

Trading JNUG/and GDXJ today - I Bought close to the low for a trade today, I will probably hold over night. I also added TLT today and my average share price is listed on the chart.
 

Attachments

  • a.jpg
    a.jpg
    187.1 KB · Views: 64
  • a.jpg
    a.jpg
    36.6 KB · Views: 63
  • a.png
    a.png
    97.4 KB · Views: 63
  • a.jpg
    a.jpg
    152.1 KB · Views: 63
Last edited:
SPY daily: We shall see if the low marker holds in the days ahead. (405.02) Bear Market Trading is in play........ This is NOT what you see in a Bull Market! A few buyers coming in at the close....
 

Attachments

  • a.jpg
    a.jpg
    162.9 KB · Views: 62
Looks Like Déjà Vu All Over Again

After rallying for an almost 3% gain on the Fed rate hike on Wednesday, stocks gave it all back and then some on Thursday.

This is beginning to look like the late February DCL. The powerful thrust out of the day 22 low indicated a ‘V’ shape bottom. Then stocks got hammered and trended lower until they consolidated which allowed the 10 day MA to flatten out. And it looks like stocks will need to consolidate which will help to allow the 10 day MA to flatten out before the rally into the new daily cycle can gain any traction.
https://likesmoneycycletrading.wordpress.com/2022/05/05/looks-like-deja-vu-all-over-again/
 

Attachments

  • a.png
    a.png
    50.5 KB · Views: 73
  • a.jpg
    a.jpg
    172.1 KB · Views: 75
Back
Top