Bear Cave 2 (Bull Allowed)

At a rapid pace
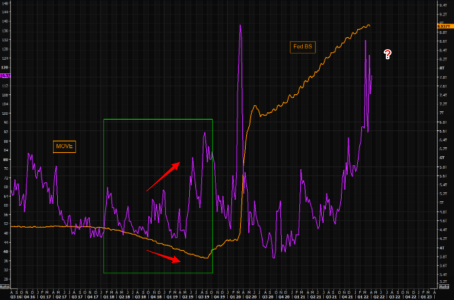
Guess Brainard didn't check this chart before talking about reducing the BS at a rapid pace. Last time Fed reduced the BS, MOVE index moved sharply higher and was a huge problem for markets. This time around things are obviously much more extreme. Regular readers of TME know our general take on volatility and Fed: Fed has distorted volatility markets. The steep rise in bond volatility, MOVE index, shows just that Fed can't manage "everything". How will this MOVE when they start shrinking it?
https://themarketear.com/
 

Attachments

  • a.png
    a.png
    137.1 KB · Views: 82
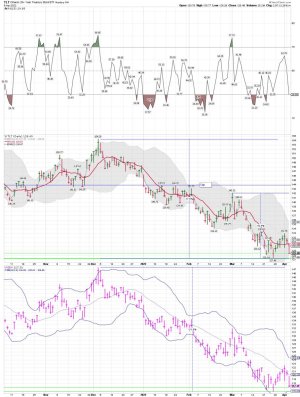
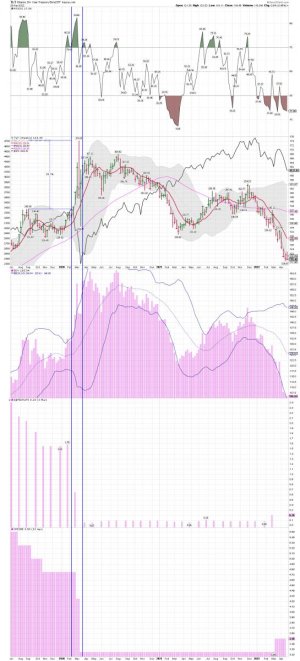
TLT daily: It looks like a gap down at the open and another lower low.
 

Attachments

  • a.jpg
    a.jpg
    161 KB · Views: 76
  • a.png
    a.png
    34.5 KB · Views: 73
Investors tend to underrate cash, not realizing the importance of keeping a high cushion--not for safety but to make future purchases into panics.


More than half of the money I made from investing in the current century was from buying into panics and selling into subsequent rebounds. If you remain too heavily invested through a misguided Boglehead attitude or for any other reason then you will not only periodically suffer outsized losses but, even more importantly, you will not have enough cash to make heavy purchases into all important bottoming patterns. Many subscribers in March 2020 told me they hadn't listened to my urgent requests to sell in January 2018 and January 2020 and therefore only had enough money to make minor additions to their portfolios.

Kaplan
https://truecontrarian-sjk.blogspot.com/
 
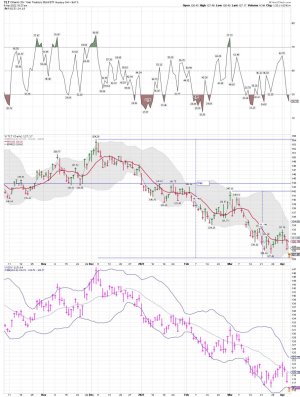
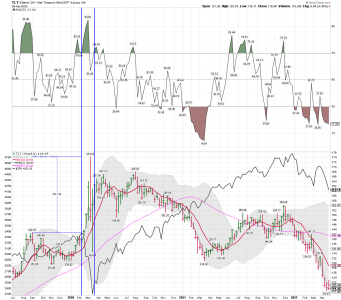
TLT daily: A gap down, but buyers are coming in. A lower low and a lower BB crash.

Long some TLT
 

Attachments

  • a.jpg
    a.jpg
    156.7 KB · Views: 73
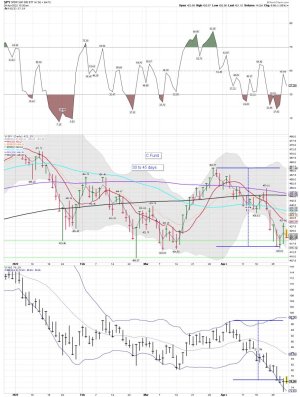
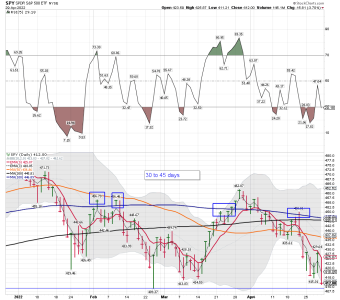
SPY daily: Still a possible ICL/DCL.... My plan was to buy in the green zone based on a possible ICL/DCL..... We shall see how it plays out.... Nothing is for sure in a market like this one. I'm trading like it's a Bear Market NOT a Bull Market. Looking for a bounce back up to test the 10 dma, and a possible test of the 200 dma.... LOL....we shall see!

Unable to post much lately as I'm dealing with some family issues... On the sidelines has NOT been a bad place to be.....

Good Trading to all!


Repricing a Market Priced for Zero
April 27, 2022

The most challenging financial event for investors in the coming decade will be the repricing of securities to valuations that imply adequate long-term returns, following more than a decade of reckless and intentional Fed-induced yield-seeking speculation.

https://www.hussmanfunds.com/comment/mc220429/
 

Attachments

  • a.jpg
    a.jpg
    147.9 KB · Views: 67
Last edited:
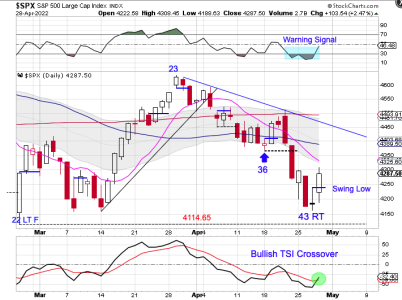
Cycle data: We shall see how it plays out.

Stocks formed a swing low on Thursday.


Stocks printed their lowest point on Wednesday, day 43, placing them late in their timing band for a DCL. Thursday’s swing low has good odds of marking the DCL. Stocks should close above the 10 day MA and then go on to break above the declining trend line as they rally out of their DCL.

I do have a concern over how RSI 05 embedded in oversold during this daily cycle decline. I plan to discuss this further in the Weekend Report.

https://likesmoneycycletrading.wordpress.com/2022/04/28/daily-cycle-low-7/
 

Attachments

  • a.png
    a.png
    47.2 KB · Views: 68
Repricing a Market Priced for Zero
John P. Hussman, Ph.D.
President, Hussman Investment Trust

Buckle up, buttercup.

The most challenging financial event for investors in the coming decade will be the repricing of securities to valuations that imply adequate long-term returns, following more than a decade of reckless and intentional Fed-induced yield-seeking speculation.
More: https://www.hussmanfunds.com/comment/mc220429/
 
SPY: A DCL and and a lower high? Maybe, but pull out your trading in an a Bear Market tools. TSP traders will only two moves a month should be very careful here. This type of market is why you should alos have a Roth IRA for trading and can also be used for hedging your TSP account. There are times one should be long and short depending on the sectors you are trading!

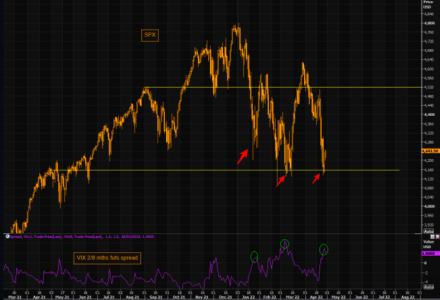
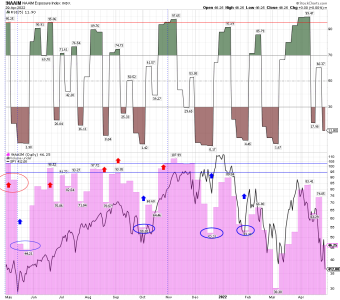
SPX - respect ranges

More frustration in SPX as the range lows hold again. Poor liquidity, short gamma and very elevated levels of fear (see the VIX futures spread)...and we are 100 points higher from the low print 2 sessions ago. Let's see how things develop post Apple earnings, but frustration is huge, and short gamma will magnify all moves.
https://themarketear.com/
 

Attachments

  • a.png
    a.png
    101.6 KB · Views: 61
  • a.png
    a.png
    56.5 KB · Views: 60
Last edited:
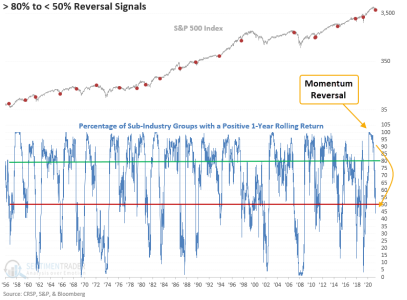
This momentum signal suggests caution for stocks
An increasing number of industries are struggling.

The number of sub-industry groups with a positive 1-year rolling return crossed below 50% this week. The downward shift in momentum occurred after more than 80% of the groups had positive returns as recently as February.

When we assess the outlook for stocks after the number of sub-industry groups with a positive 1-year rolling return cross below 50% with a reset condition of 80%, we see that forward returns were poor, especially over the next 2-3 months.

Another worry? It triggered right before the last two 10% drawdowns in the S&P.
https://sentimentrader.com/sentimentedge-report
 

Attachments

  • a.png
    a.png
    59.4 KB · Views: 67
That dot in 2007 is worth noting. Things were getting bearish by that point, but the bear market had not yet begun.
 
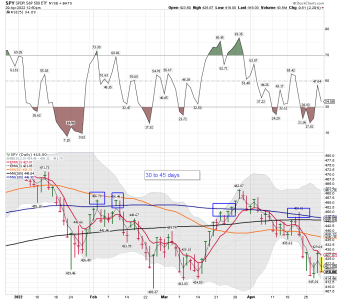
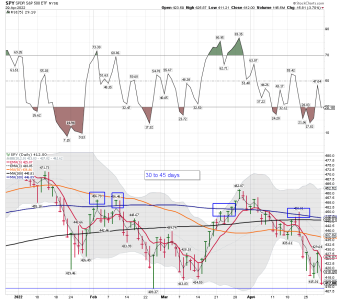
SPY daily: Testing the March low marker - 409.37...... TSPer's will get their 2 moves back next week..... The pattern has continued as SPY has been unable to start a trending move above the 100 dma, will the current move down be a higher low or an undercut? We shall see next week? I'm sure NOT going short NOW..... Sold my short positions to early again, but that's ok. Bulls make money, Bears make money and pigs get - you know, turned into bacon and pork chops.

Some of his latest tweets....
David Rosenberg
@EconguyRosie

Apr 28
The front page of today's USA Today says it all. Four years of price hikes lumped into one! Didn't even happen in the 1970s. Question is -- what do the next four years look like now that the Fed is going to crush demand and this prior pricing power?
https://twitter.com/EconguyRosie?lang=en
 

Attachments

  • a.png
    a.png
    56.5 KB · Views: 64
Last edited:
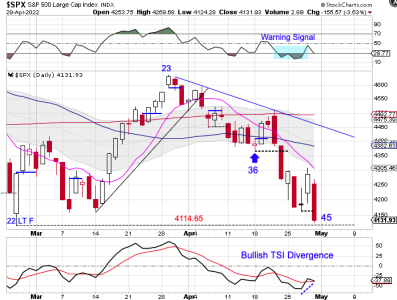
SPY daily: Ugly! Still no DCL....

Stocks formed a swing low on Thursday then negated that swing low on Friday.

Stocks printed their lowest point on Friday, day 45, placing them deep in their timing band for a DCL. So we are still waiting on a swing low and close above the 10 day MA to signal a the DCL. Stocks are in a daily downtrend and will remain so unless they close back above the upper daily cycle band.

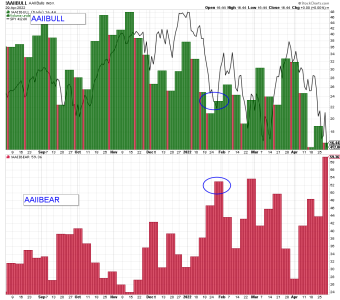
This is the 12th worst month for NASDAQ ever
A negative 13.3% qualifies for a 12th worst ever. You would have needed -15% to make it into the "worst 10" list (beating November 1973). To be the worst month ever you have to beat October 1987 that has a 27% decline. Our poster-child of this bear, ARK Innovation, actually managed to (-28% in April).
https://themarketear.com/
 

Attachments

  • a.png
    a.png
    47.6 KB · Views: 62
  • a.png
    a.png
    56.5 KB · Views: 62
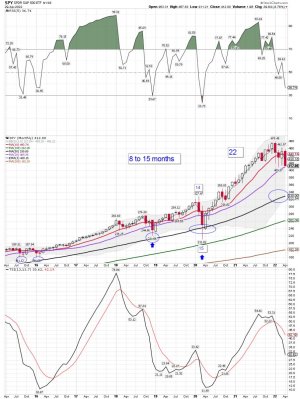
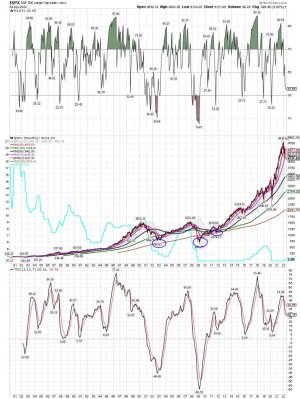
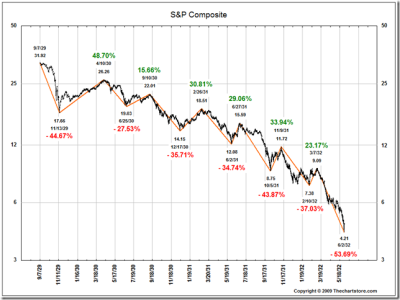
SPY monthly: A tag of the 200 month ma is normal during a Bear Market. However, one would think a undercut is likely....
 

Attachments

  • a.jpg
    a.jpg
    183.1 KB · Views: 56
  • 1929.png
    1929.png
    85.3 KB · Views: 55
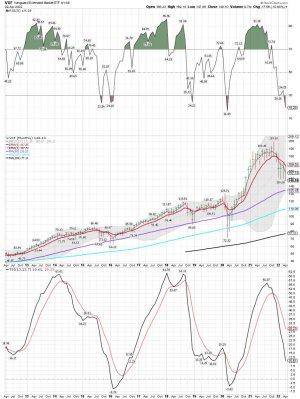
VXF daily: VXF is leading on the monthly trend down, but a long way to go to get back to some sort of mean. VXF still remains very stretched above the 100 month moving average, but getting close to the 50 month ma.
 

Attachments

  • a.jpg
    a.jpg
    167.6 KB · Views: 61
TLT weekly: A rough week for stocks last week! Will there soon be a flight to safety? We shall see! Still holding some TLT and it's a loser for now.

Hmmm......
 

Attachments

  • a.jpg
    a.jpg
    101.6 KB · Views: 68
  • a.png
    a.png
    95.6 KB · Views: 66
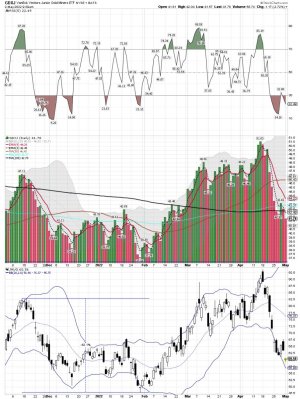
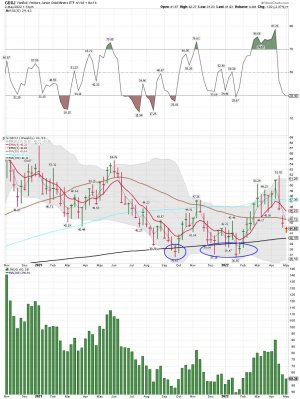
GDXJ daily: Back below the 200 dma so I'm buying shares again for a trade.
 

Attachments

  • a.jpg
    a.jpg
    185.7 KB · Views: 60
I thought a smart guy was buying the dip. Then I looked at GDXJ

It is a gold miners stock if I didn't blow the lookup. :D

Predator :laugh:
 
I thought a smart guy was buying the dip. Then I looked at GDXJ

It is a gold miners stock if I didn't blow the lookup. :D

Predator :laugh:

I sold my GDXJ shares sometime back. Now that GDXJ has moved back below the 200 dma I will be taking a new position. I’m not an investor and trade the miners often..... Both ways on occasion. We could move much lower, but I will be adding not selling. I like the odds for a trade.

I did add to the C fund today as I’m trying to catch the next DCL. A high risk trade, but I like the odds this late in the cycle. I’m Trading using Bear Market rules, and will exit the trade after a new daily cycle is confirmed. LOL..... We shall see how it plays out. I’m trading and hedging TSP in my other trading accounts. I’m also day trading JNUG and NUGT. Got some shares close to the lows of the day this morning.
 
Last edited:
GDXJ weekly: Looks like we are getting closer as GDXJ weekly is getting close to testing the 200 week moving average. This could turn out to be a very nice MT trade.... A trend that would last for many weeks.

Gold update Buying opportunity coming

May 2, 2022

https://www.youtube.com/watch?v=MNMRO7vcLfE&t=550s
 

Attachments

  • a.jpg
    a.jpg
    156.8 KB · Views: 64
Back
Top