Bear Cave 2 (Bull Allowed)

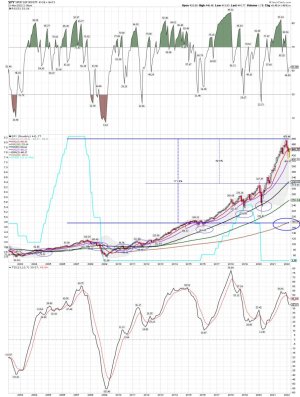
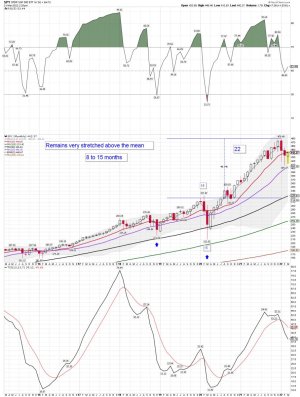
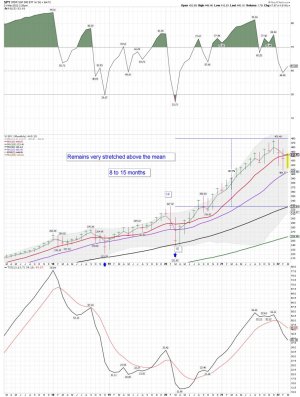
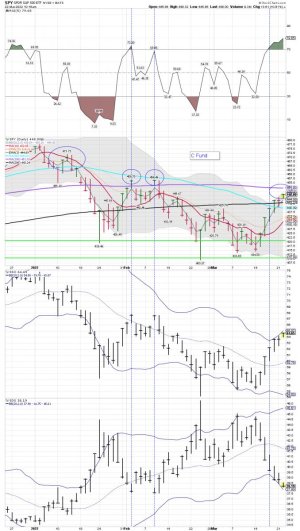
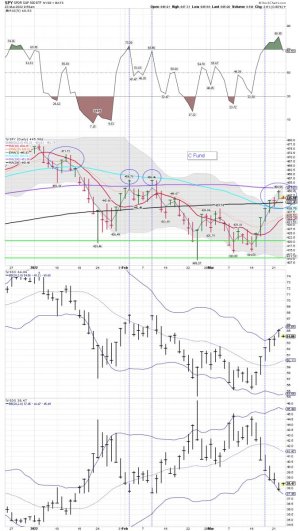
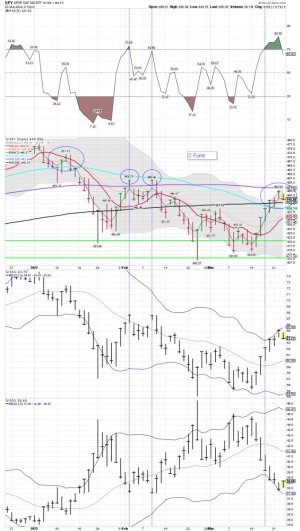
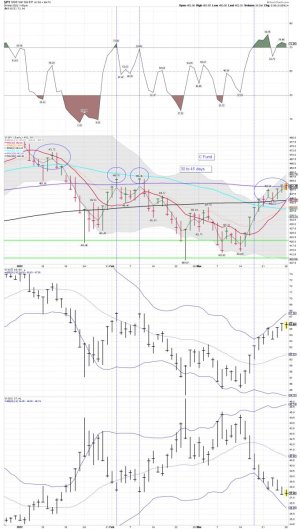
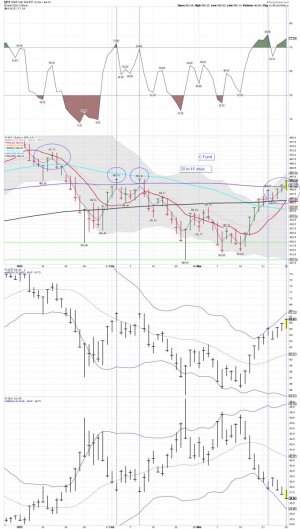
SPY monthly: Getting closer - To moving back above the 10 month moving average... For now it remains resistance and is still very stretched above the mean. We shall see how it plays out as the Fed pulls back from its balance sheet and increases rates..... Like many have pointed out.... The easy money has been made. The Bulls will want to see a close back above the 10 month ma. ( Last chart - a closer look) It's normal for the monthly to trend much closer to the 50 month ma. However, we haven't seen much we can call normal for a few years now.
 

Attachments

  • a.jpg
    a.jpg
    167.5 KB · Views: 108
  • a.jpg
    a.jpg
    151.7 KB · Views: 109
  • a.jpg
    a.jpg
    155.6 KB · Views: 108
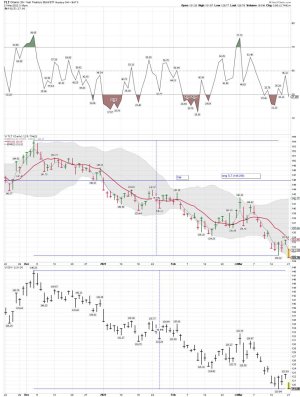
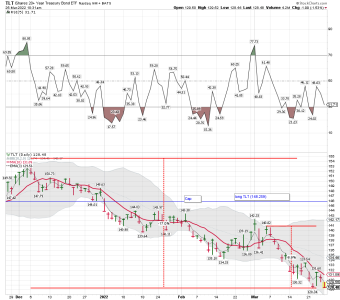
TLT daily: Undercutting the low..... We shall see if buyers come in before the close.....

Bottom Line: The trend remains down
 

Attachments

  • a.jpg
    a.jpg
    139.7 KB · Views: 102
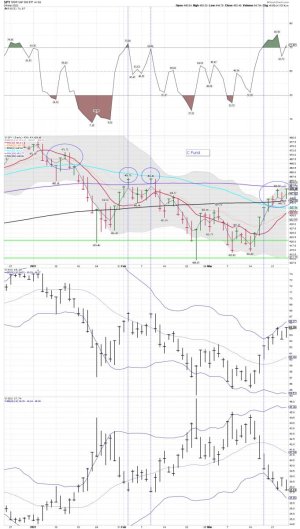
SPY daily: The trend remains up..... The next test is the 100 dma.
 

Attachments

  • a.jpg
    a.jpg
    131.7 KB · Views: 94
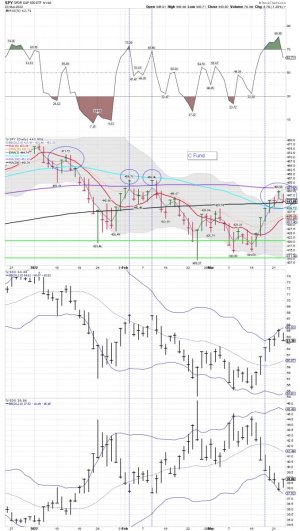
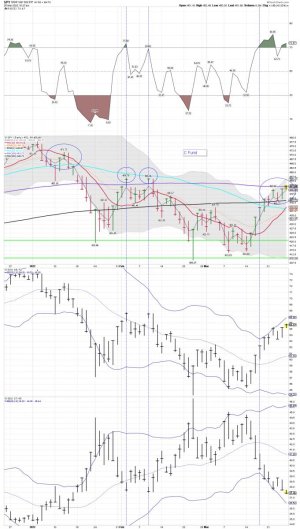
SPY daily: Resistance at the 100 dma.... Back testing the 3 ema..... A tad oversold so some pullback was expected. Will we BT the 10 dma is what I'm watching?
 

Attachments

  • a.jpg
    a.jpg
    132.4 KB · Views: 91
SPY daily: The first test of resistance (100 dma) failed, and now we are close to testing support (50 dma) We shall see if it holds and if it's really support.

Many traders are watching this: I have no opinion on how this will play out, but the pattern is clear. So it needs to be different this time. The last two times it failed to hold above the 100 dma. The SPY went on to make a lower low. Maybe this time it will make a higher low like it did in March. We shall see.....


SevenSentinels Retweeted
navtrader
@Trader_NAV

4h
There's a graveyard silence in the bear camp. That's the uncertainty the bear market rallies create. I will continue to probe on the short side with small stops. There will be some whipsaws here. But once we get some momentum, we will not see any new highs after that.
 

Attachments

  • a.jpg
    a.jpg
    132.6 KB · Views: 80
Last edited:
Opinion: As stocks wobble, the March 2000 Nasdaq top is a harsh reminder that the long run isn’t always your friend

Last Updated: March 22, 2022 at 12:54 p.m. ET

By Mark Hulbert


The stock market doesn’t necessarily produce handsome returns over time

Most investors are in denial about this part of U.S. market history, either ignoring it altogether or believing that it’s irrelevant to what the future holds. The extraordinary bull market of the past decade has spoiled investors into thinking that spectacular gains, year in and year out, are to be expected. Yet assuming the future is even remotely like the past, they sooner or later are in for a very rude awakening.

https://www.marketwatch.com/story/a...-long-run-isnt-always-your-friend-11647893789


Market Extra

The yield curve is speeding toward inversion — here’s what investors need to know
Last Updated: March 23, 2022 at 2:03 p.m. ET
First Published: March 22, 2022 at 3:32 p.m. ET
By Vivien Lou Chen

The U.S. Treasury yield curve has inverted ahead of every U.S. recession since the 1950s, according to Principal Global Investors
https://www.marketwatch.com/story/t...estors-need-to-know-11647977540?mod=home-page
 
This Signal Hasn’t Happened in Over Two Years
Jeff Clark | Mar 24, 2022 | Market Minute | 3 min read
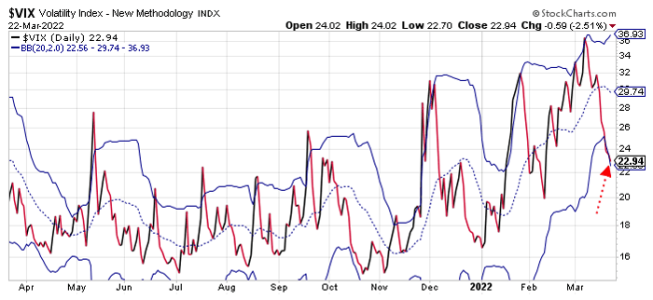
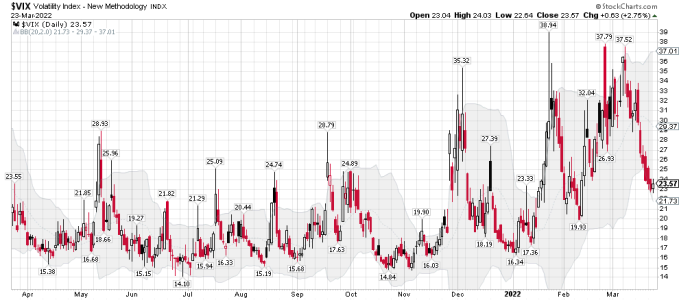
The Volatility Index (VIX) is often called Wall Street’s fear gauge. It’s rare to get VIX sell signals.

We get VIX buy signals about four or five times each year.

But we haven’t had a VIX sell signal in two and half years.

Well, we just got one…

Look at this chart…

Like I said, VIX sell signals are rare. And, they’re not all that bad… at first.

The two previous sell signals led to immediate (but shallow) declines.

In each case, the S&P 500 lost about 2% over the next week or so. That’s about 100 points on the S&P 500 in today’s environment.

Following those brief declines in late November 2019 and August of 2018, the S&P 500 bounced back and rallied to even higher levels. So, if we follow that road map, traders ought to be looking to buy if the S&P 500 dips back down into the 4350-4400 range.
https://www.jeffclarktrader.com/market-minute/this-signal-hasnt-happened-in-over-two-years/
 

Attachments

  • a.png
    a.png
    38.1 KB · Views: 76
SPY daily: Stopped at the 100 dma, but the back test of the 50 dma held. We shall see what today brings...
 

Attachments

  • a.jpg
    a.jpg
    132.5 KB · Views: 90
  • a.png
    a.png
    29.2 KB · Views: 83
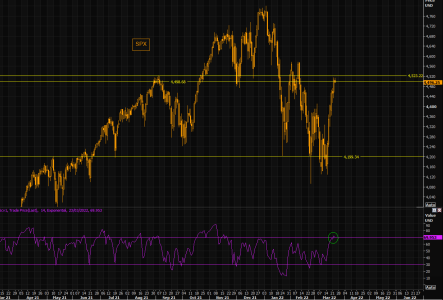
SPX - time to chill?

SPX has squeezed from the low of the range straight up to the high of the range. People still try to push the break out momentum, but there is no trend in SPX to be pushed. Let's see where we go from here, but we are rather overbought; 4500/45200 is a big "congestion" area and short gamma is gone (dealers are sellers of deltas on upticks). Time for SPX to chill for a few days?
https://themarketear.com/
 

Attachments

  • a.png
    a.png
    44.8 KB · Views: 85
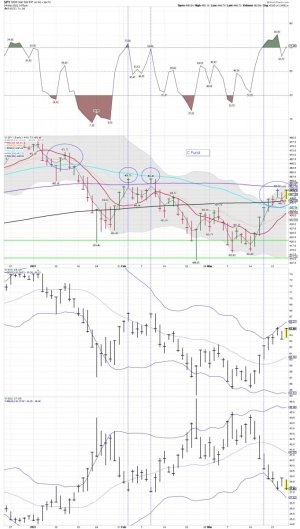
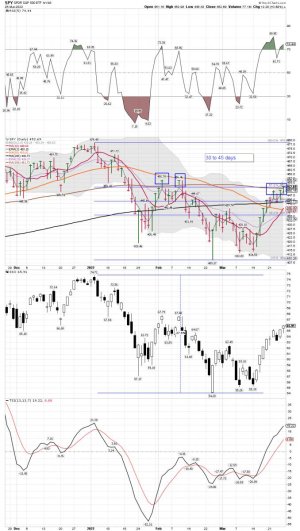
SPY daily: Day 5 since moving above the 50 dma, but still stopped at the 100 dma. The last time it moved above the 100 dma in Feb it failed twice. Watching to see how this plays....

10 minutes to go before the closing bell, so a move and a close above the 100 dma will have to wait.......
 

Attachments

  • b.jpg
    b.jpg
    117.7 KB · Views: 80
Last edited:
SPY daily: Lots of opinions out there on what the SPY will do next. After the current move up I'm flat SSO and looking at a possible SDS trade. I like to trade SSO and SDS in one of my trading accounts.

Consolidation

Stocks remain stretched above the 10 day MA.

Stocks have begun to crawl along the 200 day MA, which is allowing the day 10 MA to catch up to price.

So tonight I wanted to drill down to the 4 hour chart for a different perspective.
https://likesmoneycycletrading.wordpress.com/2022/03/24/consolidation/
 

Attachments

  • a.png
    a.png
    130.9 KB · Views: 78
  • a.jpg
    a.jpg
    117.7 KB · Views: 81
SPX - now that was quick

SPX has gained almost 400 points since recent lows. The panic up has been stronger than the panic down and has taken most by surprise. Despite all the price action since early January, the SPX remains in a wide range and lacks a proper trend. In our thematic emails (premium subs only), we outlined the latest VIX guy logic on March 9 (the guy nailed it again) and on March 15, in our note "The only thing we have to fear right now is fear itself...", we suggested "How about one of those violent bear market squeezes?". Since then equities have exploded higher and vols have collapsed. The potential has played out very well. It is time to book profits and look for the next opportunity. Time for a thread and some early buying of protection.
https://www.zerohedge.com/premium?u...campaign=premium&utm_content=tme_website_link
 
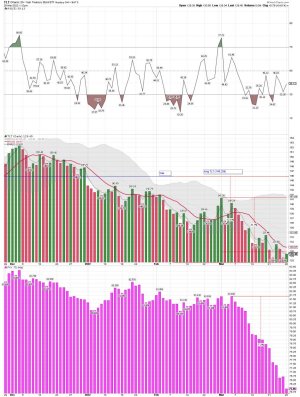
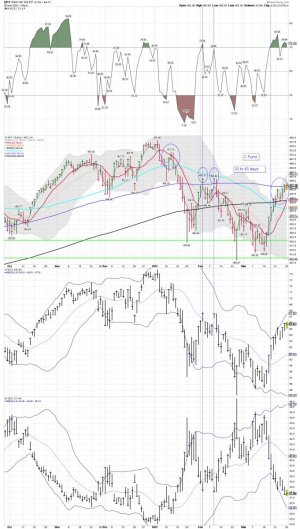
SPY/TLT daily charts: The SPY is moving above the 100 dma, and TLT is testing the lows.


Bottom Line: Some are selling TLT and buying SPY..... We shall see how it all plays out.
 

Attachments

  • a.jpg
    a.jpg
    118.5 KB · Views: 94
  • a.png
    a.png
    48.5 KB · Views: 89
SPY daily: The trend remains up!

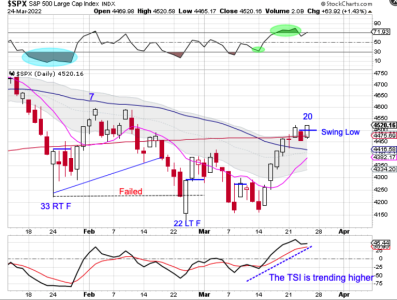
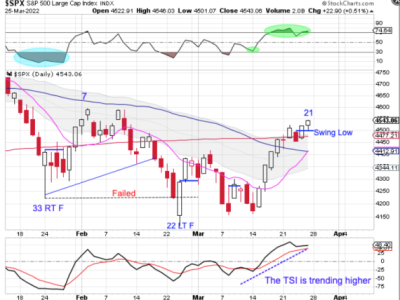
The 3/26/22 Weekend Report Preview

Stocks recovered the 200 day MA on Tuesday then went on to print a new daily cycle high on Friday.

Friday was day 21 for the daily cycle. The new high on day 21 shifts the odds toward a right translated daily cycle formation. That aligns with stocks being in a daily uptrend. Stocks will remain in their daily uptrend unless they close below the lower daily cycle band.
The 3/26/22 Weekend Report Preview
 

Attachments

  • a.png
    a.png
    115.1 KB · Views: 86
  • a.jpg
    a.jpg
    126.5 KB · Views: 88
Long some TLT and I bought my first tranche of FXY today. Lots of cash on hand and I like to trade extremes....

JPY is on the move and this is why you need to care

When a massive asset class / currency (3rd most traded globally) moves like this it more often than not gets ripple effects in other asset classes / risk appetite. It is worth paying attention. The gap vs US equity volatility (VIX) that has now opened up would also support our "long VIX" call from late last week. Time for a Yen thread.
https://themarketear.com/
 

Attachments

  • a.jpg
    a.jpg
    202.9 KB · Views: 79
SPY daily: Holding above the 100 dma, but getting deeper into this daily cycle. One would think the 10 dma will be back tested in the days ahead.

Beer Money trade: Long a small position of SDS
 

Attachments

  • a.jpg
    a.jpg
    136.2 KB · Views: 80
  • a.jpg
    a.jpg
    117.5 KB · Views: 80
SPY daily: A very nice finish today, and day two for the close above the 100 dma.

Bottom Line: The trend remains up!
 

Attachments

  • a.jpg
    a.jpg
    118.5 KB · Views: 76
Quit While You’re Ahead

John P. Hussman, Ph.D.
President, Hussman Investment Trust

https://www.hussmanfunds.com/comment/mc220325/
March 2022

Good stuff...

The information contained in earnings, balance sheets, and economic releases is only a fraction of what is known by others. The action of prices and trading volume reveals other important information that traders are willing to back with real money. This is why trend uniformity is so crucial to our Market Climate approach. Historically, when trend uniformity has been positive, stocks have generally ignored overvaluation, no matter how extreme. When the market loses that uniformity, valuations often matter suddenly and with a vengeance. This is a lesson best learned before a crash rather than after one.

– John P. Hussman, Ph.D., October 3, 2000

 
Back
Top