Bear Cave 2 (Bull Allowed)

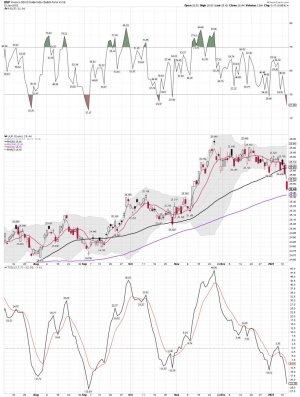
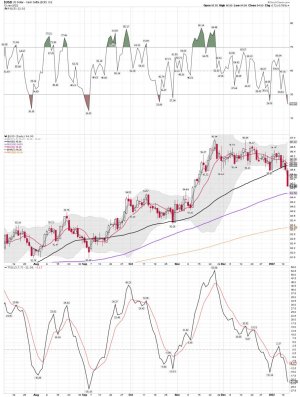
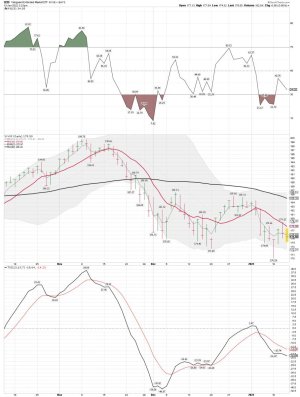
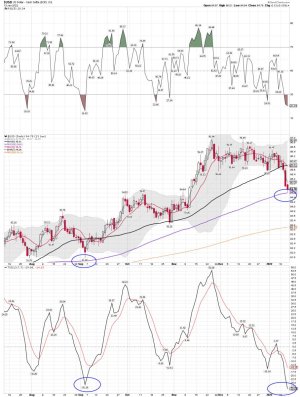
Breaking down or getting ready to bounce? We shall see if UUP bounces off the 100 sma on the daily soon or something bigger is in play. Is the flight to safety run now over? The dollar is getting a tad oversold in the ST, and we now have a lower BB crash in play. If the dollar bounces it will put pressure on the metals.


King dollar breaking down
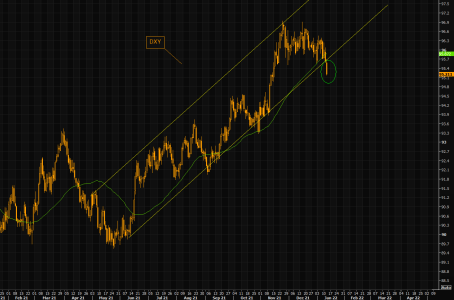
The DXY is breaking below the huge trend channel that has been in place since May last year. Note it has not traded this much below the 50 day in a very long time. The relative long EEM, FXI, copper etc trades are all extending gains. For a deeper read on the USD dynamics see here.
https://themarketear.com/
 

Attachments

  • a.png
    a.png
    41.5 KB · Views: 59
  • a.jpg
    a.jpg
    154.6 KB · Views: 56
  • a.jpg
    a.jpg
    155.8 KB · Views: 54
Last edited:
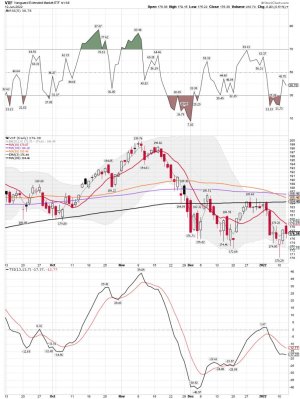
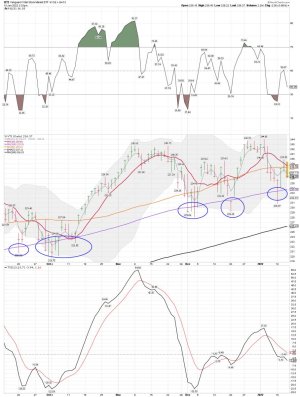
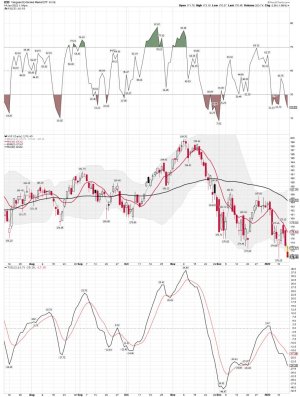
VXF daily: Closed below the 10 sma today on the daily chart. Maybe the Bulls and the buyers can make it close above the 10 sma on the daily later this week. The cycle dudes would like it! Lots of folks be watching what small caps are doing...


SevenSentinels Retweeted
Mac10
@SuburbanDrone
·
3h
Another negative breadth day on the Nasdaq while the index was up.

Only a year of notice the rally was ending.

So how would anyone know?
 

Attachments

  • a.jpg
    a.jpg
    146.7 KB · Views: 48
  • a.png
    a.png
    257.9 KB · Views: 49
VXF daily: Heading into the last hour of trading and VXF remains below the 3 ema, 10 sma, and the 50 sma on the daily chart. Where's the Beef as we start a new daily cycle? I see lots of risk and not much reward right now..... Well, that's based on my data and what I'm seeing. This market is more like a - "DO YOU FEEL LUCKY" market to me.

Flat: VTI and VXF......
 

Attachments

  • a.jpg
    a.jpg
    129.2 KB · Views: 45
  • a.jpg
    a.jpg
    49.7 KB · Views: 44
  • a.jpg
    a.jpg
    13.2 KB · Views: 44
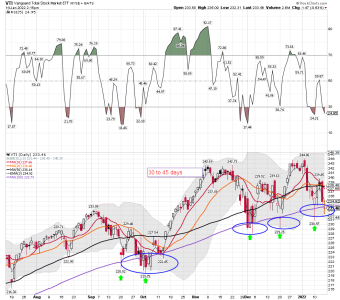
VTI daily: Still no confirmed BUY signal based on the data I use.

I remain flat VTI: VTI equals the total stock market at Vanguard, and the index I trade to most. Maybe we will see some buyer come in before the close. Tomorrow is "Free Lunch Friday", and then we have "Easy Money Monday!"

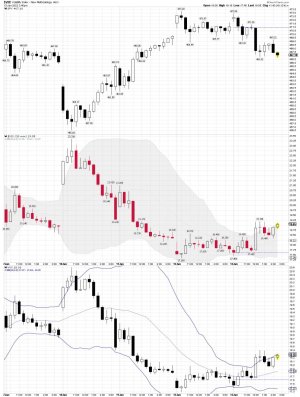
VIX 30 minute chart: We shall see if the VIX smashers show up as VXX tages the upper BB on the 30 minute chart.


LOL..... Maybe it is..... ( See tweet below)

thomas
@VolumeDynamics

1h
Say, is this the dip we're s'posed to buy?

https://twitter.com/VolumeDynamics
 

Attachments

  • a.jpg
    a.jpg
    142.5 KB · Views: 47
  • a.jpg
    a.jpg
    155.1 KB · Views: 47
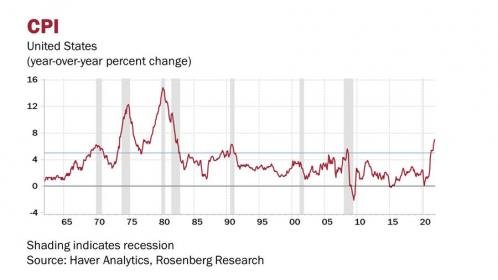
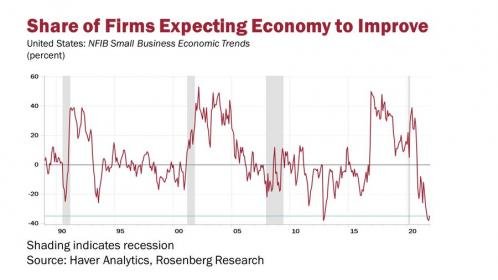
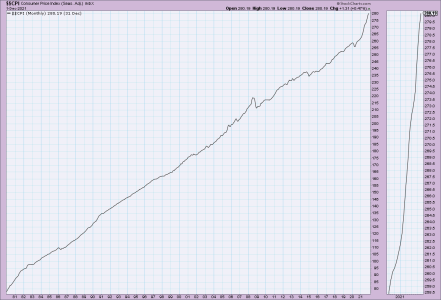
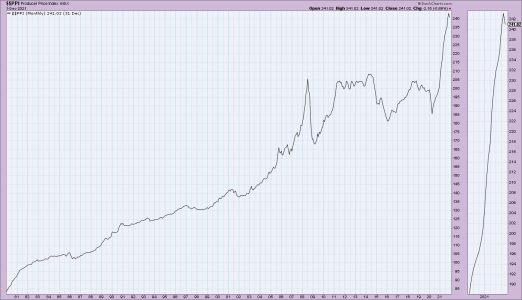
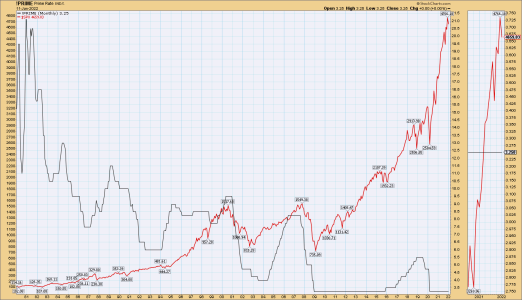
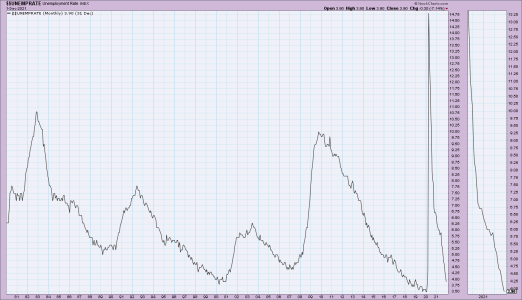
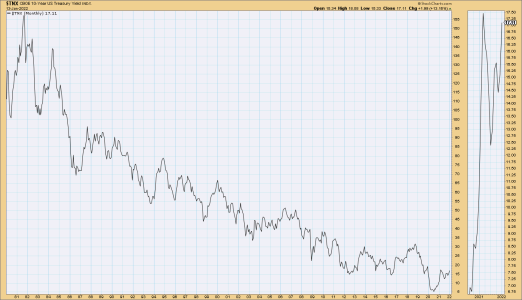
Hmmmmm.... CPI/PPI/Prime lending rate/10 year yield: Easy money gets you inflated stock prices and sometimes inflation..... The Fed wanted more inflation, and now they have it! But now the Fed might have to fight inflation by increasing rates faster and reducing their bond program. Maybe we should ask Kenny about this? We shall see how it all plays out.

The picture of the shooter is a 22 LR Vudoo...... Mine is on order and will take around 5 months to arrive. Used for serious plinking at the range.

https://vudoogunworks.com/

https://www.youtube.com/watch?v=O8BnGrvnrww

I still think the easy money has been made and one should be playing small ball this year....

For the Record: NONE of this matters to me for trading. I have a trading system and trade both ways. This data is for investors...... I'm NOT an INVESTOR!

I remain flat VTI and VXF:
 

Attachments

  • a.png
    a.png
    22 KB · Views: 50
  • a.png
    a.png
    31.7 KB · Views: 51
  • a.png
    a.png
    57.3 KB · Views: 52
  • a.png
    a.png
    41.8 KB · Views: 52
  • a.png
    a.png
    48.1 KB · Views: 51
  • a (1).jpg
    a (1).jpg
    101.9 KB · Views: 52
  • a.jpg
    a.jpg
    71.9 KB · Views: 52
Last edited:
"When I left the government many years ago I left a portion of my money in the TSP and rolled over the rest into an IRA so I could do more active trading. Now I'm getting a little sick of getting screwed every time I make one of our two precious IFTs each month. The trade is made and my account sits for four hours and gets eaten alive. It actually makes me consider moving the rest of my TSP balance into my IRA. Would that be ironic if TSP Talk guy gets out of the TSP?"

I hear you Brother: I mainly use the TSP now for the G Fund. I will be taking another go at moving some money in the TSP account just to see how my system works out. LOL..... However, since I'm close to 70 now the percentages will be much smaller then I use to do in the old days. With that said, I still think small ball is the game to play this year in the TSP. All in Big moves based on what I'm currently seeing will be more like gambling in my opinion.

VXF daily after the close: Still to many sellers.....
 

Attachments

  • a.jpg
    a.jpg
    131.6 KB · Views: 46
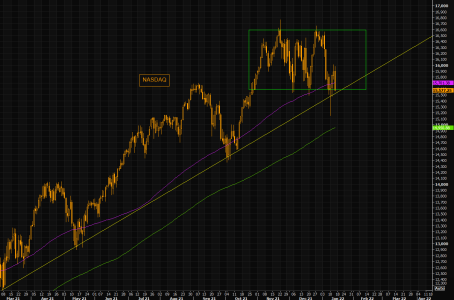
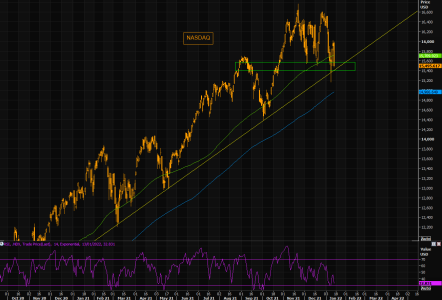
NASDAQ - make or break is here (again)
Watch closely if NASDAQ closes below the the most recent low close. 15600 is a key level to watch (futs). We are "well" below the 100 day, but the longer term trend line is coming in around these levels. Imagine we tried the 200 day moving average eventually? That is the next big support. Second chart shows Nomura's tech sentiment. No comments are needed...
https://themarketear.com/
 

Attachments

  • a.png
    a.png
    56.3 KB · Views: 46
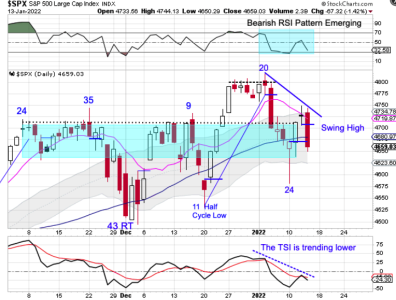
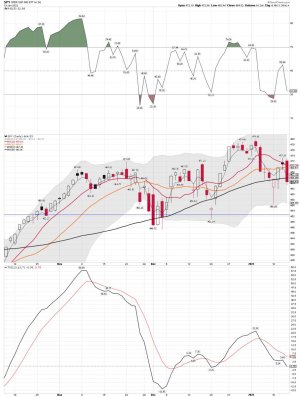
Cycles: I mentioned the cycle data would not be good if SPX could not hold the 10 sma on the daily.

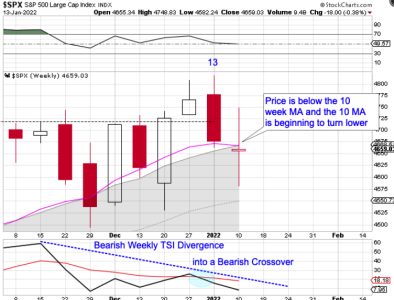
SPY weekly: A close below the 3 ema and the 10 sma on the weekly chart. Not what you want to see this deep into the current cycle as the cycle dude is pointing out.

Bearish Reversal

Forming a swing low and closing back above the 50 day MA on Tuesday looked, in real time, as if day 24 hosted an early DCL. That was negated on Thursday.

Stocks were rejected by the declining 10 day MA and formed a lower swing high on Thursday to close below the 50 day MA. This sets up the declining trend line and indicates a continuation of the daily cycle decline — which makes Thursday, day 27.

With price below the 10 week MA and the 10 week MA beginning to turn lower, this can turn into an intermediate cycle decline and the long over due yearly cycle decline, which I plan to discuss in the Weekend Report.
https://likesmoneycycletrading.wordpress.com/2022/01/13/bearish-reversal-4/
 

Attachments

  • a.png
    a.png
    134.2 KB · Views: 49
  • a.png
    a.png
    99.3 KB · Views: 48
  • a.jpg
    a.jpg
    148.1 KB · Views: 48
Last edited:
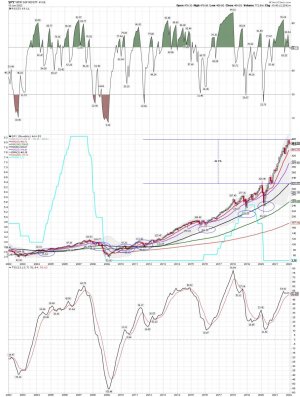
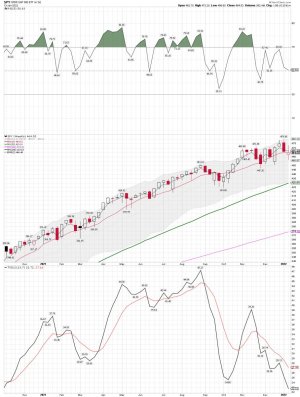
SPY daily/monthly: Hmmmmm....YCL coming? We shall see!
 

Attachments

  • a.jpg
    a.jpg
    131.3 KB · Views: 51
  • a.jpg
    a.jpg
    150 KB · Views: 49
NASDAQ - back to very oversold, but...

NDX closed right in the big support "congestion" area. We closed below the 100 day moving average, but the longer term trend is still around these levels/slightly lower. 200 day is some 3% lower. RSI is oversold, but as we all know, oversold can stay oversold for longer time periods, especially when RSI "establishes" low levels (note RSI in February and September 2021). Big oscillations and a non trend remains the theme, but watch this closely should we close slightly lower...
https://themarketear.com/
 

Attachments

  • a.png
    a.png
    52.8 KB · Views: 52
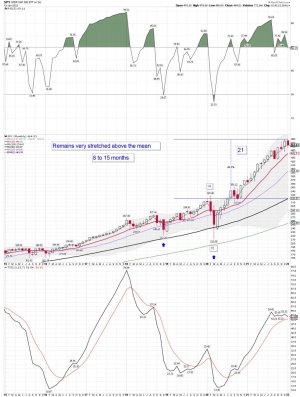
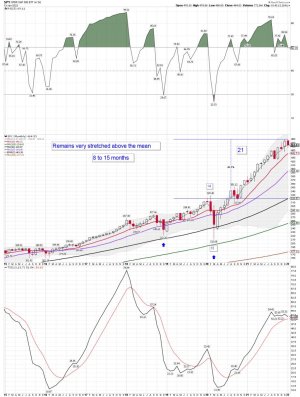
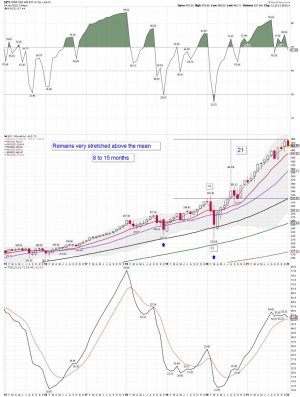
SPY monthly: We "WILL" see a tag of the 50 sma and a RSI ( under 30 again) on the monthly chart. The odds continue to increase that it "COULD" happen this year. I will just trade what is happen not what I think will happen because my magic 8 ball is broken. My point is investors should watch this, as the insiders continue to sell. One would think we will see a bounce soon...

I remain flat VTI and VXF:

Long GDXJ:
 

Attachments

  • a.jpg
    a.jpg
    163.5 KB · Views: 46
  • a.jpg
    a.jpg
    151.8 KB · Views: 46
Last edited:
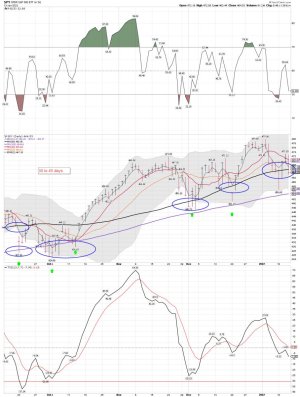
SPY daily: A gap down below the 3 ema, 10 sma, 20 sma, and the 50 sma on the daily chart. We shall see if buyers come in and save the day.

Up next - Free Lunch Friday and Easy Money Monday. Are we moving into a YCL in the months ahead? We shall see..... A tag of the 50 sma on the daily chart has been a winner for traders. I be watching....

I have NO positions in the SPY index: Flat We never got a confirmed buy signal after moving back above the 3 ema. Waiting to see a close back above the 10 sma. The whipsaws continue as I wait for the next confirmed trend.....
 

Attachments

  • a.jpg
    a.jpg
    139.3 KB · Views: 57
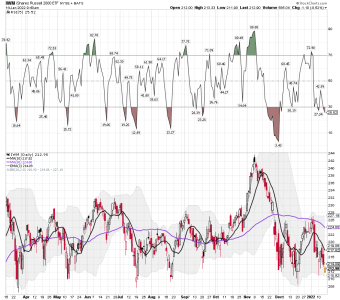
Small Caps"

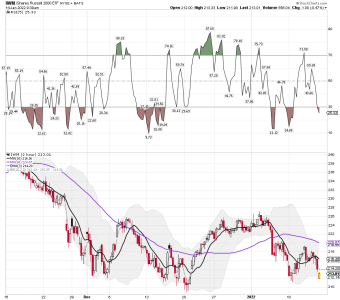
IWM remains very ugly..... Testing the lower BB again.... I might take a ST trade. The pattern indicates high odds for a winner..... Small Ball for position size.
 

Attachments

  • a.png
    a.png
    59.6 KB · Views: 58
  • a.png
    a.png
    78.5 KB · Views: 57
VXF daily: Testing the lows, and a lower BB tag..... We shall see if buyers come in.

Long VXF..... Will we get a higher low? STBD! (It just under cut, but I like to use the daily closing price) Looks ugly and remains in a downtrend!

This is a counter trend trade and my trading system remains in a cash position. Doing some ST trading and playing some small ball!
 

Attachments

  • a.jpg
    a.jpg
    153.8 KB · Views: 47
VTI daily: VTI and the 100 sma pattern on the daily chart..... Time to buy or add? Waiting to see how we close, and this is NOT the same market we have been trading in the last year. Get ready for Bigger Swings and lots of whipsaws. Keep in mind that I BE ONLY trading and NOT INVESTING these indexes.
 

Attachments

  • a.png
    a.png
    68.1 KB · Views: 48
USD daily: It tagged the 100 sma on the daily chart, and we got an oversold bounce so far. We shall see how this plays it. It looks to be putting pressure on stocks today. I added some more GDXJ today, but buyers are not coming in as quick today. I will be watching the last hour of trading..... One would think we will bounce some, but this is not the 2021 market folks are use to. Additional selling will NOT be GOOD! Buying early in a Bull market is never a problem, but this Bull is stretched above it's mean (The SPY) and getting long in the tooth.

NO..... I don't know where the dollar is headed next..... However, since I trade both ways I don't really care. I will trade what it does to the indexes in realtime..... Up or down as I don't really care. I'm sure investors are pulling their hair out trying to figure out how to play this market. BTD..... my not work as well this year.
 

Attachments

  • a.jpg
    a.jpg
    160 KB · Views: 61
Last edited:
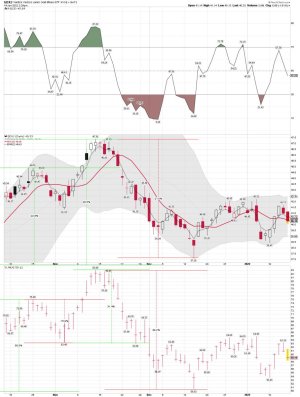
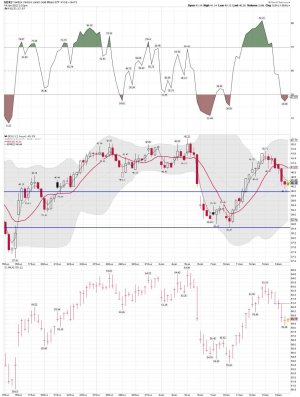
GDXJ daily: Waiting to see if the Bulls can get back the 10 sma on the daily. The cycle dudes will comment this weekend about where we are in the current daily cycles.

I added a few more shares close to $40.00ish as we moved below the 10 sma on the daily. I bought a tad early today, but buying below $40.00ish is still my plan....


GDXJ 2 hour chart:
 

Attachments

  • a.jpg
    a.jpg
    130.6 KB · Views: 59
  • a.jpg
    a.jpg
    138.6 KB · Views: 58
LOL..... This is a good one! 2021 was the year of extremes. We shall see how 2022 plays out.

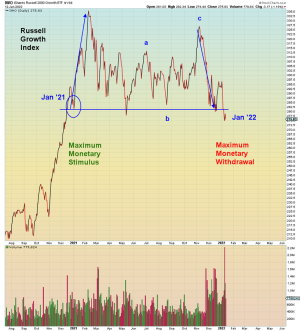
Extreme Valuations - The difference between genius and stupidity is that genius has its limits.

– Albert Einstein


Return-Free Risk


John P. Hussman, Ph.D.
President, Hussman Investment Trust

January 14, 2022

"The single difference between the most recent market cycle and other cycles across history is that in every other cycle, speculation always had a well-defined limit. We gauged those extremes based on what I describe as “overvalued, overbought, overbullish” syndromes. Unfortunately, zero interest rates have proved to be a kind of acid that burns through every shred of intellect, driving investors to imagine that any asset that varies in price – regardless of how extreme its valuation or how uncertain its underlying cash flows – is better than zero-interest cash. My error in this cycle was to believe that speculation still had well-defined limits. In late-2017, I abandoned that view, and became content to gauge speculation versus risk-aversion based on the condition of market internals. Since then, we’ve refrained from adopting or amplifying a bearish outlook when our measures of internals are constructive, regardless of how extreme valuations might be."

The thing that ‘holds the stock market up’ isn’t zero-interest liquidity, at least not in any mechanical way. It’s a particularly warped form of speculative psychology that rules out the possibility of loss, regardless of how extreme valuations have become.

– John P. Hussman, Ph.D., Maladaptive Beliefs, September 12, 2021

https://www.hussmanfunds.com/comment/mc220114/

Bottom Line: SPY monthly chart - The SPY is currently way above its mean based on all the historical data I looked at.
 

Attachments

  • a.jpg
    a.jpg
    152.1 KB · Views: 69
Last edited:
"When I left the government many years ago I left a portion of my money in the TSP and rolled over the rest into an IRA so I could do more active trading. Now I'm getting a little sick of getting screwed every time I make one of our two precious IFTs each month... "[by Tom 1/14/21 Market Comments] "I hear you Brother: I mainly use the TSP now for the G Fund..." [by Robo] ....
Interesting and I agree. I just retired 2-weeks ago & planning to roll-over most of my TSP to Self-Managed IRA (not sure which & welcome ideas/tips), but leave perhaps 20% to 25% in TSP for the meanwhile to use G-fund while still able to move it given drastic stupid limits in/out of CSIF some. Thank you both Tom and Robo for commenting on this.
 
Back
Top