Bear Cave 2 (Bull Allowed)

SevenSentinels
@SevenSentinels
·
15m
2:15

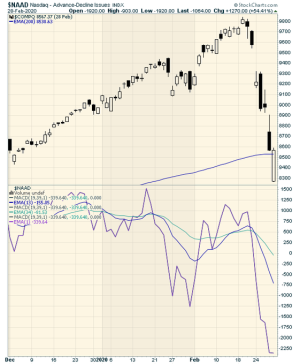
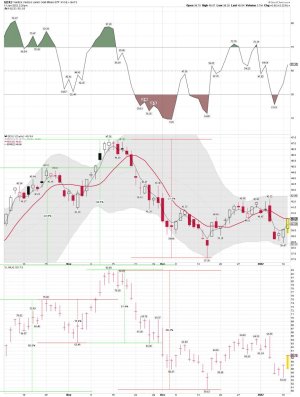
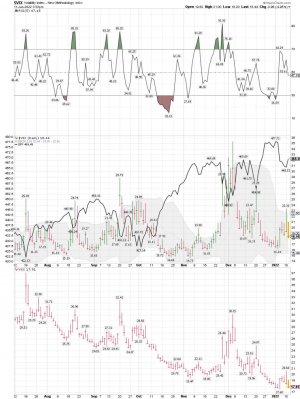
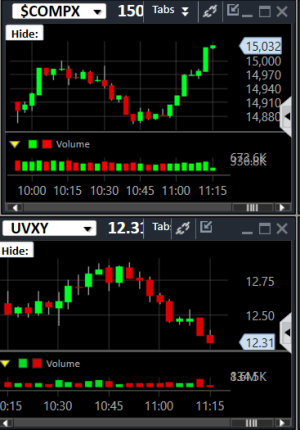
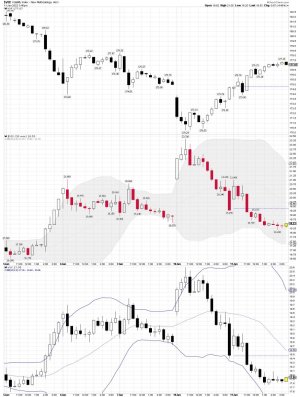
One chart below is Feb 28, 2020 (during the crash)

The other is today

Can You Tell Which Is Which?
https://twitter.com/SevenSentinels?ref_src=twsrc^google|twcamp^serp|twgr^author


thomas
@VolumeDynamics

So if you don't think the economy is crashing... can you explain to me this flight load from NY to LA today, Monday, busiest day of the week. Click on seat map
https://united.com/en/us/flightstatus/details/752/2022-01-10/EWR/LAX/UA
10:41 AM · Jan 10, 2022·Twitter Web App
https://twitter.com/VolumeDynamics/status/1480595651851272192


David Rosenberg
@EconguyRosie
·
Jan 7
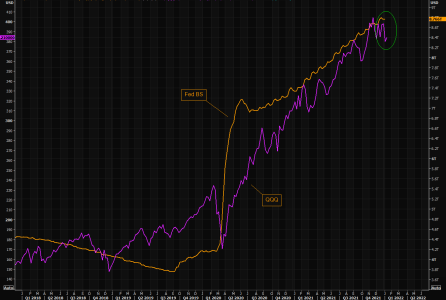
Strip out oil (thank you, Libya!) and banks (thank you, Fed!), and the S&P 500 is down 2.5% for the year -- and no higher now than at the beginning of November. A two-sector story.
https://twitter.com/EconguyRosie?lang=en
 

Attachments

  • a.png
    a.png
    182.3 KB · Views: 59
  • a.png
    a.png
    160 KB · Views: 58
Hmmmm... Does it matter? We shall see!

Jesse Felder Retweeted
Nautilus Research
@NautilusCap
·
3h
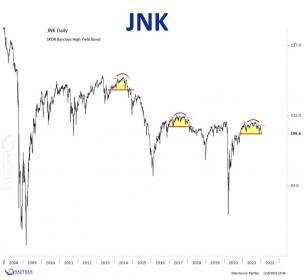
$JNK

https://twitter.com/jessefelder


Jesse Felder
@jessefelder
·
3h
"The reduction in liquidity from the Fed will cause both the equity risk premium and interest rates to rise which will disproportionately impact the riskiest assets in the market, particularly cryptocurrencies which have no intrinsic value."
 

Attachments

  • a.jpg
    a.jpg
    7.8 KB · Views: 57
  • a.jpg
    a.jpg
    126.4 KB · Views: 56
  • a.jpg
    a.jpg
    19.1 KB · Views: 54
Last edited:
HYG: Probably the Fed at work! Easy money Monday.....

Heading into the last hour of trading.....
 

Attachments

  • a.png
    a.png
    65.4 KB · Views: 58
Too long for me to read.....


It's A Bear Market, No Wait, It's A Bull Market
Jan. 10, 2022 10:53 AM

Summary
A lot of digital ink is spilled debating whether we are in a continued bull market or when the next market crash will arrive.

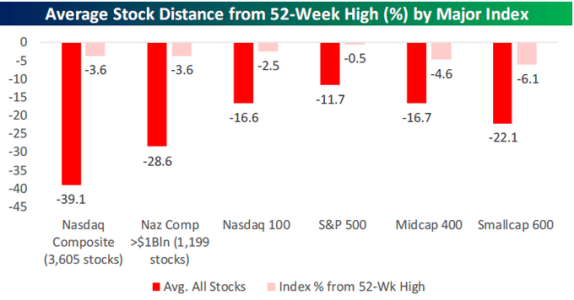
Keeping this in mind, it is a market of stocks, and a majority of stocks in the NASDAQ are already in a bear market.

The average stock in the NASDAQ has lost more than 40% of its value. Off-setting this, we are in a bull market in many commodity-oriented equities, including Exxon Mobil.

Prior to this past week, only the Teflon 5, which are Apple, Microsoft, Alphabet, NVIDIA, and Tesla, had held up the market, however, even these safe-haven companies are seeing their walls breached.

Going forward, look for the rolling bear market to continue, and as it concludes, the next phase of the growth-to-value rotation, which has been ongoing since March 23rd, 2020, will continue.

This idea was discussed in more depth with members of my private investing community, The Contrarian. Learn More »


Closing Thoughts: There Is Both An Ongoing Bear Market And An Ongoing Bull Market
If you are just paying attention to the broader market indices, which are dominated by a handful of primarily large-cap technology stocks, that have really become bond proxies at this juncture, you are missing much of the narrative playing out under the surface of the stock market. More specifically, there is an ongoing rolling bear market, where the average Nasdaq Composite stock is down more than 40% from its highs. Additionally, there is an ongoing, rolling bull market, where many out-of-favor equities, including the much scorned traditional energy sector, have delivered eye-opening gains.
https://seekingalpha.com/article/44...urce=seeking_alpha&utm_term=RTA+Article+Smart

Comments about the chart below:
However, what if I told you that, according to Bespoke, on December 13th, 2021, the average Nasdaq Composite (COMP.IND) stock was down 39.1% from its 52-week high.
 

Attachments

  • a.png
    a.png
    27.7 KB · Views: 57
Stocks formed a bullish reversal on Monday.


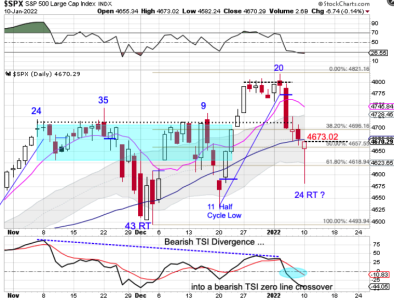
Daily Cycle Low?
by likesmoneystudies

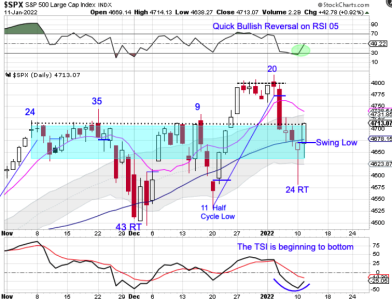
Stocks formed a bullish reversal on Monday.


Monday was day 24 for the daily equity cycle, which is a bit early to expect a DCL to form. However, stocks closed below the 10 day MA turning it lower, closed below the 50 day MA, and retraced well past the 61% fib level. If stocks form a swing low and close back above the 50 day MA then we will label day 24 as an early DCL. Stocks have been in a daily uptrend. If they form a swing low above the lower daily cycle band then stocks will remain in their daily uptrend and trigger a cycle band buy signal. A break above 4673.02 will form a daily swing low.
 

Attachments

  • a.png
    a.png
    144.8 KB · Views: 56
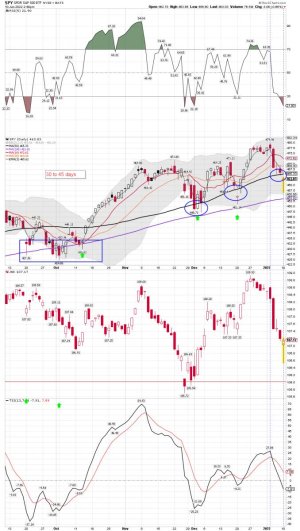
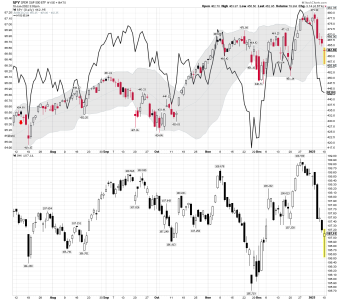
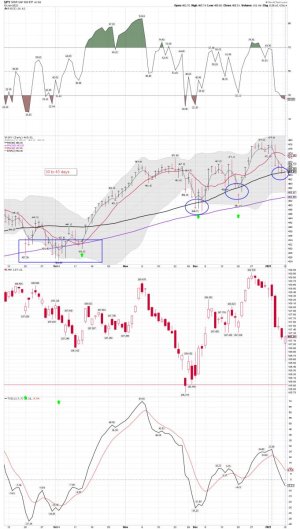
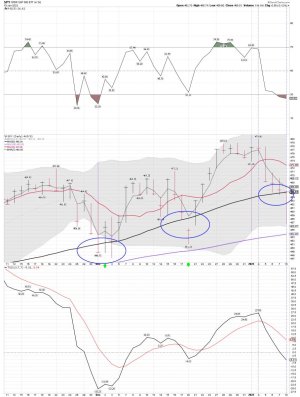
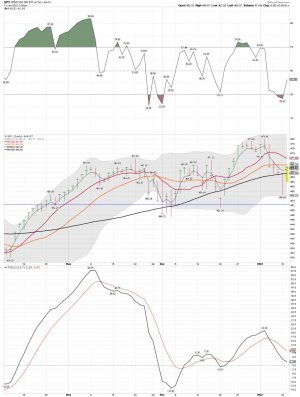
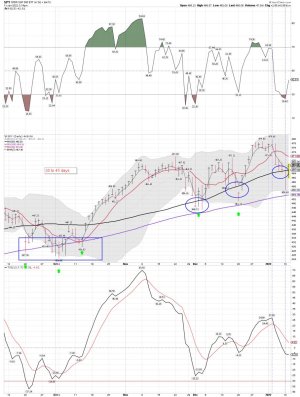
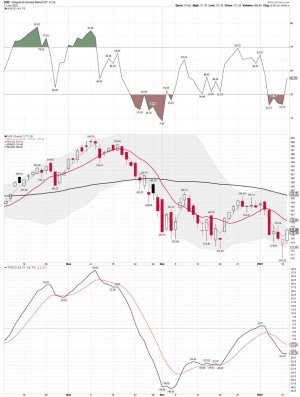
SPY daily: A nice move up from the lows and closed above the 50 sma on the daily. So some are pretty Bullish now..... We shall see how it plays out, and the Bulls/Buyers have the edge.
 

Attachments

  • a.jpg
    a.jpg
    115.6 KB · Views: 58
  • a.jpg
    a.jpg
    135.6 KB · Views: 58
SPY daily: The SPY is on the move and if you bought when the SPY moved below the 50 sma on the daily you be happy.... The hurdle for the SPY is to close above the 10 and 20 sma on the daily chart.

With 2 hours to go the SPY looks good!

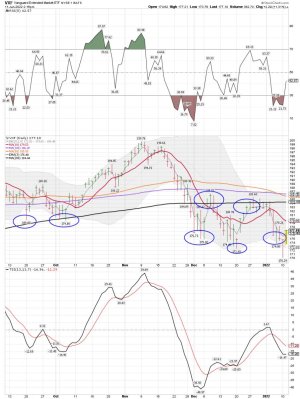
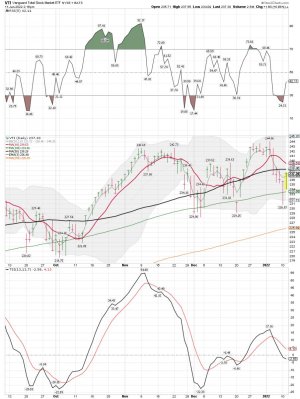
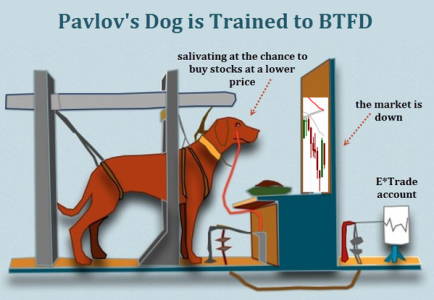
VTI, VXF, and the SPY..... All three are moving up nicely, and all are now back above the 3 ema..... The 10 sma be up next. We shall see how we close as the BTDer's continue to show up and the Fed remains in the game.

Flat - VXF and VTI

Long - GDXJ
 

Attachments

  • a.jpg
    a.jpg
    128.9 KB · Views: 48
  • a.jpg
    a.jpg
    143.5 KB · Views: 47
  • a.jpg
    a.jpg
    148.7 KB · Views: 47
  • a.jpg
    a.jpg
    142.2 KB · Views: 47
VXF/VIX/VXX: The 30 minute data and the Bulls/Buyers got this!
 

Attachments

  • a.jpg
    a.jpg
    150.8 KB · Views: 49
On the face of it, the equity market is doing fine.

The S&P 500 has hit new all time highs.
But The Russell 2000 Growth Index didn’t get anywhere last year.

We have seen a massive dispersion in the market.
If you owned the top ten stocks, like Google, Microsoft, or Nvidia, you have done awesomely.
But at the same time, we have 35% of Nasdaq stocks that are down 50% or more from their recent highs.

Under the surface, more and more stocks are rolling over hard.
It feels a lot like the early 1970s, when we had the Nifty Fifty stocks:
The broad market was being held up by around 50 large cap stocks, like IBM or Xerox.
These companies were seen as the best of the best, they were not being impacted by inflation because of their pricing power, and every money manager sheltered there.

Their valuations rose to crazy levels.
In the end, the rise in labor costs broke their back and the bubble burst.
--Mark Dittli, "If the Fed Tightens Too Much, They Will End Up With an Equity Market Crash", TheMarket.ch, January 5, 2022.
https://themarket.ch/interview/louis-gave-a-hawkish-fed-could-provoke-an-equity-crash-ld.5727
 
Yes Sir: I have did it a few times....... An old article, but the point is a very good one!

Useful research supports the idea of acting gradually.


The Massachusetts Institute of Technology completed a revealing study a few months ago demonstrating that dramatic portfolio changes are far more likely to be destructive rather than helpful (yes, I had included this link in my September 30, 2021 update):

Kaplan

https://www.cnbc.com/2021/09/27/pan...ket-dips-are-often-married-men-with-kids.html

True Contrarian
@TrueContrarian
·
Jan 9
The value of value stocks: See my Seeking Alpha article at

https://twitter.com/TrueContrarian?ref_src=twsrc^google|twcamp^serp|twgr^authorKaplan
 
SPY daily: The cycle guys like it!

Swing Low

Stocks formed a swing low on Tuesday.

Stocks printed their lowest point on Monday, day 24, which is a bit early to expect a DCL to form. But as we discussed on Monday, stocks have otherwise satisfied the criteria for a DCL. And with stocks being in a daily uptrend, forming a swing low and closing above the 50 day MA indicates a continuation of the daily uptrend and triggers a cycle band buy signal. Therefore we will label day 24 as the DCL. Stocks should go on to break above the 10 day MA and turn it higher as they rally out of their DCL.
https://likesmoneycycletrading.wordpress.com/2022/01/11/swing-low-3/
 

Attachments

  • a.png
    a.png
    135.2 KB · Views: 57
....It's A Bear Market, No Wait, It's A Bull Market
Jan. 10, 2022 10:53 AM....

Prior to this past week, only the Teflon 5, which are Apple, Microsoft, Alphabet, NVIDIA, and Tesla, had held up the market, however, even these safe-haven companies are seeing their walls breached.

Going forward, look for the rolling bear market to continue, and as it concludes, the next phase of the growth-to-value rotation, which has been ongoing since March 23rd, 2020, will continue.

This idea was discussed in more depth with members of my private investing community, The Contrarian. Learn More »

Closing Thoughts: There Is Both An Ongoing Bear Market And An Ongoing Bull Market
If you are just paying attention to the broader market indices, which are dominated by a handful of primarily large-cap technology stocks, that have really become bond proxies at this juncture, you are missing much of the narrative playing out under the surface of the stock market. More specifically, there is an ongoing rolling bear market, where the average Nasdaq Composite stock is down more than 40% from its highs. Additionally, there is an ongoing, rolling bull market, where many out-of-favor equities, including the much scorned traditional energy sector, have delivered eye-opening gains.
https://seekingalpha.com/article/44...urce=seeking_alpha&utm_term=RTA+Article+Smart
...
[Bold/Large font added for EMPHASIS ABOVE]

This whole thought about a rolling bull market where out-of-favor equities have delivered eye-opening gains caught my attention. I have been reading an old book, "How To Make Money In Stocks" A Winning System in Good Times or Bad by William J O'Neal, Founder of Investor's Business Daily, in which he mentions this as a Bear market warning. He mentions a few others but this one stuck out because he said this is "a sure sign of the beginning of a bear market" (p. 64). Great book! I just got in equities today so I am watching carefully...don't want to overstay my welcome. Best wishes Robo!
 
Last edited:
"I just got in equities today so I am watching carefully...don't want to overstay my welcome."

The move up looks promising as a DCL looks to be in. We shall see if VXF can move back above the 10 sma in the days ahead. I still don't like the weakness I'm seeing from VXF. VXF remains below its 50 sma on the daily chart. Not what we want to see in a strong trending Bull Market. VXF needs to move above the 50 sma level and hold. In my opinion, it's the position size when buying that gets many investors into trouble. They buy to much all at once. I think it is time to ensure Risk Management when taking all new positions. There are just several stocks holding things together right now. I still think the easy money has been made and think investors will have a tough time trying to make money in 2022. It's time to play small ball if you are in....

I remain flat VTI and VXF.....

Long: GDXJ

Take Care!
 

Attachments

  • a.jpg
    a.jpg
    131.7 KB · Views: 59
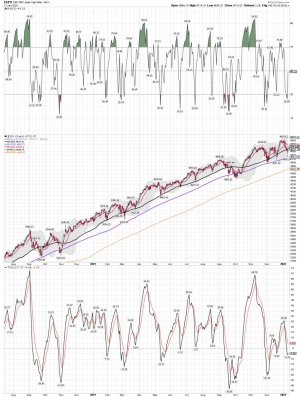
SPY/SPX daily: The LT trend remains in place. Just BTD if the SPY/SPX tags the 50 or 100 sma on the daily chart. Both have worked out well. There were times one had to wait if they bought the 50 sma tag, and probably got a bit scared, as the index moved lower to tag the 100 sma. The BTD pattern continues to work for now as the Fed has been buying around 120ish billion a month. And the BTDer's are trained to buy! I too trade lots of these patterns.... I think we will see a tag of the 200 sma or lower in this quarter. LOL.... that is just a guess.....
 

Attachments

  • a.jpg
    a.jpg
    187.9 KB · Views: 58
  • dogbfrd.png
    dogbfrd.png
    306.4 KB · Views: 62
Hmmmm..... Maybe just a wall of worry? We shall see how 2022 plays out.......

Jesse Felder
@jessefelder

20h
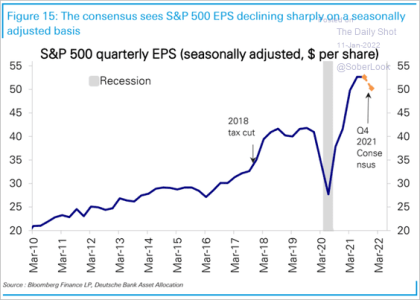
'The consensus sees S&P 500 EPS declining sharply on a seasonally adjusted basis.' https://thedailyshot.com/2022/01/11/why-are-americans-quitting-their-jobs/ via
@SoberLook


David Rosenberg
@EconguyRosie
·
20h
"I was watching former Fed VC Alan Blinder struggle on
@CNBC
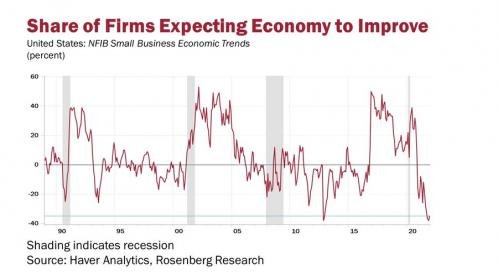
to explain how Treasury yields could have the temerity to stay so low. I wanted to send him this chart. Econ expectations from the small-biz sector are lower today than at the trough of all 5 prior recessions!
https://twitter.com/EconguyRosie?lang=en

Mohamed A. El-Erian Retweeted
Jim Bianco biancoresearch.eth
@biancoresearch
·
13m
One-year ago inflation was 1.4%. Today it is 7%. What Fed forecasts came remotely close to predicting this?

@elerianm
is correct, this is about the biggest forecasting error in the 107-year history of the Fed.

If not, what is?
https://twitter.com/elerianm


thomas
@VolumeDynamics
·
14m
Look, the EVIDENCE IS OVERWHELMING... yesterday's TSA Screening # was the LOWEST SINCE 4/27/21
https://twitter.com/VolumeDynamics
 

Attachments

  • a.png
    a.png
    22.8 KB · Views: 58
  • a.jpg
    a.jpg
    18.7 KB · Views: 60
VXF daily: A nice gap up to start out the day.....

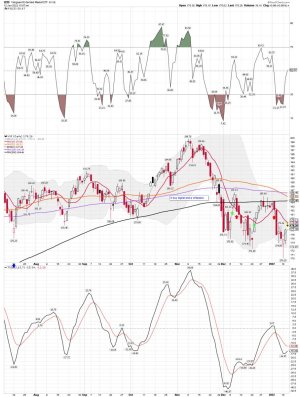
VXF daily: A closer look.... Testing the 10 sma on the daily..... ( resistance for now)
 

Attachments

  • a.jpg
    a.jpg
    159.4 KB · Views: 60
  • a.jpg
    a.jpg
    136.1 KB · Views: 61
More wall of worry:

Jesse Felder
@jessefelder

1h
'A surge in omicron across China and the rest of Asia could trigger "the mother of all supply chain stumbles" this year.'
https://twitter.com/jessefelder

Tom McClellan
@McClellanOsc
·
2h
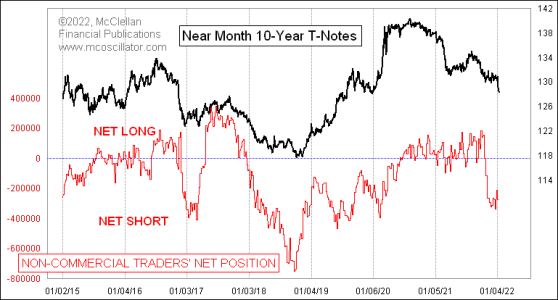
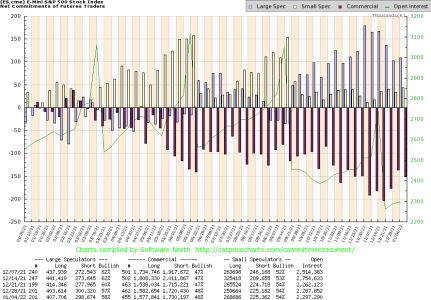
It is not even true to assert that there is anything close to a record speculative short position. The large specs (non-comms) are indeed net short as a group, but not even to half the size we saw at the 2018 low price low. It may still be enough for a bottom, but not a record.
https://twitter.com/McClellanOsc?ref_src=twsrc^google|twcamp^serp|twgr^author


Bob Loukas
@BobLoukas
·
21h
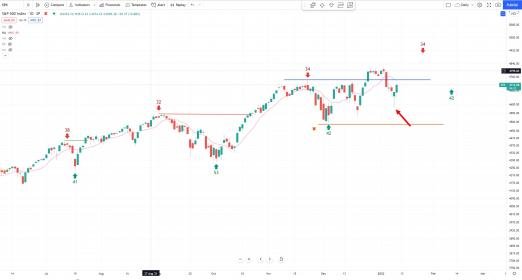
S&P prints a mid-cycle low, as does Bitcoin.

That level should not be lost on the S&P and acts as a good point to manage risk.
https://twitter.com/BobLoukas/status/1481009056777179144/photo/1

SevenSentinels
@SevenSentinels
·
2h
11 AM

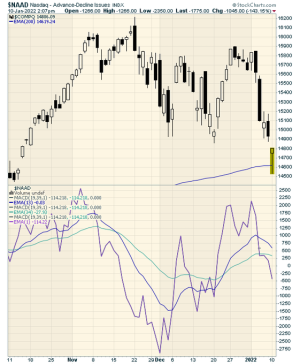
Market Higher On Negative Breadth


True Contrarian
@TrueContrarian
·
30m
Average investors still don't understand the incredible all-time record ratio of insider selling to insider buying for the most-popular tech companies. Whose side do you want to take in a trade, the average investor or the CEO's and other wealthy investors? $QQQ
https://twitter.com/TrueContrarian?ref_src=twsrc^google|twcamp^serp|twgr^author
 

Attachments

  • a.png
    a.png
    11.4 KB · Views: 61
  • a.png
    a.png
    36.3 KB · Views: 62
  • a.jpg
    a.jpg
    12.3 KB · Views: 61
Last edited:
Back
Top