-
The Forum works well on MOBILE devices without an app: Just go to: https://forum.tsptalk.com
-
Please read our AutoTracker policy on the IFT deadline and remaining active. Thanks!
-
$ - Premium Service Content (Info) | AutoTracker Monthly Winners | Is Gmail et al, Blocking Our emails?
Find us on: Facebook & X | Posting Copyrighted Material
-
Join the TSP Talk AutoTracker: How to Get Started | Login | Main AutoTracker Page
You are using an out of date browser. It may not display this or other websites correctly.
You should upgrade or use an alternative browser.
You should upgrade or use an alternative browser.
Bear Cave 2 (Bull Allowed)
- Thread starter robo
- Start date
robo
TSP Legend
- Reaction score
- 471
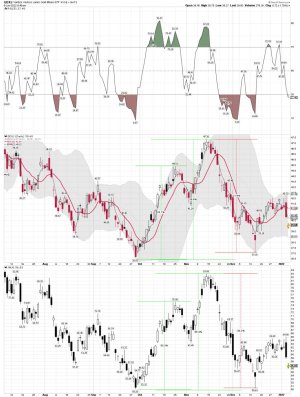
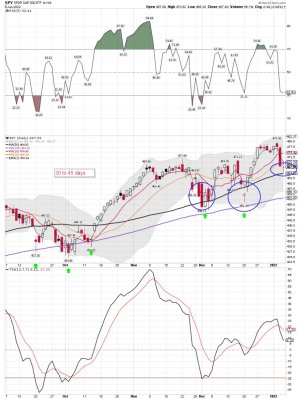
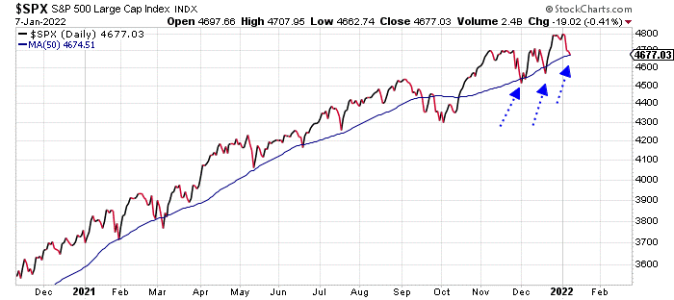
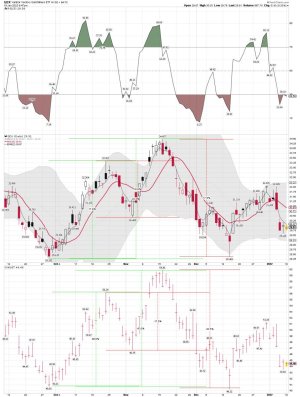
SPY daily: A nice bounce after tagging the 50 sma on the daily. It's clear someone BTD and we shall see how it plays out. The SPY remains below the 3 ema and the 10 sma on the daily.
Stocks Found Support
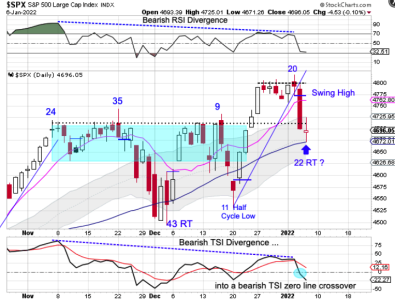
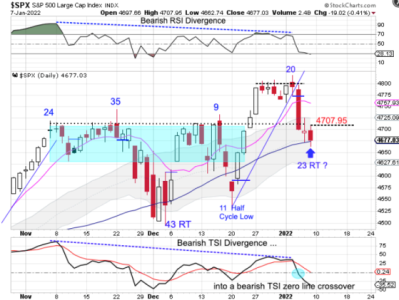
Stocks printed a huge bearish candle on Wednesday, forming a swing high and closing below the 4700 level to signal the daily cycle decline. With stocks overdue for a yearly cycle low this could send stocks to seek out their YCL.
But instead of delivering bearish follow through, stocks found support at the rising 50 day MA on Thursday.
Thursday was only day 22 for the daily cycle, which is too early to expect a DCL to form. While stocks broke below the 38 fib level, they should still turn the 10 day MA before they form their DCL. So any bounce off the 50 day MA should be contained by the 10 day MA so stocks can complete their daily cycle decline.
However, stocks are currently in a daily uptrend. If stocks form a swing low and close back above the 10 day MA then that would indicate a continuation of the daily uptrend and trigger a cycle band buy signal. Under this scenario, we would label day 22 as an early DCL.
https://likesmoneycycletrading.wordpress.com/2022/01/06/stocks-found-support/
Attachments
robo
TSP Legend
- Reaction score
- 471
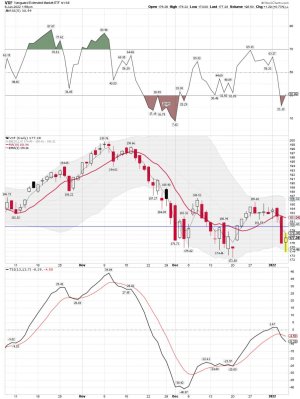
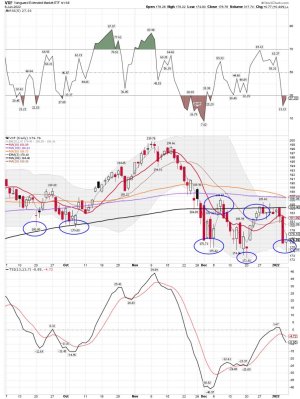
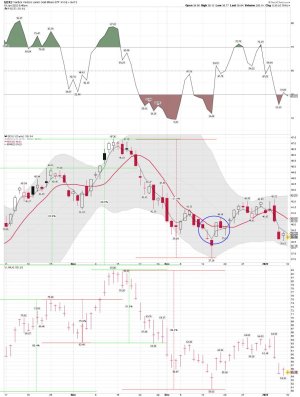
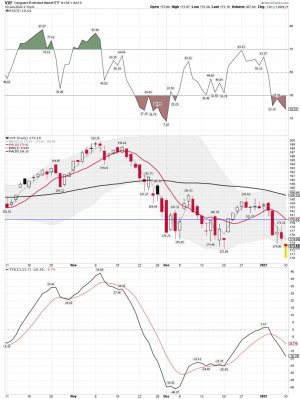
VXF daily: So I agree with the cycle dude above that we got a nice oversold bounce and we could be heading higher. However, VXF remains below the 3 ema, the 10, 20, 50, 100, and the 200 sma. We shall see how the rest of the week plays out. One always has to give the edge to the Bulls going into Free Lunch Friday and Easy Money Monday! The 200 sma remains resistance until it doesn't.
Attachments
robo
TSP Legend
- Reaction score
- 471
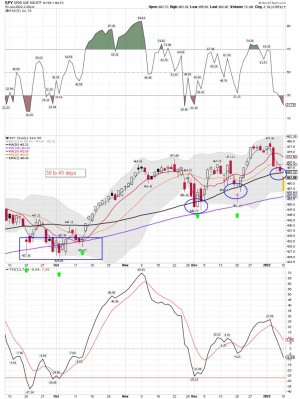
The same goes for the SPY. Is this time different? A bounce off the 50 sma has been a winner in the past!
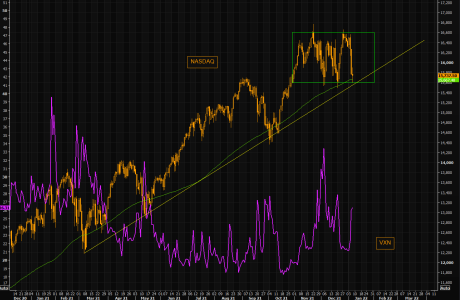
NASDAQ - to dare or not to dare?
NASDAQ has actually done nothing since early September. The index has been stuck in a perfect range since mid Oct. The only thing that has risen is tech volatility, VXN. Price action today is not overly impressive post the carnage yesterday, but note VXN is up as we trade close to the 100 day, the longer term trend line and the lower part of the range. All break out attempts (up as well as down) have been reversed since October. Is this time different?
Attachments
Last edited:
robo
TSP Legend
- Reaction score
- 471
Cycles:
Stocks
Stocks have been consolidating below the 4800 resistance level until Wednesday.
Stocks printed a huge bearish candle on Wednesday to signal the daily cycle decline. Stocks printed their lowest point on Friday, day 23, which is a bit early to expect a DCL. So any bounce off the 50 day MA should be contained by the 10 day MA so stocks can complete their daily cycle decline.
However, stocks are currently in a daily uptrend. If stocks form a swing low and close back above the 10 day MA then that would indicate a continuation of the daily uptrend and trigger a cycle band buy signal. Under this scenario, we would label day 23 as an early DCL.
Attachments
robo
TSP Legend
- Reaction score
- 471
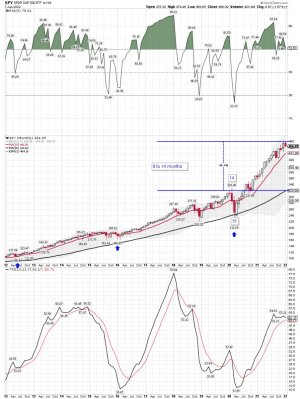
SPY monthly: Remains stretched above the 50 sma on the monthly chart. How much longer can buyers and the Fed keep this run going this far above the 50 sma. Insiders continue to sell shares. Maybe we grind sideways this year and let the 50 sma close the gap. I think we are headed for a YCL in the months ahead. However, that is just a guess and I will trade what is happening not what I think will happen.
I remain flat VTI and VXF at Vanguard.
Long the miners again: GDX and GDXJ
I remain flat VTI and VXF at Vanguard.
Long the miners again: GDX and GDXJ
Attachments
robo
TSP Legend
- Reaction score
- 471
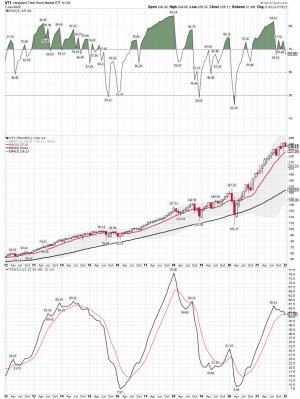
VTI monthly: Remains in an uptrend. When you say the stock market is going up, and you use the SPY chart, that is only 500 stocks. VXF is around 4000ish stocks. It's clear to all of us the market is being pushed higher by the SPY and several big names in that index. I just trade the trend. The C fund continues to lead and that is NOT what you want. As I have said many times before - In my opinion the easy has been made until the next YCL is completed.
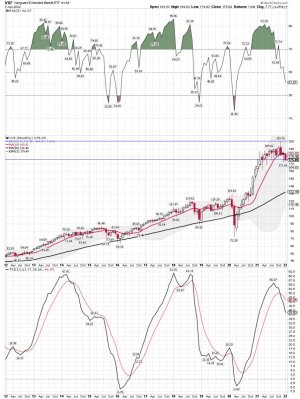
VFX monthly: Remains in a range since the 2021 ATH. It is currently in a downtrend.
VXF: No position
VTI: No position
VFX monthly: Remains in a range since the 2021 ATH. It is currently in a downtrend.
VXF: No position
VTI: No position
Attachments
Last edited:
robo
TSP Legend
- Reaction score
- 471
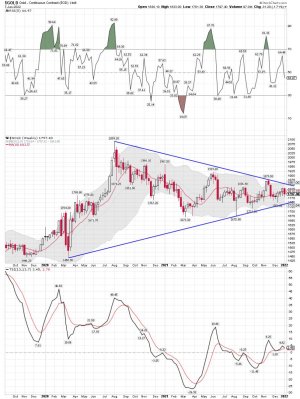
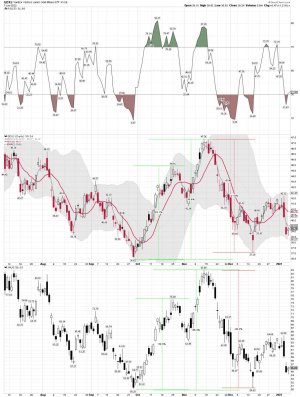
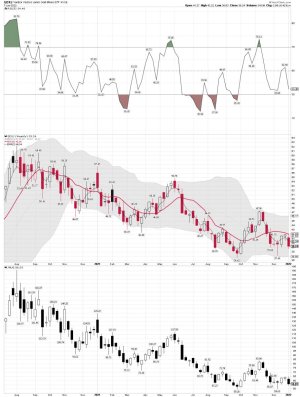
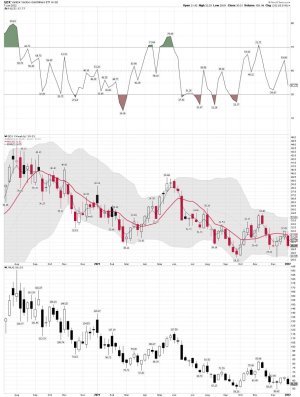
Gold: I have a new position of GDX and GDXJ again. When GDXJ moves below $40.00ish and GDX below $30.00ish I buy. Maybe this time the move up will continue.
Big Gold Breakout Nearing
Adam Hamilton
Archives
Jan 07, 2022
Gold is nearing a major technical breakout from a massive chart formation. This classic pennant is a type of continuation pattern, a long high consolidation which gold climbed into from below. Thus odds heavily favor this tightening pennant resolving to the upside, gold surging above upper resistance. That breakout will work wonders for battered gold sentiment, quickly reversing herd psychology from bearish back to bullish.
Technical analysis, or studying price-chart patterns, is something of a self-fulfilling prophecy. It works a lot of the time simply because enough traders believe it works. When a price breaks out from widely-watched technical lines, traders are quick to pile on to ride that momentum accelerating and amplifying it. Technically-oriented traders are more prevalent in some markets than others, and they utterly infest gold.
The bottom line is a major gold breakout is nearing, with a massive pennant formation converging. Gold climbed into this big continuation pattern from below in powerful uplegs, and has been consolidating high ever since. Prices usually break out of big pennants in the same direction they entered, implying gold's imminent breakout will be to the upside. That will ignite strong gold-futures momentum buying from specs.
The resulting acceleration and amplification of gold's breakout rally will start enticing investors to return, fueling a major upleg. Fed tightening shouldn't matter, as Fed officials talk tough but rarely follow through with all threatened actions. The FOMC surrenders after stock markets fall sufficiently on rate hikes and balance-sheet runoffs. And gold has tended to power strongly higher during past Fed-rate-hike cycles anyway.
Jan 07, Big Gold Breakout Nearing Adam Hamilton 321gold ...inc ...s
Attachments
robo
TSP Legend
- Reaction score
- 471
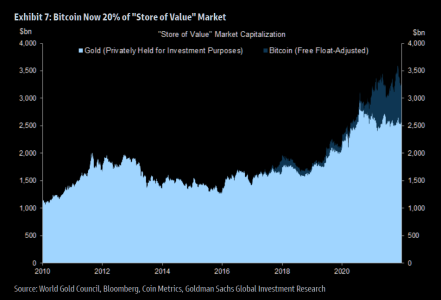
Will this happen? I will leave Bitcoin to others to trade, and I will trade the metals/miners based on the data.
Will Bitcoin take additional market share from gold?
Pretty cool that in Goldman's "top questions in FX for 22", there is one question (the above) on BTC. Going mainstream...The GS answer: "Yes. The World Gold Council estimates that the private sector owns 44,000 metric tonnes of gold for investment purposes (i.e. privately-held bars and ETFs, excluding jewelry, official sector holdings, and industrial uses). At the current market price of $1,800 per troy ounce, this implies that the public owns about $2.6 trillion of gold for investment purposes. By comparison, Bitcoin’s float-adjusted market capitalization is currently just under $700bn. Therefore, Bitcoin currently commands a roughly 20% share of the “store of value” (gold plus Bitcoin) market. We think that Bitcoin’s market share will most likely rise over time as a byproduct of broader adoption of digital assets, and possibly due to Bitcoin-specific scaling solutions (although the network’s consumption of real resources may remain an important obstacle to institutional adoption). Hypothetically, if Bitcoin’s share of the “store of value” market were to rise to 50% over the next five years (with no growth in overall demand for stores of value) its price would increase to just over $100,000, for a compound annualized return of 17-18% (accounting for growth in Bitcoin supply over time). Bitcoin may have applications beyond simply a "store of value"—and digital asset markets are much bigger than Bitcoin—but we think that comparing its market capitalization to gold can help put parameters on plausible outcomes for Bitcoin returns
https://themarketear.com/
Attachments
robo
TSP Legend
- Reaction score
- 471
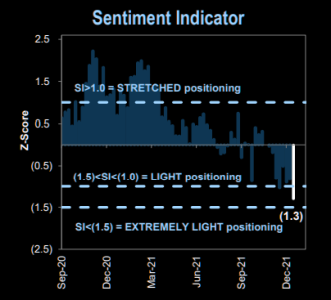
Sentiment indicator screams BUY
The Goldman Sachs "Sentiment Indicator" measures stock positioning across retail, institutional, and foreign investors versus the past 12 months. Readings below -1.0 or above +1.0 indicate extreme positions that are significant in predicting future returns.
https://themarketear.com/
The Goldman Sachs "Sentiment Indicator" measures stock positioning across retail, institutional, and foreign investors versus the past 12 months. Readings below -1.0 or above +1.0 indicate extreme positions that are significant in predicting future returns.
https://themarketear.com/
Attachments
robo
TSP Legend
- Reaction score
- 471
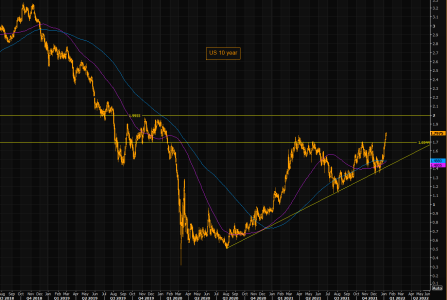
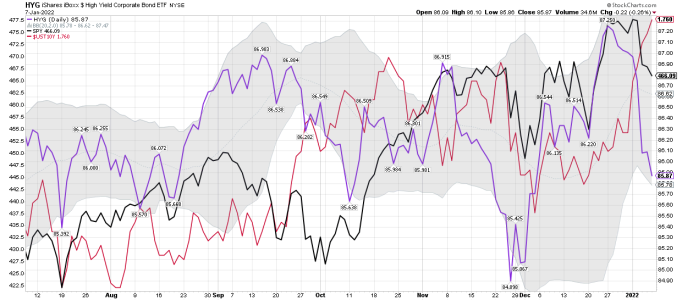
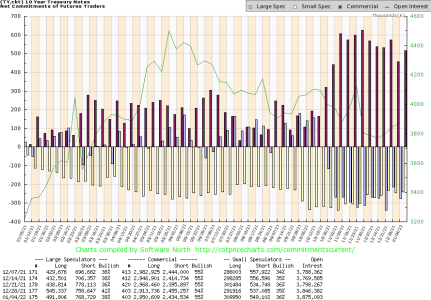
What happens if the 10 year keeps going higher? A look at HYG, SPY and the 10 year. The last chart is the COT and you can see how has been buying the 10 year notes. A fight to safety in my opinion....
10 year : Red line
HYG: Purple line
SPY : Black line
US 10 year - time for the second "golden" cross?
US 10 year is trading at 1.8%, highest levels in a year. A few days before Christmas we traded at 1.37%...so this has been a rather extreme move. 1.8% is a short term resistance level to watch (but there is nothing major to the upside until 2% should we close above the 1.8% level). Note the 100 day crossing the 200 day here. Momentum is strong, but this is getting ahead of itself in the short term at least.
Attachments
Last edited:
robo
TSP Legend
- Reaction score
- 471
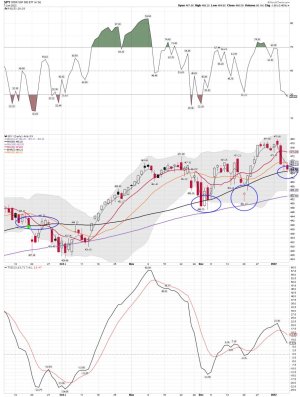
Ok Jeff! It does look like we should bounce after tagging the 50 sma on the daily. Well, that is what it normally does. However, there were a few times the last few months we tagged the 100 sma. See my chart and the 100 sma line on the daily. It's the purple line. Since my magic 8 ball is broken I will be watching the show. As always, I say we shall see...... One could trade the 50 sma tag with a stop, and I do that often......
SPY daily: It needs to get back above the 3 ema and the 10 sma on the daily. One would have to give the edge to the Bulls/Buyers. So maybe will NOT move down into a YCL just yet.
Flat VTI and VXF.
This Week Looks Bullish for the Market
Jeff Clark | Jan 10, 2022 | Market Minute | 3 min read
The talking heads are all bearish again.
That means the stock market is likely headed higher this week.
Of course, it’s tough to be bullish on stocks right here – especially considering the drubbing most stocks took last week. The S&P 500 lost nearly 2%, the Russell 2000 dropped almost 3%, and the technology-heavy Nasdaq Composite Index got slammed by 4.5%.
It was an ugly way to start the year. And, that ugliness caused a lot of stock market bulls to rush over to the bear camp…
No matter what financial television station you turned to on Friday, the talking heads were bearish. Many of them predicted that last week’s selloff was the start of a 7% to 15% correction in the stock market.
Maybe that’s true… Heaven knows the major stock indexes have been running hotter and higher for so long that we’re overdue for a meaningful pullback.
But, whenever so many analysts get so bearish so quickly, it almost always leads to a sharp, oversold bounce. And, that’s what I expect we’ll see this week.
Take a look at this chart of the S&P 500…
https://www.jeffclarktrader.com/market-minute/this-week-looks-bullish-for-the-market/
Attachments
robo
TSP Legend
- Reaction score
- 471
I'm long the miners again with some open limit orders if we move lower. I buy the miners based on my data ONLY:
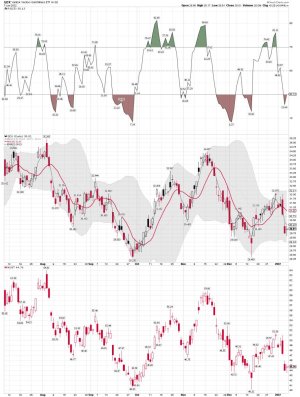
GDX and GDXJ daily charts. Both are below the 3 ema and the 10 sma on my daily chart. So they remain on a sell signal, but I like to buy low and sell high. Not buy high and sell higher.
A Reason To Buy GDX, Commodities And The S&P 500
Jan. 10, 2022 7:40 AM ETVanEck Vectors Gold Miners ETF (GDX)Summary
Numbers can tell a story.
https://seekingalpha.com/article/44...urce=seeking_alpha&utm_term=RTA+Article+Smart
The S&P 500 index and a composite of twenty-nine commodities made virtually the same percentage gains in 2021.
Inflation remains a rising factor in 2022.
Gold is a historical inflation barometer- A new high in 2020 and inside year in 2021.
Go for the gold in 2022 with the GDX that magnifies moves on a percentage basis without time decay.
Looking for more investing ideas like this one? Get them exclusively at Hecht Commodity Report. Learn More »
Attachments
robo
TSP Legend
- Reaction score
- 471
SPY daily: A very nice bounce after getting close to tagging the 100 sma on the daily chart. It too remains below the 3 ema the 10 sma and the 50 sma on the daily. Start of a new uptrend? Possible! But first it needs to close back above the 50 sma on the daily. Odds favor the Bulls/Buyers for now. I will pass as I'm mainly trading the gold miners right now. These moves are good for ST trading, but not very good for TSP moves unless you just like to trade the MT patterns. In that case, getting close to or tagging the 100 sma has been a winner in the past. One still can not rule out a YCL is coming our way in the weeks ahead.
Attachments
Last edited:
robo
TSP Legend
- Reaction score
- 471
It sure is..... We shall see how much bounce we get. I DO NOT trade this sector.
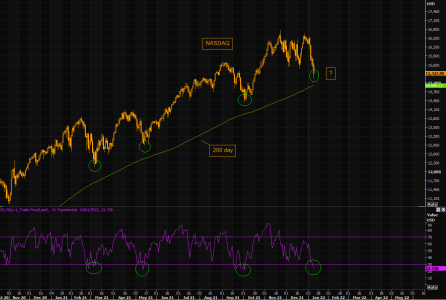
NASDAQ - very very oversold
Yes, oversold can stay oversold for a long time, but so many have already been flushed out and all we hear is bearish narratives. Note how NASDAQ traded on previous occasions when it got "very very" oversold. We have seen a lot of downside pain. Is upside the next short term pain?
https://themarketear.com/

