Bear Cave 2 (Bull Allowed)

Attachments

  • a.jpg
    a.jpg
    149.9 KB · Views: 78
  • a.jpg
    a.jpg
    146.3 KB · Views: 77
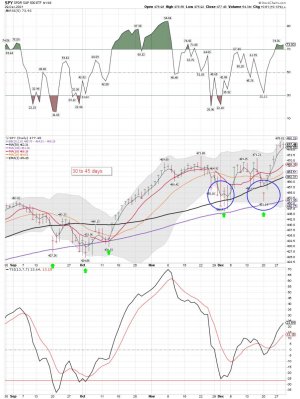
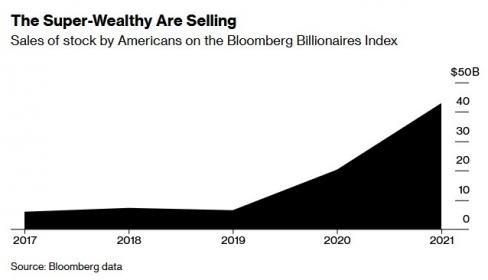
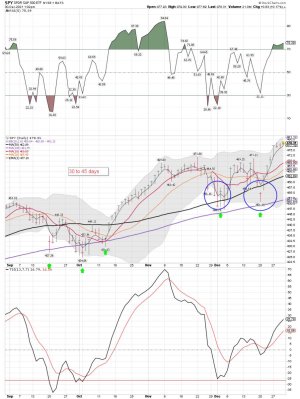
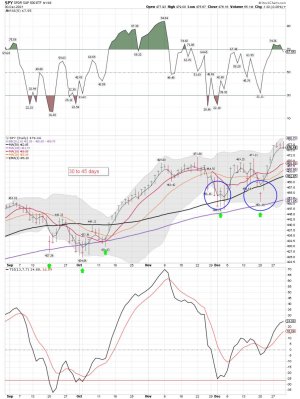
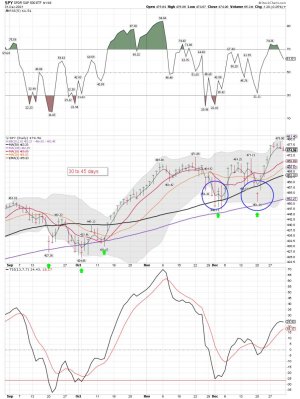
SPY daily: The insiders continue to sell, but that doesn't mean this run is over. They insiders have been selling all this year.....

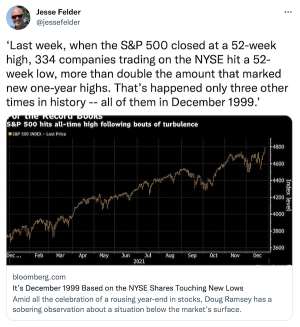
Jesse Felder
@jessefelder

4h
"A lot of our clients are selling. Founders and venture capitalists are deciding they want to diversify concentrated positions, or they’re looking at the market and saying, ‘We’re at the top of the market.’" https://bloomberg.com/news/articles...u-s-billionaires-selling-shares?sref=qpbhckVU
 

Attachments

  • a.jpg
    a.jpg
    13 KB · Views: 54
  • a.jpg
    a.jpg
    145.5 KB · Views: 56
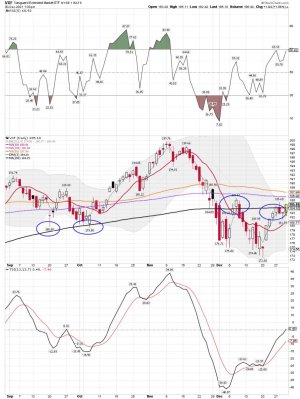
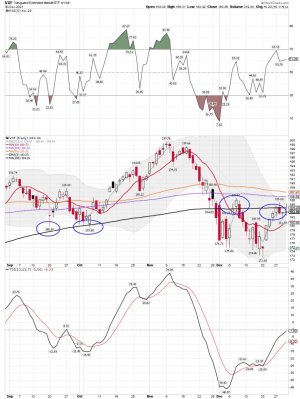
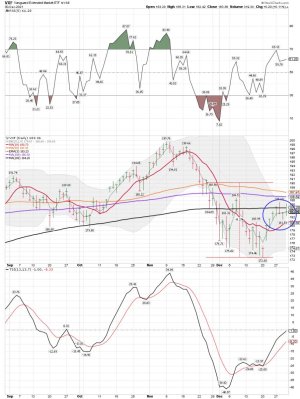
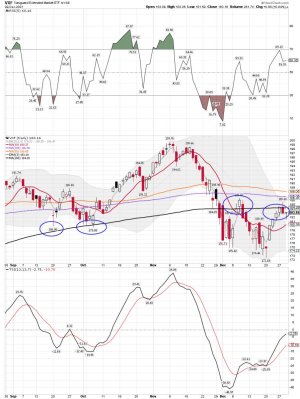
VXF daily: A move above the 200 sma on the daily chart this morning. We shall see how it closes and the 100 sma be up next
 

Attachments

  • a.jpg
    a.jpg
    148.5 KB · Views: 57
VXF daily: For now the 200 sma on the daily remains resistance..... We shall see if enough buyers come in to close it above the 200 sma tomorrow. As you can see there was a tad to much selling during the last hour of trading for VXF to close above the 200 sma on the daily chart.
 

Attachments

  • a.jpg
    a.jpg
    148 KB · Views: 47
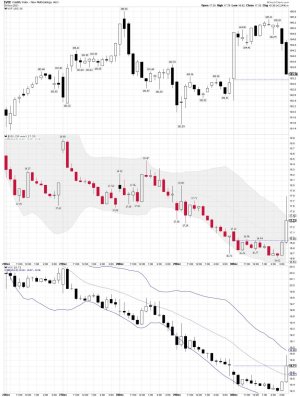
VXF 30 minute chart: As pointed out above the last hour of trading for VXF can be seen much clearer on this 30 minute chart. Other indexes sold off too, but I have been tracking the VXF/S Fund lately. I like to see this index leading, but it has been in trouble for months now. Where is the BEEF, and be careful as the VIX continues to get compressed.
 

Attachments

  • a.jpg
    a.jpg
    142.4 KB · Views: 49
SPY daily: Still NO SELL signal, but a warning from the 3 ema......

For the record: I'm currently flat VTI and VXF at Vanguard and I bought a small position of VXX. I trade VXF and VTI at Vanguard.

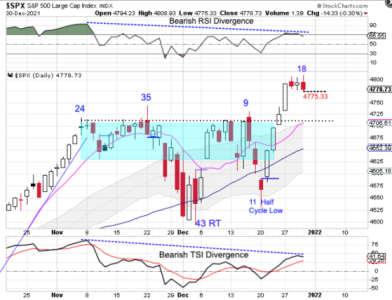
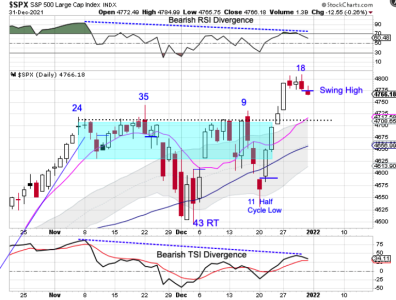
Bearish Divergence
by likesmoneystudies

Stocks became stretched above the 10 day MA on Monday. They have since been consolidating which is helping to allow the 10 day MA catch up to price.

While stocks are at all-time highs, there are bearish divergences developing on the oscillators, which often herald a cycle decline. If stocks form a swing high and close back below the breakout level that will signal the daily cycle decline. And if this breakout fails I think that will also trigger the intermediate and yearly cycle declines, which I plan to further discuss in the Weekend Report.

https://likesmoneycycletrading.wordpress.com/author/likesmoneystudies/
 

Attachments

  • a.png
    a.png
    117.5 KB · Views: 55
  • a.jpg
    a.jpg
    145.1 KB · Views: 55
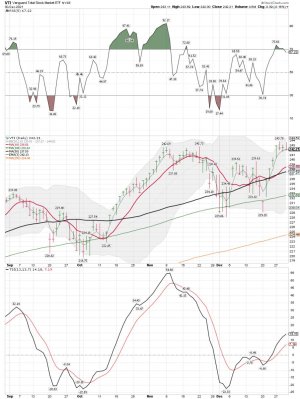
VTI daily: A look at VTI and as you can see on the chart there is still NO SELL for my trend trading system. VTI remains above the 3ma and the 10 sma on the daily chart. However, VXF remaining below its 200 sma on the daily chart and that is a concern. VXF is currently around 3669 small and midcap stocks and as I pointed out this is not the type of pattern you want to see this late in the yearly cycle.

VXF data at Vanguard:

Characteristics
as of 11/30/2021

Number of stocks
3669

Fund total net assets
$109.6 billion

Net assets of 10 largest holdings
7.9%

Foreign holdings
0.1%

Product summary
Seeks to track the performance of a benchmark index that measures the investment return of stocks from small and midsize companies.
Provides a convenient way to match the performance of virtually all regularly traded U.S. stocks except those in the S&P 500 Index.
Passively managed, using index sampling techniques.
https://investor.vanguard.com/etf/profile/VXF

VTI data at Vanguard:
Characteristics
as of 11/30/2021

Number of stocks
4156

Fund total net assets
$1.3 trillion

Net assets of 10 largest holdings
26.0%

Foreign holdings
https://investor.vanguard.com/etf/profile/VTI
 

Attachments

  • a.jpg
    a.jpg
    141.3 KB · Views: 60
  • a.jpg
    a.jpg
    144.9 KB · Views: 61
Last edited:
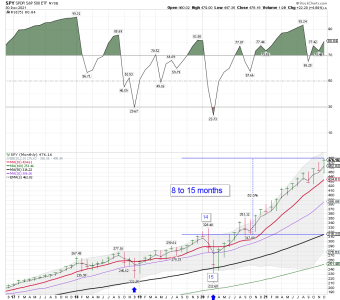
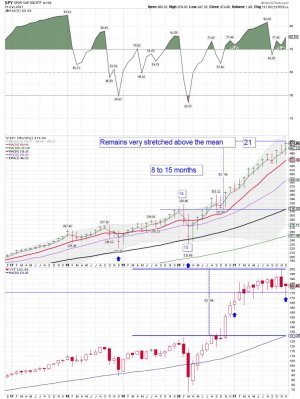
SPY monthly: If you invest using the monthly the last buy signal was 20 months ago and the SPY has remained in an uptrend for 20 months now. I think it is safe to say the easy money has been made! Most months it trended above the 3 ema nicely. The 3 ema is only a warning for me "IF" the trend/price moves below that dashed line. Keep in mind I'm trading the daily and only point out the longer term trends as we get deeper into the yearly cycle........ Note how stretched we remain above the mean. I use the 50 sma on the monthly chart for the mean and others might use the 40 sma. That is close to using the 200 sma on the daily.....

Like I have pointed out before, I'm trading the daily cycles most of the time.

Bottom Line: Not a time to chase moves with a 100% of your money. With that said, the trend remains up and those that take the biggest risks will get the biggest rewards.... IF THEY ARE CORRECT! I use Risk Management on all of my trades. I'm close to 70 and keep my trades much smaller these days.
 

Attachments

  • a.png
    a.png
    43.6 KB · Views: 61
Last edited:
SPY monthly: If you invest using the monthly the last buy signal was 20 months ago and the SPY has remained in an uptrend for 20 months now. I think it is safe to say the easy money has been made! Most months it trended above the 3 ema nicely. The 3 ema is only a warning for me "IF" the trend/price moves below that dashed line. Keep in mind I'm trading the daily and only point out the longer term trends as we get deeper into the yearly cycle........ Note how stretched we remain above the mean. I use the 50 sma on the monthly chart for the mean and others might use the 40 sma. That is close to using the 200 sma on the daily.....

Like I have pointed out before, I'm trading the daily cycles most of the time.

Bottom Line: Not a time to chase moves with a 100% of your money. With that said, the trend remains up and those that take the biggest risks will get the biggest rewards.... IF THEY ARE CORRECT! I use Risk Management on all of my trades. I'm close to 70 and keep my trades much smaller these days.

Thank you so much for your charts, I have certainly learned a lot from you.
 
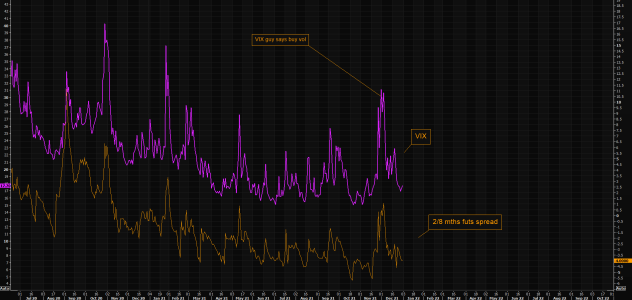
Believe it or not - the VIX guy just called us again
We didn't expect the VIX guy to call us only a month after his latest call. Recall what we wrote on Nov 30 (here): "We have been waiting for the panic call from our VIX guy. Earlier today he called us and we haven't heard him in such a panic mode in a long time. His latest logic is based around the vaccine news from Moderna, the recent VIX spike "can't you see the stress bro?" and that people had a great year and will sell etc. His main idea was to buy VIX here. Needless to say we are starting to sell volatility here. One way to play it is via put spreads in VIX. After all, volatility is mean reverting and our VIX guy has continued holding the perfect 100% inverse track record. Will he nail it again?"

Since then we have seen the VIX crash. If you played the logic from above you have some nice profits to book (overdue). Anyway, his latest logic is basically the inverse of what he said in late November. He has also managed picking up the January effect logic and argues for this market to remain trending higher with diminishing volatility. We did not plan to get excited on the last day of the year, but given his perfect track record, executing the first part of the planned long volatility trade suddenly seems like a good idea. For the dynamic hedging mind, why not look at replacing longs with upside calls and/or exploring put spreads as a hedge (skew is high).
https://themarketear.com/


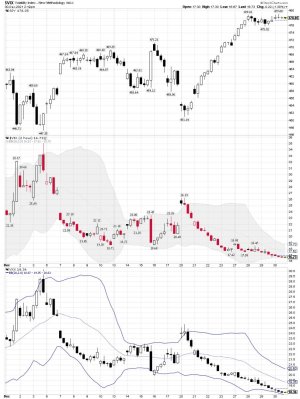
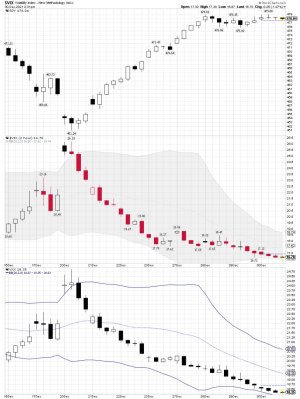
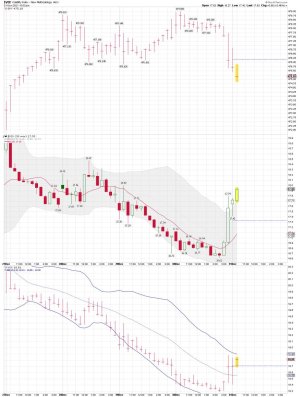
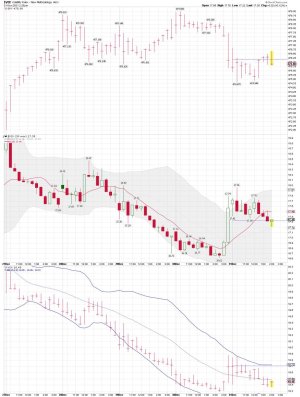
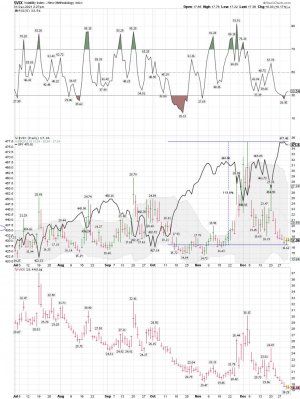
VIX 30 minute chart: I'm only Short term trading going into the new year. We shall see if more sellers then buyers show up today. I remain flat, but have a small position of VXX.

VIX daily chart:

https://stockcharts.com/h-sc/ui?s=$VIX&p=30&yr=0&mn=0&dy=5&id=p04421820238&a=1049530610
 

Attachments

  • a.jpg
    a.jpg
    139.3 KB · Views: 66
  • a.png
    a.png
    62.5 KB · Views: 67
Last edited:
VIX daily: The VIX smashers are working hard to keep the VIX compressed. We shall see if we get a spike at the close again today.....

VIX 30 minute:
 

Attachments

  • a.jpg
    a.jpg
    142.2 KB · Views: 63
  • a.jpg
    a.jpg
    156.7 KB · Views: 62
Hmmmm.....

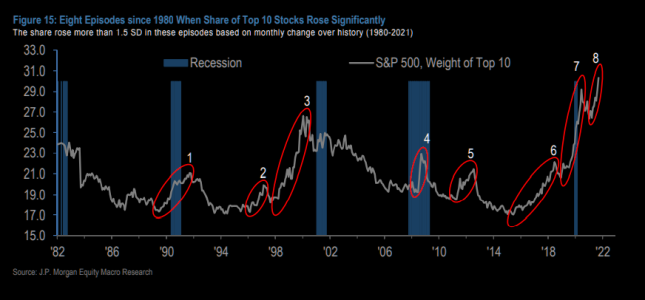
The bull in the top 10 shares...and what happened after

Interesting chart by JPM on how markets have performed when the top 10 shares rose significantly. Current bull has been going on for some time. This chart has a lot of implications for overall allocations and hedging. Imagine some of the big ones start to reverse?
https://themarketear.com/
 

Attachments

  • a.png
    a.png
    75.9 KB · Views: 71
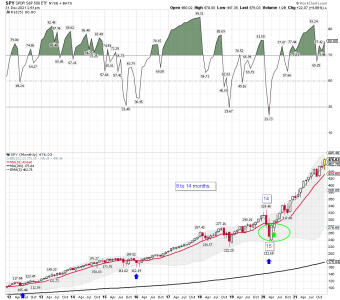
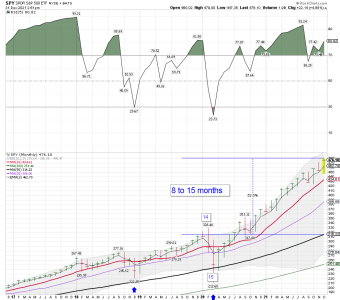
At some point we WILL move into a yearly cycle low. How far it will move below the 10 month sma is STBD, but we remain very stretched above the mean. I use the 50 sma on the month chart for the mean. As you can see this will snap back some at some point, and we are deep into the current cycle.

I will post a few monthly charts below to look over and note how deep we are into this cycle, and how stretched we are above the mean's for these indexes.

I still think the easy money has been made, and in my opinion one "SHOULD NOT be making all in moves one taking early positions in 2022.... Time to see how things place out this deep into a yearly cycle and this stretched above the mean.

A comment from Kaplan:

The primary significance of recent all-time highs for large-cap U.S. indices is its message about when the U.S. equity bear market is most likely to end with a crushing bottoming pattern and frequent downward spikes.


Nearly all bear markets end with repeated downward spikes as panic waves sweep among Bogleheads and others who classically sell near the exact nadirs of bottoming patterns. With all-time highs near the end of December and/or perhaps in early January 2022, the end of the bear market will likely occur near the end of 2023 for some assets and in 2024 for many others. Securities which typically bottom early in the cycle, such as gold mining and silver mining shares and many emerging-market securities, have probably already completed their lowest points of the decade. These undervalued assets will keep experiencing corrections, some of them sharp, but they will likely make mostly higher lows for the next decade or so rather than the lower highs which large-cap U.S. shares will mostly do until around 2024. The biggest percentage losses going forward will tend to be concentrated in those assets which have the highest multiples to their respective fair-value levels. This includes the most-hyped and most-loved stocks, high-yield corporate bonds, real estate, and especially cryptocurrencies. I would be surprised if any cryptocurrencies can avoid dropping less than 95% from top to bottom.
https://truecontrarian-sjk.blogspot.com/
 

Attachments

  • a.png
    a.png
    50 KB · Views: 68
  • a.png
    a.png
    43.5 KB · Views: 68
Last edited:
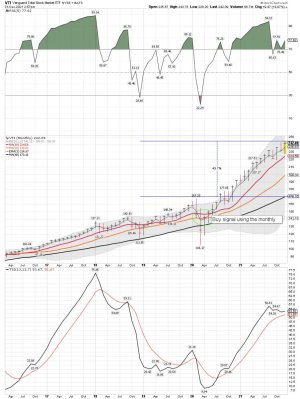
VTI monthly: The total stock market, and one I like to trade. I DO NOT know what will happen next. I'm just pointing out some Risk/Reward indicators one should look over before making you next 100% all in move.

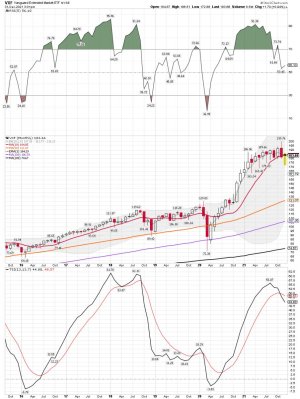
VXF monthly: VXF is close to the S Fund

.
 

Attachments

  • a.jpg
    a.jpg
    143 KB · Views: 73
  • a.jpg
    a.jpg
    151.3 KB · Views: 72
SPY daily: A close below the 3 ema on the daily chart Friday is warning indicator for me. We shall see how we start out the new year. One would think a gap up!


The first domino fell on Friday.

After consolidating below resistance for 2 months, stocks broke out convincingly above the resistance level on Monday. Stocks became stretched above the 10 day MA on Monday and started to consolidate, which will help to allow the 10 day MA catch up to price. However, stocks formed a swing high on Friday. If stocks deliver bearish follow through and close below the resistance level that will signal the daily cycle decline. And may set the ‘dominos’ in motion to lead to the intermediate and yearly cycle declines. I discuss this in the Weekend Report.

https://likesmoneycycletrading.wordpress.com/2022/01/01/the-first-domino-3/
 

Attachments

  • a.png
    a.png
    132.1 KB · Views: 73
  • a.jpg
    a.jpg
    146.3 KB · Views: 74
Back
Top