-
The Forum works well on MOBILE devices without an app: Just go to: https://forum.tsptalk.com
-
Please read our AutoTracker policy on the IFT deadline and remaining active. Thanks!
-
$ - Premium Service Content (Info) | AutoTracker Monthly Winners | Is Gmail et al, Blocking Our emails?
Find us on: Facebook & X | Posting Copyrighted Material
-
Join the TSP Talk AutoTracker: How to Get Started | Login | Main AutoTracker Page
You are using an out of date browser. It may not display this or other websites correctly.
You should upgrade or use an alternative browser.
You should upgrade or use an alternative browser.
Bear Cave 2 (Bull Allowed)
- Thread starter robo
- Start date
robo
TSP Legend
- Reaction score
- 471
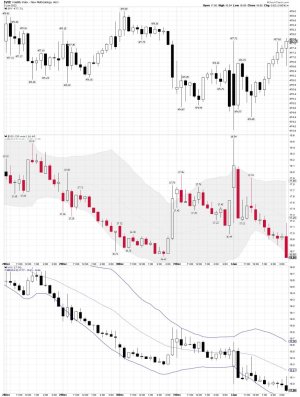
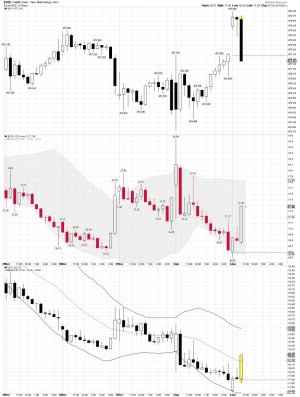
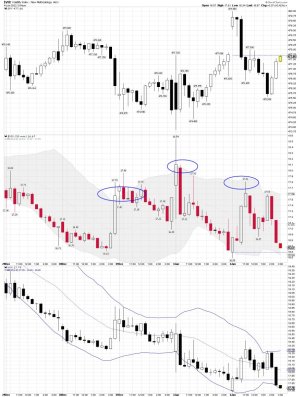
VIX 30 minute:
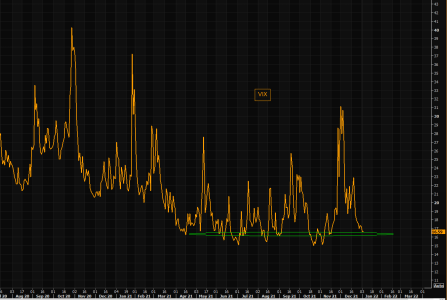
VIX daily:
VIX - getting there
VIX has crashed since the early December panic. VIX is approaching the "new" natural floor level at these levels. Expecting much lower VIX from here is probably a very late trade. Ask yourself: how much downside vs upside is there in VIX from here and then assign some probabilities. Regular readers of TME are familiar with our overall view on volatility and protection: "buy it when you can, not when you must".
https://themarketear.com/
Attachments
robo
TSP Legend
- Reaction score
- 471
Ring In Value, Wring Out Growth
Jan. 03, 2022 11:20 AM
Steven Jon Kaplan
Summary
Successful investing in 2022 requires identifying similar past historical parallels rather than assuming that 2022 will be like 2021.
Insiders and billionaires have never sold more of their assets than they had done in 2021.
Value shares have never been more underpriced in both absolute and relative terms. At the same time, U.S. large-cap growth shares by most benchmarks have never been more overpriced than they were in recent months.
2021 saw all-time record speculative call buying relative to put buying, and for several months more people sold puts to "generate income" than bought puts as a hedge against a market decline.
Insiders and billionaires have never sold more of their assets than they had done in 2021.
Both top corporate insiders and billionaires made all-time record sales and exhibited the highest-ever ratios of insider selling to insider buying in their entire history. It isn't likely that this is a coincidence. Some top insiders also sold real estate aggressively as they hadn't done since 2005-2006, with Elon Musk doing both on a grand scale with the heaviest-ever selling of any single company's stock in world history along with unloading all of his houses including his primary residence. You can believe that Musk only sold shares because Twitter fans made him do it, and that he only sold his houses because he's a simple guy who prefers fewer possessions. You might also want to believe in the tooth fairy.
https://seekingalpha.com/article/44...urce=seeking_alpha&utm_term=RTA+Article+Smart
robo
TSP Legend
- Reaction score
- 471
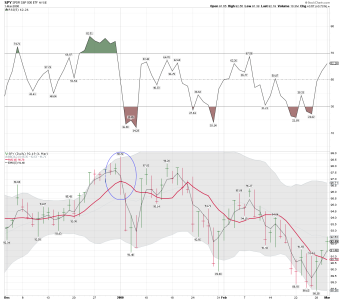
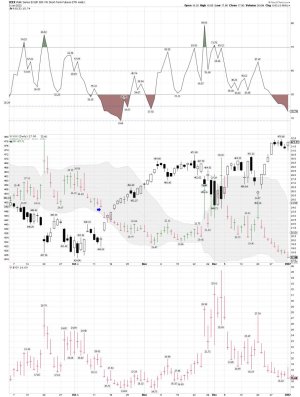
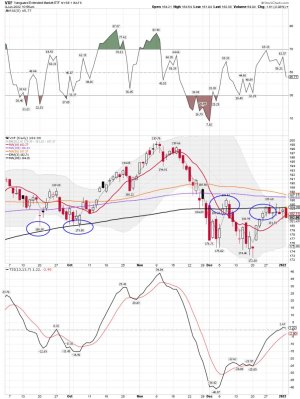
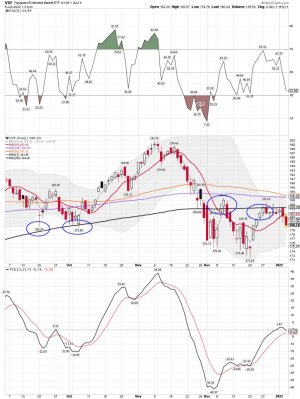
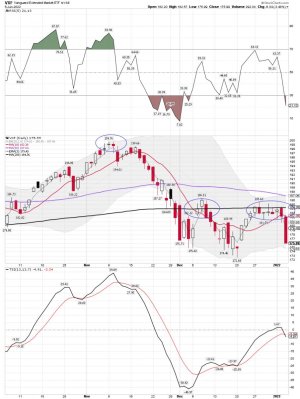
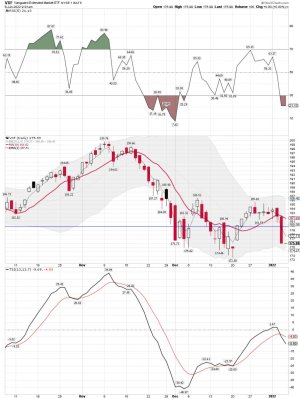
VXF daily: Still trying to get above the 50 sma on the daily.
I currently have NO position in VXF or VTI. The two I trade at Vanguard.
Both VTI and VXF are on hold long positions after the buy signal. But as I pointed out before, the risk/reward levels are to high for me.
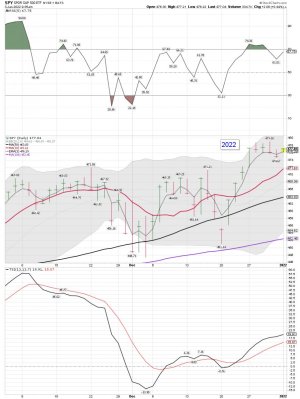
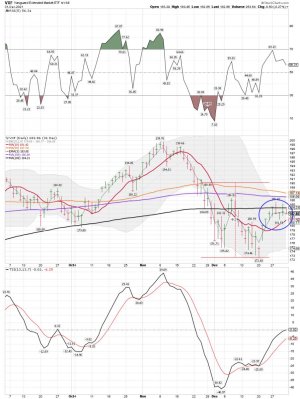
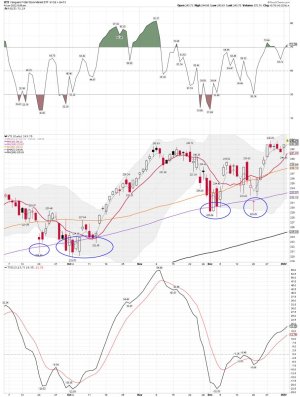
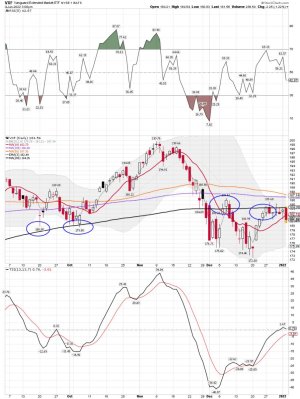
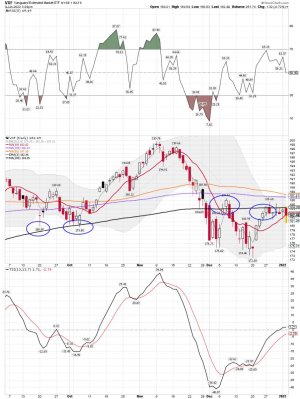
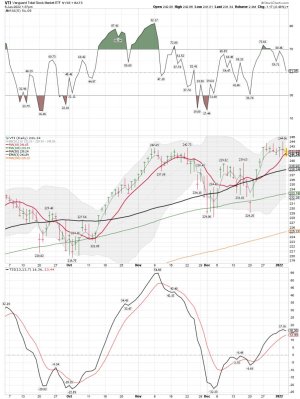
VTI daily: Remains in a hold long position.... Today a gap up and a new ATH for VTI. It's Day 11 since tagging the 100 sma on the daily and producing a buy signal shortly after. A buy signal is generated after moving back above the 3 ema and the 10 sma on the daily chart. I sometimes buy/trade using only the 3 ema, but the 10 sma is used for confirming the signal. Sell signals are the reverse. I'm trying to catch the part of the trend. My system is NOT for everyone, but it takes the guessing out of when to buy or sell the indexes I'm trading. It is easy to back test my system, and yes I get whipsawed. NOTHING is 100% when trading.
VXF daily: Remains in a hold long position... Still having trouble closing above the 50 sma on the daily chart.
Attachments
Last edited:
robo
TSP Legend
- Reaction score
- 471
VXF daily: Moving back below the 3 ema and the 10 sma on the daily chart. Not what longs want to see. We shall see how we close today.
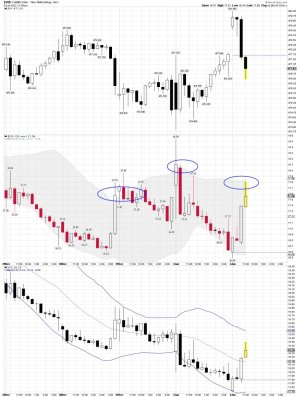
VIX 30 minute chart: We shall see if the tag of the upper BB brings in the VIX smashers.
VIX 30 minute chart: We shall see if the tag of the upper BB brings in the VIX smashers.
Attachments
robo
TSP Legend
- Reaction score
- 471
A few tweets - So far the Fed's are winning..... How many months as someone you follow been calling for a top? There are signs/data that keep me on the sidelines.
thomas
@VolumeDynamics
2h
F'eds - These Mother Smuckers sure are Fug about this market, they just think if they buy the banks and CRUSH the $VIX they can control it... we'll see about that.
thomas
@VolumeDynamics
3h
Frog was having hot tub dreams this morning until he woke up and realized... he's what's for dinner...
https://twitter.com/i/status/1478396244468850702
Jesse Felder
@jessefelder
3h
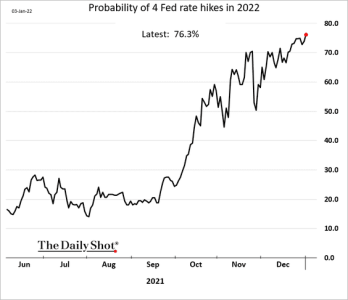
'Could the Fed boost rates by a full percentage point in 2022? There is a 76% chance of such an outcome, according to fed fund futures.' https://thedailyshot.com/2022/01/04/three-fed-rate-hikes-now-fully-priced-in-for-2022/ via
@SoberLook
David Rosenberg
@EconguyRosie
·
Dec 31, 2021
I hate to be a downer before we break out the bubbly, but beneath the veneer, the average Dow and S&P 500 stock is down 10% from the 52-week high. Divergences abound. Sometimes you just have to scratch the surface to see what is really going on.
True Contrarian
@TrueContrarian
·
22h
From my post: It is human nature to assume that the recent past will continue into the indefinite future. However, successful investing in 2022 requires identifying similar past historic parallels rather than assuming that 2022 will be like 2021. https://truecontrarian-sjk.blogspot.com/2022/01/an-intelligent-investor-gets.html
thomas
@VolumeDynamics
2h
F'eds - These Mother Smuckers sure are Fug about this market, they just think if they buy the banks and CRUSH the $VIX they can control it... we'll see about that.
thomas
@VolumeDynamics
3h
Frog was having hot tub dreams this morning until he woke up and realized... he's what's for dinner...
https://twitter.com/i/status/1478396244468850702
Jesse Felder
@jessefelder
3h
'Could the Fed boost rates by a full percentage point in 2022? There is a 76% chance of such an outcome, according to fed fund futures.' https://thedailyshot.com/2022/01/04/three-fed-rate-hikes-now-fully-priced-in-for-2022/ via
@SoberLook
David Rosenberg
@EconguyRosie
·
Dec 31, 2021
I hate to be a downer before we break out the bubbly, but beneath the veneer, the average Dow and S&P 500 stock is down 10% from the 52-week high. Divergences abound. Sometimes you just have to scratch the surface to see what is really going on.
True Contrarian
@TrueContrarian
·
22h
From my post: It is human nature to assume that the recent past will continue into the indefinite future. However, successful investing in 2022 requires identifying similar past historic parallels rather than assuming that 2022 will be like 2021. https://truecontrarian-sjk.blogspot.com/2022/01/an-intelligent-investor-gets.html
Attachments
robo
TSP Legend
- Reaction score
- 471
VXF daily: Heading into the last hour of trading and buyers are starting to come in. We shall see if the bulls can paint a better picture before the close. Currently VXF remains below the 3 ema and the 10 sma on the daily. It matters to me, and I don't really follow others for making/taking trading signals.
VIX 30 minute: The smashers are at work, and the SPY is moving back up.....
VIX 30 minute: The smashers are at work, and the SPY is moving back up.....
Attachments
robo
TSP Legend
- Reaction score
- 471
Hmmmm..... I wonder who be selling? VXF be moving up and is getting ready to test the 10 sma again. A close back above the 10 sma would be a win for the Bulls today. I use the 10 sma as do the cycle guys I track. It looks like another close below the 50 sma for today.
SevenSentinels
@SevenSentinels
·
1h
2 PM
Distribution Intensifies Under Cover Of a +200 DJIA
SevenSentinels
@SevenSentinels
·
1h
2 PM
Distribution Intensifies Under Cover Of a +200 DJIA
Attachments
Mitchcap09
First Allocation
- Reaction score
- 0
Interesting tweets. Focus continues to be on monetary policy and risk assets have been and continue to deflate. Valuations still have not become reasonable as some growth stocks are trading as high as 30-40x revenues. End of QE will bring the carnage which means indices will be the last to go. Looking at a correction here folks. More pain ahead unless the Feds stop QE.
robo
TSP Legend
- Reaction score
- 471
Interesting tweets. Focus continues to be on monetary policy and risk assets have been and continue to deflate. Valuations still have not become reasonable as some growth stocks are trading as high as 30-40x revenues. End of QE will bring the carnage which means indices will be the last to go. Looking at a correction here folks. More pain ahead unless the Feds stop QE.
I agree and the insiders continue to sell too.
VXF daily: Moved to a sell signal..... We shall see how we close today....
VXF has moved below the 3 ema and the 10 sma on the daily chart. It also remains below the 50, 100, and 200 sma which many investors use for taking positions.
VTI daily: moved below the 3 ema and the 10 sma..... We shall see how we close and if buyers come in....
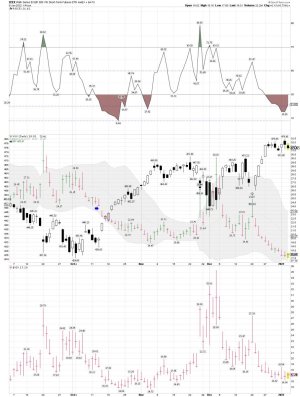
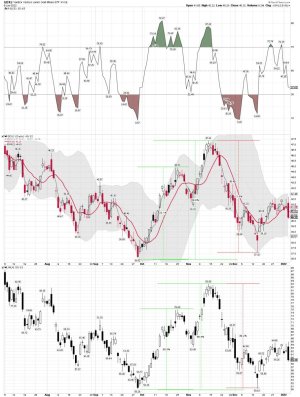
VXX/VIX and the SPY daily:
Attachments
robo
TSP Legend
- Reaction score
- 471
SevenSentinels
@SevenSentinels
2h
11 AM
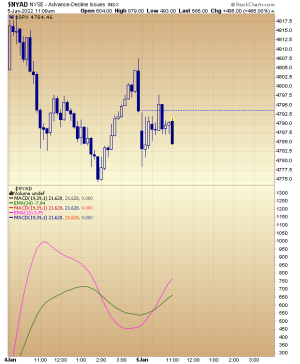
DJIA Higher, Broader Markets Lower On Negative Breadth
thomas
@VolumeDynamics
45m
We have a VERY SPLIT MARKET - $DJIA, The BANKS vs $NASDAQ $NDX
Only one of these is correct.
We'll know soon.
https://twitter.com/VolumeDynamics
Jesse Felder
@jessefelder
·
2h
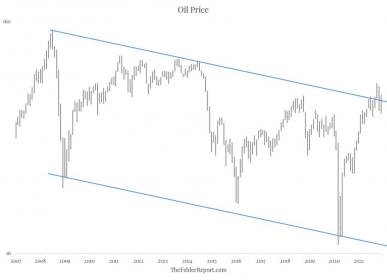
NEW POST: The Market Is Sending A ‘Loud, Clear Signal’ That Oil Prices Are Headed Higher https://thefelderreport.com/2022/01...ear-signal-that-oil-prices-are-headed-higher/
David Rosenberg
@EconguyRosie
3h
Somehow people don't want to go back to work; they want to retire and live off their 401(k)s; and apparently we have hit an epic supply wall on labor... and yet, 807k jobs miraculously were created in December!
https://twitter.com/EconguyRosie?lang=en
Mohamed A. El-Erian
@elerianm
·
8h
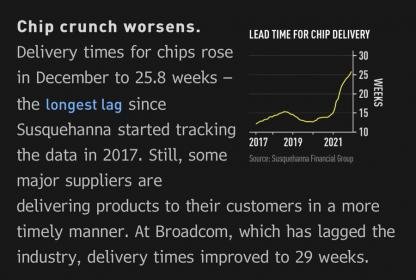
From Bloomberg. Confirms that certain long-standing supply disruptions are still here. Similarly for labor market issues.And all this before we factor in a new round of #omicron-related dislocations. Bottom line:The supply side remains the main driver of several economic outcomes.
https://twitter.com/elerianm
Attachments
robo
TSP Legend
- Reaction score
- 471
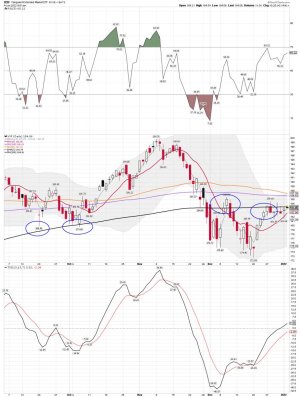
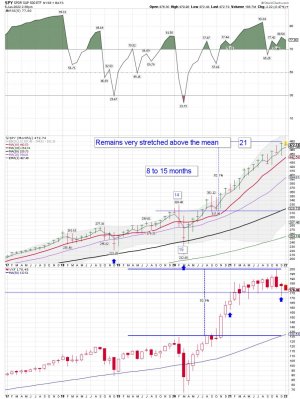
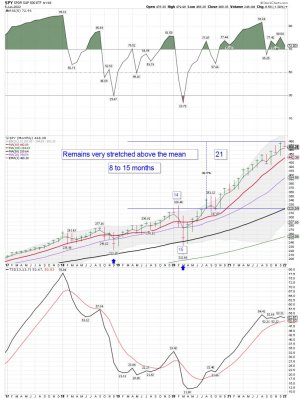
VXF daily: Not good at all...... We shall see if we are headed down into a YCL in the weeks ahead. Waiting to see if buyers come in before the close.... A move down into the YCL will scare new investors based on how stretched we are above the mean.
VXF = The S Fund
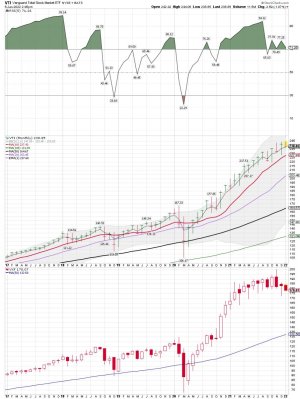
SPY/VXF/VTI monthly chart: VXF and SPY make up VTI
SPY = C Fund
VXF = S Fund
VTI = Both VXF and SPY, but I'm not sure how Vanguard does their mix for (weight) of the Total Stock Market ( Still no sell signal for LT/MT investors ) It does matter to me and I trade both - VXF and VTI.
VXF = The S Fund
SPY/VXF/VTI monthly chart: VXF and SPY make up VTI
SPY = C Fund
VXF = S Fund
VTI = Both VXF and SPY, but I'm not sure how Vanguard does their mix for (weight) of the Total Stock Market ( Still no sell signal for LT/MT investors ) It does matter to me and I trade both - VXF and VTI.
Attachments
Last edited:
robo
TSP Legend
- Reaction score
- 471
VXF daily: If you like to move into and out of the S Fund, the last two months have been tough. The 200 sma on the daily chart remains resistance. One would think we will get a bounce tomorrow, but the whipsaws continue for those trying to trade the S Fund. I use VXF and I remain flat VTI and VXF at Vanguard. Made some beer money trading VXX today.
Good luck those trying to trade the S Fund.
Good luck those trying to trade the S Fund.
Attachments
Last edited:
robo
TSP Legend
- Reaction score
- 471
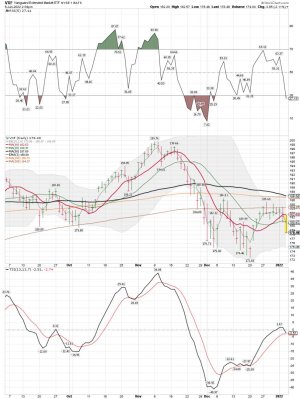
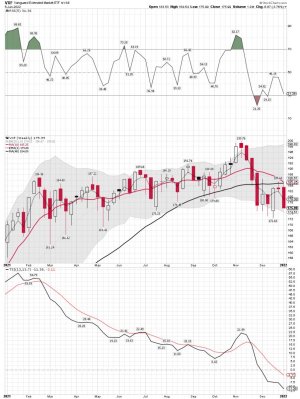
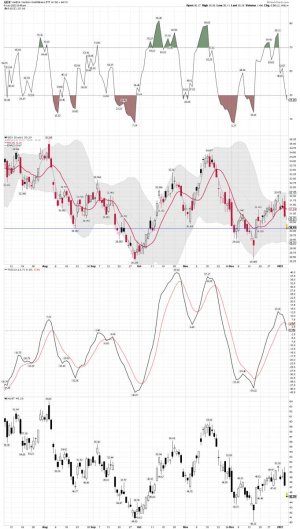
VXF daily ( second chart) : Remains below the 200 sma on the daily ( resistance for now), but filling the gap. One should use some caution here in case we are headed into a yearly cycle low. Biden's second year will not be as easy as the first for the stock market. Well, that is what the historical data indicates. BTD has not worked as well using the S Fund in 2021 and I still think the easy money has been made. LOL.... and trading the S Fund was NOT easy in 2021. In my opinion it will get much tougher in 2022,
VXF daily chart before the open - I remain flat!
VXF weekly: (First chart)
VXF daily chart before the open - I remain flat!
VXF weekly: (First chart)
Attachments
Last edited:

