-
The Forum works well on MOBILE devices without an app: Just go to: https://forum.tsptalk.com
-
Please read our AutoTracker policy on the IFT deadline and remaining active. Thanks!
-
$ - Premium Service Content (Info) | AutoTracker Monthly Winners | Is Gmail et al, Blocking Our emails?
Find us on: Facebook & X | Posting Copyrighted Material
-
Join the TSP Talk AutoTracker: How to Get Started | Login | Main AutoTracker Page
You are using an out of date browser. It may not display this or other websites correctly.
You should upgrade or use an alternative browser.
You should upgrade or use an alternative browser.
Bear Cave 2 (Bull Allowed)
- Thread starter robo
- Start date
robo
TSP Legend
- Reaction score
- 471
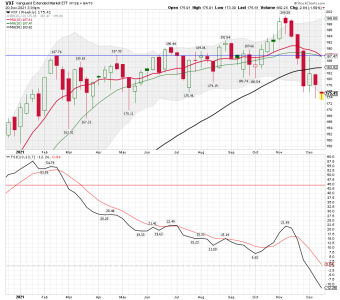
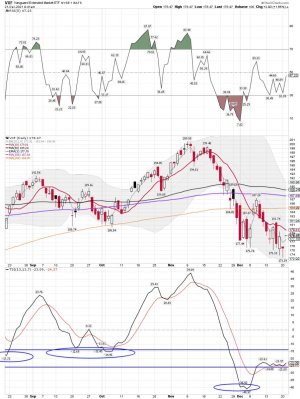
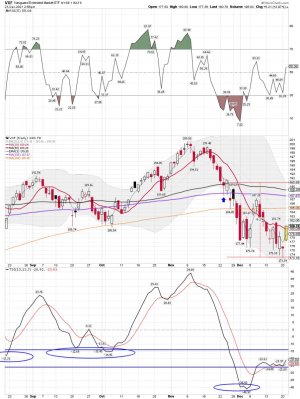
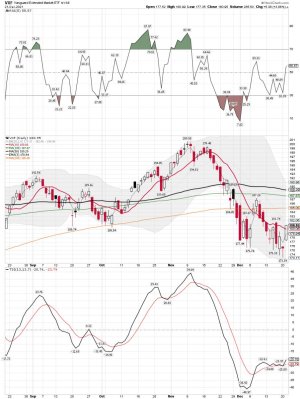
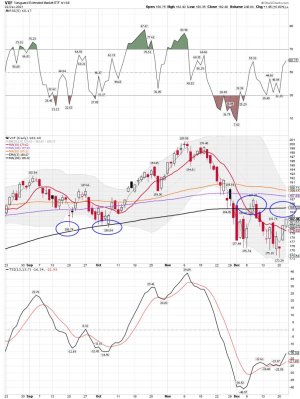
VXF daily: A nice bounce before the close.... We shall see it VXF can close back above the 10 sma on the daily and not be another whipsaw. A possible ICL and YCL are still possible. Gary talks about the possible ICL that might be coming our way. ( Link Below)
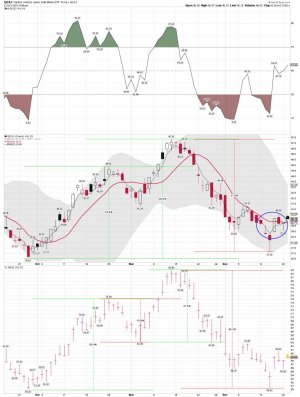
I'm still long VXF and GDXJ..... Small positions.
https://blog.smartmoneytrackerpremium.com/
I'm still long VXF and GDXJ..... Small positions.
https://blog.smartmoneytrackerpremium.com/
Attachments
robo
TSP Legend
- Reaction score
- 471
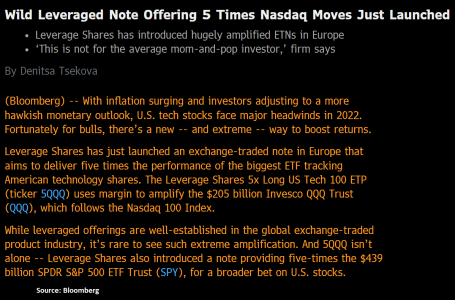
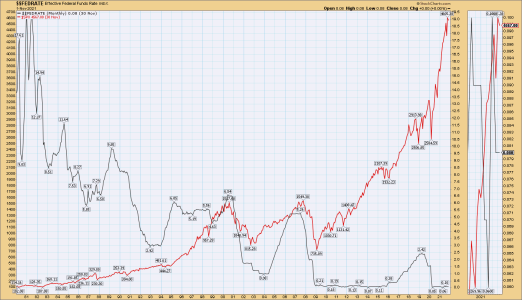
Things that make you go Hmmmm....
https://www.bloomberg.com/quote/5QQQ:NA
https://twitter.com/sentimentrader/status/1471525960226910208/photo/1
https://www.bloomberg.com/quote/5QQQ:NA
https://twitter.com/sentimentrader/status/1471525960226910208/photo/1
Attachments
robo
TSP Legend
- Reaction score
- 471
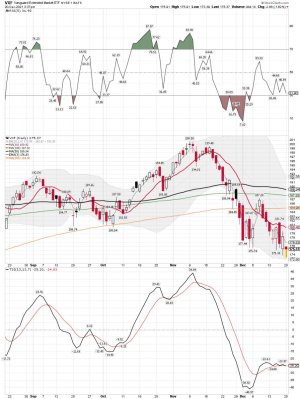
VXF daily: A gap up above the 3 ema on the daily, but still below the 10,50,100, and 200 sma. Remains ugly and I took my profits and will wait for a confirmed buy signal.
https://stockcharts.com/h-sc/ui?s=VXF&p=D&yr=0&mn=4&dy=0&id=p26759776912&a=1082009543
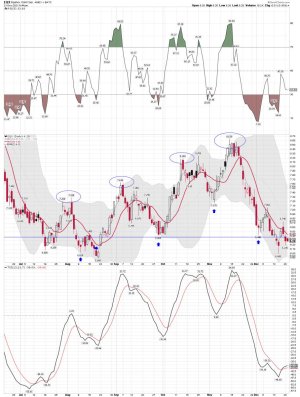
Long : GDXJ and EQX
https://stockcharts.com/h-sc/ui?s=VXF&p=D&yr=0&mn=4&dy=0&id=p26759776912&a=1082009543
Long : GDXJ and EQX
Attachments
FireWeatherMet
Market Veteran
- Reaction score
- 239
- AutoTracker

I hope no one sold their equity position yesterday during the selloff???;damnit
robo
TSP Legend
- Reaction score
- 471
"I hope no one sold their equity position yesterday during the selloff???"
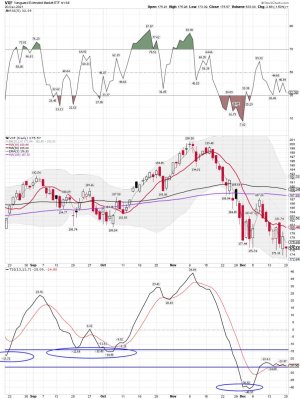
A nice bounce for sure as VXF moves back above the 10 sma on the daily chart. Will this be another whipsaw or the start of a bigger move up? We shall see.....
The VXF chart looking much better today.
I normally BTD and STR in a market like this one. I did sell some VXF with the gap up this morning.
VXF daily: A nice move back above the 10 sma on the daily this morning..... We shall see if it becomes Left Translated, and we head into an Intermediate cycle low as Gary mentioned in the video I posted above. Maybe this is the start of a bigger move up for the (VXF = The S Fund) VXF has been on a sell signal for me since the whipsaw on 12-9-22..... However, I trade the oversold extremes daily both ways.
For the record: For a confirmed buy signal with my system: I need to see a move back above the 3 ema and the 10 sma on a daily chart using the closing price. I also use a few other indicators too, but never take a MT position when the market is trending down below the 3 ema and the 10 sma on the daily chart. When I do I'm ST trading an oversold extreme.
Good luck on your S Fund position..... The C Fund has been doing well. I trade VTI at Vanguard which is the (total stock market), but it's a tad more balanced then your 50/50 combo.
Attachments
Last edited:
rangerray
TSP Pro
- Reaction score
- 209
I hope no one sold their equity position yesterday during the selloff???;damnit
I almost did. Glad today someone has applied a tourniquet, but it's not making me feel any better without a few days of follow-through.
- Reaction score
- 2,465
I hope so too. They certainly pushed maximum fear pressure on Monday to try to get us to do it.
I hope no one sold their equity position yesterday during the selloff???;damnit
robo
TSP Legend
- Reaction score
- 471
I almost did. Glad today someone has applied a tourniquet, but it's not making me feel any better without a few days of follow-through.
So far so good Brother!
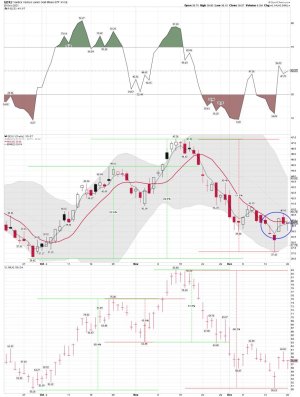
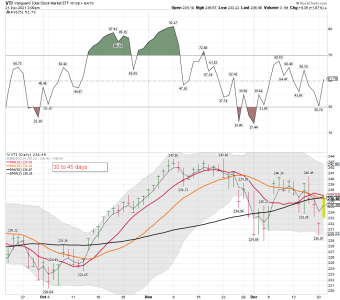
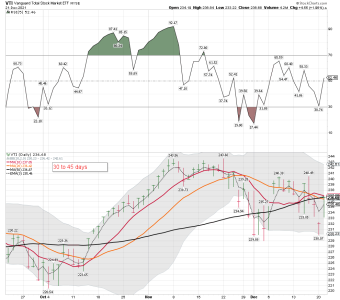
VTI working on moving above the 50 sma and the 10 sma on the daily chart. That means someone be buying, and likes this move..... We shall see how we close today.
Attachments
robo
TSP Legend
- Reaction score
- 471
How was "fear" last Christmas?
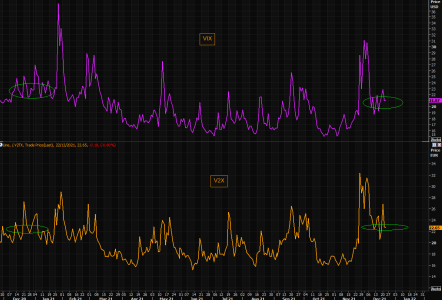
We have witnessed some rather big moves lately. Volatility is not cheap if you are trying to finance the theta, but how did the vol indexes trade last year?
V2X traded around these levels, but note VIX was actually averaging higher levels than current "elevated" levels.
https://themarketear.com/
We have witnessed some rather big moves lately. Volatility is not cheap if you are trying to finance the theta, but how did the vol indexes trade last year?
V2X traded around these levels, but note VIX was actually averaging higher levels than current "elevated" levels.
https://themarketear.com/
Attachments
robo
TSP Legend
- Reaction score
- 471
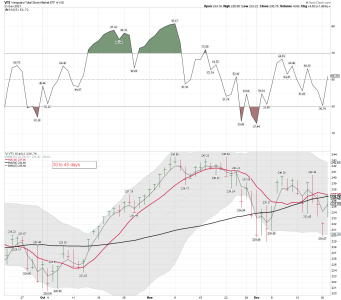
VTI daily: Waiting to see if the buyers can move VTI back above the 10, 20, and 50 sma on the daily chart using the closing price. We shall see how it plays out as we close out 2021.
VXF daily: Looking to see if VXF can continue it's ST trend above the 10 sma on the daily.
VXF daily: Looking to see if VXF can continue it's ST trend above the 10 sma on the daily.
Attachments
Last edited:
robo
TSP Legend
- Reaction score
- 471
Looking back is OK "IF" you have learned from it! However, overall the advice is sound......
A Biblical Trading Lesson
By Jeff Clark, editor, Market Minute
“Don’t look back.”
That was the advice the angels gave to Lot and his family as they led them out of the city of Sodom, just before it was destroyed by the wrath of God.
Whatever happened to the city after he fled was no longer Lot’s concern. It was no longer any of his business. He couldn’t do anything about it.
"Don’t look back” was the angel’s way of saying, “Look forward. There’s nothing to gain by watching what happens behind you. Focus on your future and what’s ahead of you.”
As the Bible tells us, Lot’s wife wasn’t all that good at following directions. She couldn’t resist the temptation to look back and see what happened to the city she just left. And she was turned into a pillar of salt.
Why salt?
Who knows. Maybe it’s because too much salt can lead to high blood pressure and heart problems. Maybe it’s because a pillar of salt is fragile, yet immoveable.
Whatever. The bottom line is, Lot’s wife shouldn’t have looked back. And neither should traders.
Once you’ve exited a position, whether it’s for a gain or a loss, it doesn’t matter what happens to that trade anymore. There’s nothing to be gained by looking back at it. Focus on the future and the opportunities that are in front of you.
If you look back, you run the same risks as Lot’s wife – not that you’ll be turned into a pillar of salt, of course. But that you’ll be rendered fragile and immoveable.
Think about this…
If you’ve taken a profit on a trade and then choose to look back at it, then one of two things will happen…
The position will reverse. You will have sold at the perfect time. And you’ll expect to be able to do that consistently in the future. This leads to overconfidence and the belief that you’ll always be able to get out of town just before the market gods unleash their wrath. This is a dangerous thought process.
The position will go on to even bigger profits. You will have sold too early. And even though you took a good profit on the trade, you’ll feel bad because you could’ve made so much more. This leads you to question every future trade. You’re more inclined to hang on longer than you should. And you may not be able to get out of town in time.
If you’ve taken a loss on the trade and look back at it, then even if the position continues to fall you’ll still feel bad about having taken a loss.
And, if the position turns around and starts to move in your favor, then you’ll likely start hanging on to other losing trades longer than you should – hoping they’ll start moving in your favor as well.
Traders have nothing to gain by looking back at trades they’ve already exited. You can’t change your decision whether it’s proven brilliant or stupid. All looking back will do is paralyze you, like a pillar of salt, on future trades.
It’s important to understand that longevity as a trader has nothing to do with achieving the maximum profit on any one position. It has to do with consistently taking profits on trades as they reach your price targets.
You’re NEVER going to consistently buy at the low and sell at the high. Trying to do so will eventually lead to missing out on good trade setups and holding onto trades longer than you should.
So, avoid the temptation to look back at the trades you’ve exited. Be happy with your decision to get out of town. Focus on the future and don’t look back.
Lot and his family left Sodom and prospered in the neighboring town of Zoar… While Lot’s wife looked back and was turned into a pillar of salt.
To anyone who’s tempted to look back on their trades, remember that doing so will only paralyze you…
And even worse, it could cloud your judgment on the next opportunity to come along.
Best regards and good trading,
https://www.jeffclarktrader.com/market-minute/a-biblical-trading-lesson-5/
robo
TSP Legend
- Reaction score
- 471
3 stumbles after the FOMC
Jason Goepfert
Jason Goepfert
Published: 2021-12-22 at 07:30:00 CST
3 stumbles after the FOMC
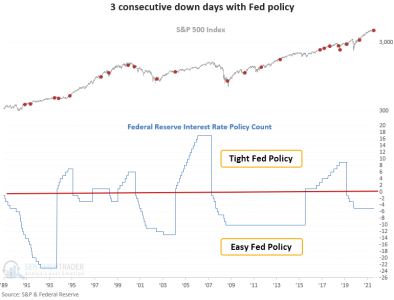
After a significant FOMC decision day stock surge, the hawkish pivot by the fed settled in, and traders sold stocks, with the S&P 500 suffering 3 consecutive negative days of 0.75% or more. Dean assessed the outlook for the S&P 500 when the index closes down for 3 successive days post an FOMC decision day.
That signal triggered 22 other times over the past 31 years. With the S&P 500 down 0.87%, 1.03%, and 1.14% respectively on Thursday, Friday, and Monday, Dean also looked at historical instances when the S&P 500 closes down 0.5% or more for three consecutive days post a decision day. This signal triggered 5 other times over the past 22 years. Stocks rallied each time after those.
Context is always essential when assessing historical patterns. So, Dean evaluated the outlook for the 3 consecutive down days after an FOMC decision day when Federal Reserve policy is easy or tight. If the Fed funds interest rate count is greater than 0, the policy is considered tight. Conversely, if the count is below 0, the policy is deemed to be easy. As it stands now, Fed policy remains easy even though the Fed has signaled that they would like to move to a less friendly stance.
https://www.sentimentrader.com/blog...l&utm_term=0_1c93760246-b7818f39cc-1271291994
Jason Goepfert
Jason Goepfert
Published: 2021-12-22 at 07:30:00 CST
3 stumbles after the FOMC
After a significant FOMC decision day stock surge, the hawkish pivot by the fed settled in, and traders sold stocks, with the S&P 500 suffering 3 consecutive negative days of 0.75% or more. Dean assessed the outlook for the S&P 500 when the index closes down for 3 successive days post an FOMC decision day.
That signal triggered 22 other times over the past 31 years. With the S&P 500 down 0.87%, 1.03%, and 1.14% respectively on Thursday, Friday, and Monday, Dean also looked at historical instances when the S&P 500 closes down 0.5% or more for three consecutive days post a decision day. This signal triggered 5 other times over the past 22 years. Stocks rallied each time after those.
Context is always essential when assessing historical patterns. So, Dean evaluated the outlook for the 3 consecutive down days after an FOMC decision day when Federal Reserve policy is easy or tight. If the Fed funds interest rate count is greater than 0, the policy is considered tight. Conversely, if the count is below 0, the policy is deemed to be easy. As it stands now, Fed policy remains easy even though the Fed has signaled that they would like to move to a less friendly stance.
https://www.sentimentrader.com/blog...l&utm_term=0_1c93760246-b7818f39cc-1271291994
Attachments
robo
TSP Legend
- Reaction score
- 471
I just trade what is happening not what I think will happen......
Mac10
@SuburbanDrone
·
1h
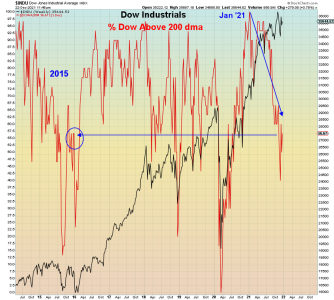
For the "No one saw it coming" club of dedicated denialists, Dow breadth peaked back in JANUARY.
Pundits are already informing us 2022 will be another "great year" for stocks.
The last time a year STARTED with breadth at this level was 2016 Fed "policy error" global crash.
SevenSentinels
@SevenSentinels
·
2h
Wednesday 10:30
SS LOLR STS
Down Down Up
0/7 6/1 4/3
https://twitter.com/SevenSentinels?ref_src=twsrc^google|twcamp^serp|twgr^author
Attachments
robo
TSP Legend
- Reaction score
- 471
LOL..... I still think the easy money has been made.....
https://twitter.com/elerianm
https://twitter.com/elerianm
Attachments
robo
TSP Legend
- Reaction score
- 471
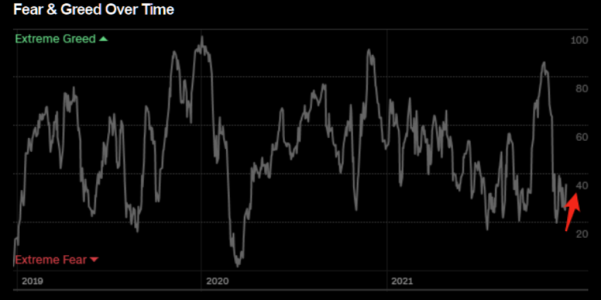
Repeat after me - markets do not crash on extreme fear
We have moved from extreme fear to only fear. Will we revisit greed if the Santa rally becomes more "violent"?
https://themarketear.com/
We have moved from extreme fear to only fear. Will we revisit greed if the Santa rally becomes more "violent"?
https://themarketear.com/
Attachments
robo
TSP Legend
- Reaction score
- 471
VXF daily: The oversold bounce worked out well so far if you went long the S Fund. A nice move back above the 3 ema and the 10 sma on the daily using the closing price. Up next is the 200, 100, and 50 sma on the daily chart. The 200 sma was support for months, but for now remains resistance. We shall see how it plays out.
The oversold low volume move up the $COMPQ continues.....
SevenSentinels
@SevenSentinels
12h
7:30 PM, December 22, 2021
Lowest Volume of Q4
https://twitter.com/SevenSentinels?ref_src=twsrc^google|twcamp^serp|twgr^author
The fund flows for small caps continues to move into other sectors for now.
Most Recent Flows Data - Data Flows for 12/15/2021 - 12/21/2021
Top 10 Redemptions (All ETFs)
https://www.etf.com/etfanalytics/etf-fund-flows-tool
Attachments
Last edited:
robo
TSP Legend
- Reaction score
- 471
Is the Santa rally on? So far so good!
Only one other year can truly compare to 2021 - Over the next 2 weeks, the S&P rallied 15 out of 18 times.Jason Goepfert
Published: 2021-12-23 at 07:30:00 CST
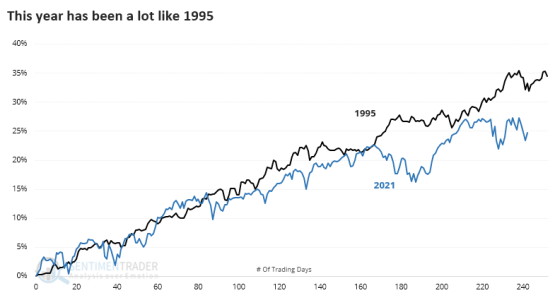
History shows that 1995 is 2021's twin
This year has been a lot like 1995. It has been more like that year than any other, at least in terms of performance. In August, we looked at some of the records being set this year during one of the most persistent and consistent rallies of all time. The one year that was consistent with pretty much all of the momentum studies we've looked at this year is 1995.
That year rallied strongly in September while this year stumbled. Otherwise, they followed each other closely, even including some December weakness.
If we go back to 1928 and look at the most highly-correlated years, there have been 18 others with a correlation greater than 0.85 (out of a scale from -1.0 to +1.0). Even with that expanded universe, 1995 still stood out as having the tightest relationship to 2021.
We're most concerned about what these high correlations might mean going forward. Based on those precedents, the answer is positive, at least in the couple of weeks heading into and immediately after the New Year. Over the next 2 weeks, the S&P rallied 15 out of 18 times.
https://www.sentimentrader.com/blog...l&utm_term=0_1c93760246-3f2173342f-1271291994
Attachments
robo
TSP Legend
- Reaction score
- 471
Mark Hulbert
Opinion: Santa Claus gives you attractive odds of a stock market rally
Last Updated: Dec. 22, 2021 at 5:08 p.m. ET
First Published: Dec. 22, 2021 at 12:37 p.m. ET
By Mark Hulbert
The post-Christmas period represents the confluence of three powerful seasonal patterns
Just like the real Santa Claus, the Santa Claus rally doesn’t arrive until Christmas.
That hasn’t kept Wall Street from attributing every upward blip to Saint Nick over the past six weeks. I worry that his name has been taken in vain more times than You Know Who.
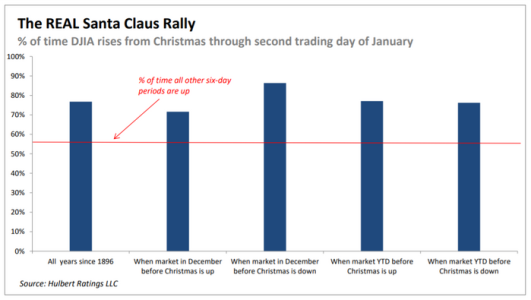
But the only December period in which the stock market has above-average odds of rising begins after Christmas.
I base this conclusion on the average gain in the Dow Jones Industrial Average DJIA, +0.74% starting the first trading session after Christmas and continuing through the second trading session of the New Year. In most years, that period encompasses six trading sessions. (In defining the Santa Claus rally this way, I am following the lead of the Stock Traders Almanac.)
https://www.marketwatch.com/story/s...ds-of-a-rally-in-the-stock-market-11640194646

