Bear Cave 2 (Bull Allowed)

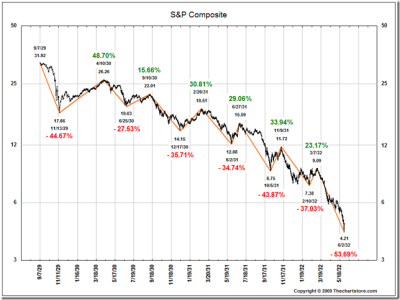
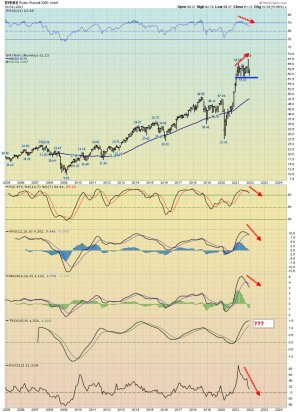
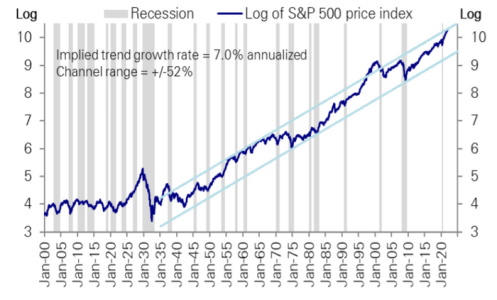
Speaking of history, and looking at historical data...... I still think the current market is like 1929....


Traders Have a Choice: Play Seasonality or Play the Fed
If history is a guide, then traders should be relaxed during this final run into the New Year…

That’s because markets tend to rally around this time.

Since 2000, the average return for the S&P 500 during December has been .70%. In fact, the fourth quarter in general is the strongest of the year.

Some call it the “January effect.” It’s a theory that says markets tend to rise in January due to temporary price dislocations caused by things like “tax harvesting.” Another theory is that investors use their year-end bonuses to buy stocks around this time.

But none of it’s true…

You see, the average returns in January since 2000 are actually negative on average.

So, either this seasonality story has been priced into the market where traders simply front run it and actually buy in December… or it’s a case of “groupthink” around a prevailing narrative.

Today, I’m going to show you the only thing that actually matters in the market, not just for this week, but also for the upcoming year…
https://www.jeffclarktrader.com/mar...ve-a-choice-play-seasonality-or-play-the-fed/
 

Attachments

  • 1929.png
    1929.png
    85.3 KB · Views: 77
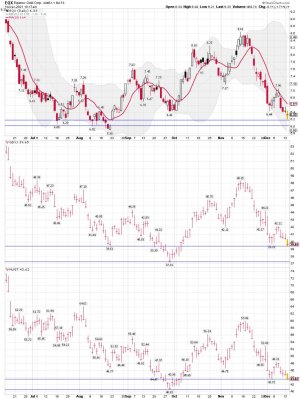
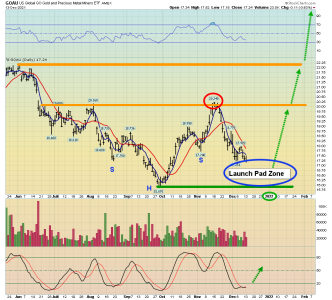
I bought a few more shares of GDXJ and EQX during the gap down this morning. How low will she go this time?
 

Attachments

  • a.jpg
    a.jpg
    155.1 KB · Views: 72
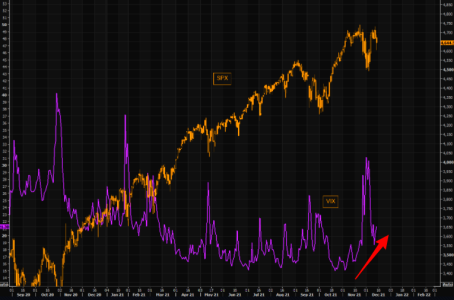
Have not seen this going into FOMC in a while

We have not seen such a big rise in VIX prior to a FOMC event in a long time. On the contrary, the crowd has been eager to sell VIX pre FOMC, and have ended up chasing VIX at much higher levels post the event.

This time around people are actually acting more "rational", but buying VIX here is not cheap. After all, the SPX is down 55 handles from all time highs close...

https://themarketear.com/
 

Attachments

  • a.png
    a.png
    106 KB · Views: 64
Looking forward to some bigger swings tomorrow to trade. Well, maybe!


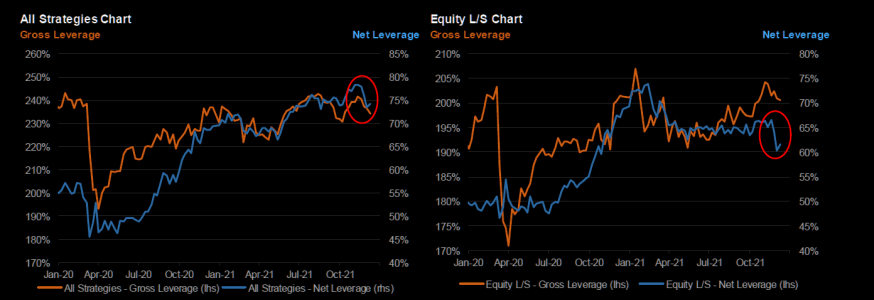
Hedge fund net leverage now only at 2nd %-tile

Hedge funds have de-risked pretty aggressively. JPM Prime Brokerage: "For All Strategies, gross leverage is at the 43rd %-tile over the past 12M. Net leverage has also decreased across HFs. In particular, the z-score of 4wk changes in net leverage fell to some of the lowest levels we’ve seen in the past few years. Eq L/S have been the largest net sellers on our books over the past 3 weeks and saw a sharp decline in net leverage over the prior 2 weeks. Even with the market rebounding last week, net buying was limited and net leverage remains at just the 2nd %-tile over the past 12M. From a longer term standpoint, it’s still at the 75th %-tile since early 2017 and is right around the middle of its range since early 2020".
https://themarketear.com/
 

Attachments

  • a.png
    a.png
    102.4 KB · Views: 68
And just a week prior this same idiot (Jeff) was telling people to buy because his crystal ball was saying the VIX was going to drop. And if you bought you took a hit. What a joke! Maybe it would be best to not post this kind of stuff.

https://www.jeffclarktrader.com/market-minute/this-next-signal-is-likely-to-be-a-winner/


Sorry, but my Magic Ball is Broken. However, this data provided by Jeff is a good ST warning indicator for sure. We shall see how it plays out.

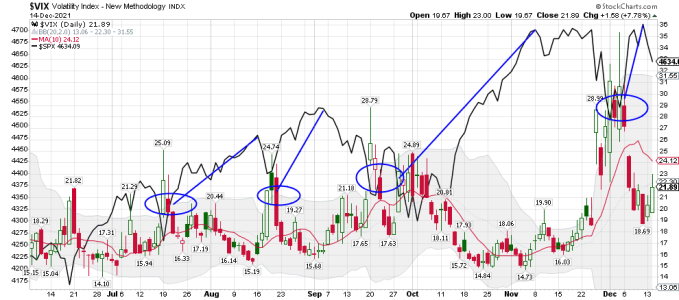
VIX daily chart: VXX filling the gap


The Crystal Ball Is Flashing a Warning
Jeff Clark | Dec 13, 2021 | Market Minute | 3 min read

The “easy money” from the recent buy is done.

Any further gains from here are going to be hard fought. And, if our crystal ball has anything to say about it, the stock market is more likely to be lower two weeks from now rather than higher.

the VIX calls are more than double the price of the VIX puts. When we’ve seen this condition before it often leads to a higher VIX in the days ahead. And a higher VIX usually goes along with a falling stock market.

Traders who bought into last week’s buy signal might consider trimming some profits today.

And, folks who might be looking to put more money to work in the current environment might have a better chance to do so in the days ahead.

Best regards and good trading,
https://www.jeffclarktrader.com/market-minute/the-crystal-ball-is-flashing-a-warning/
 
Sorry, don't mean to get down on you or your posts. Just really tired of all the noise we have to sift through in order to make right decisions. It's draining. One thing I've learned is no one really knows what's going to happen.


And just a week prior this same idiot (Jeff) was telling people to buy because his crystal ball was saying the VIX was going to drop. And if you bought you took a hit. What a joke! Maybe it would be best to not post this kind of stuff.

https://www.jeffclarktrader.com/market-minute/this-next-signal-is-likely-to-be-a-winner/
 
"Sorry, don't mean to get down on you or your posts"

No problem Brother and what you said is true.

I agree that NO ONE ever knows for sure, and that is why I have my own trading system. However, the VIX can be used to give you higher odds on a winning trade.

You have to understand how to use that signal. Read the post below from Jeff, and you will understand it better. Keep in mind it is a short-term signal for trading.

For the record: I use my own data for taking positions, but the short term VIX trade does give you above average odds for a winning trade. There is NO WAY you can use this data in your TSP account.

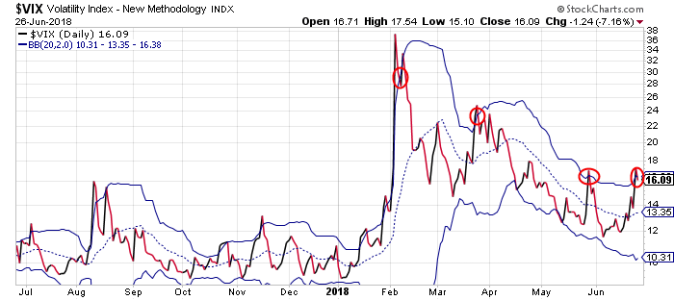
A comment from 2018 on how to use the VIX and the BB as a signal if you have the ability to trade.

Bottom Line: The VIX data is just another tool in your tool box "IF" you are trading. Also, it only gives you high odds for a winning trade. One can NEVER know for sure and that is why you keep it small when trading.


How to Trade the New VIX Buy Signal
Jeff Clark | Jun 27, 2018 | Market Minute

The Volatility Index (VIX) triggered a new buy signal when it closed back inside its Bollinger Bands yesterday. We should see higher stock prices over the next few weeks.


Look at this chart of the VIX…

Bollinger Bands (the blue lines) indicate the most probable trading range for a stock or an index. Whenever a chart moves outside of its Bollinger Bands, it signals an “extreme” condition. In the case of the VIX, these extreme conditions trigger buy and sell signals for the broad stock market.

Sell signals occur whenever the VIX closes below its lower Bollinger Band and then closes back inside the bands. Buy signals occur when the VIX closes above its upper Bollinger Band and then closes back inside the bands.

Yesterday marked the fourth VIX buy signal of 2018 so far. The red circles on the chart encompass each buy signal.

Here’s how the S&P 500 behaved following the previous three signals…
https://www.jeffclarktrader.com/market-minute/how-to-trade-the-new-vix-buy-signal-2/
 

Attachments

  • a.png
    a.png
    43.1 KB · Views: 65
  • a.png
    a.png
    40.5 KB · Views: 63
Last edited:
Oh Boy! Start your engines....

David Rosenberg
@EconguyRosie
·
12h
There's no doubt at this point (post the PPI report), the pressure on Powell to sound really hawkish tomorrow is immense. Dot plots to move up in 2022. Maybe a recession is the only way to put the inflation genie back in the bottle.
https://twitter.com/EconguyRosie?lang=en
 
Added a few more share of the miners...

We shall see Stewart......
Dec 14, 2021

Most market analysts believe the Fed got inflation wrong. They feel higher prices are not transitory and the strong arm of the Fed will push gold modestly lower in 2022.

Could it be that these analysts who failed to predict the rise of inflation… are about to fail again?

I think so. That’s because inflation and deflation come in waves. There’s an ebb and flow, and the first wave has likely run its course.

The impact of Trump’s “QE for the people” stimulus checks is fading fast. America’s new president “Gman Joe” shows no interest in any more direct handouts, even though many citizens are still struggling with the horrifying medical and financial fallout from the Corona crisis.

This is happening while the Fed gets ready to reduce its “stock, bond, and real estate market welfare” QE programs… and the first big reduction could come with tomorrow’s Fed announcement!
December 14, 2021 Transitory Inflation: Great News For Gold Stewart Thomson 321gold ...inc ...s
 

Attachments

  • a.png
    a.png
    110 KB · Views: 57
  • a.jpg
    a.jpg
    165.2 KB · Views: 58
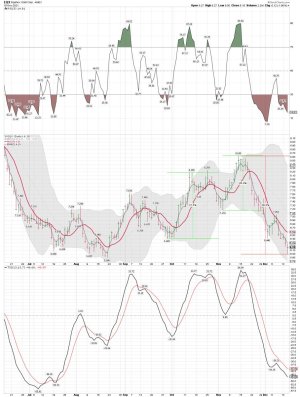
GDX/NUGT daily: Still no buy signal, but we "COULD" be getting close.
 

Attachments

  • a.jpg
    a.jpg
    152.3 KB · Views: 38
GDXJ daily and a closer look: 18 days since GDXJ moved below the 10 sma on the daily chart. 21 days since moving below the 3 ema and when ST trading that gets my attention.
 

Attachments

  • a.jpg
    a.jpg
    123.3 KB · Views: 47
Last edited:
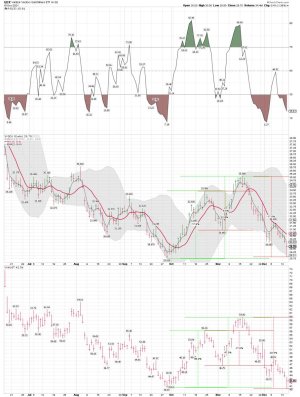
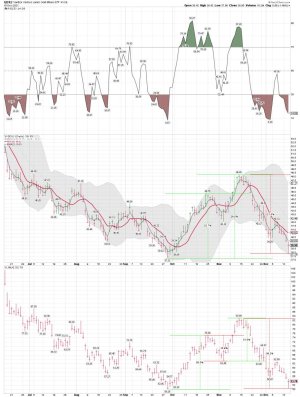
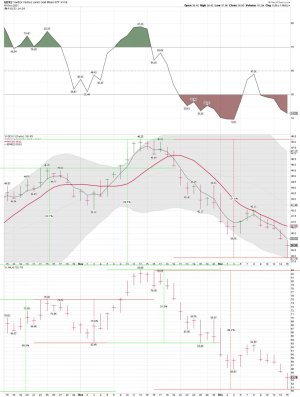
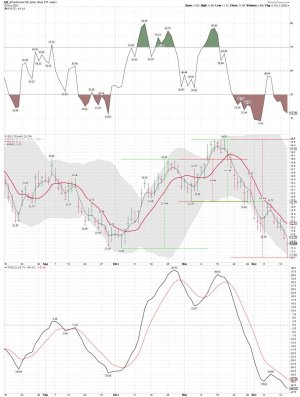
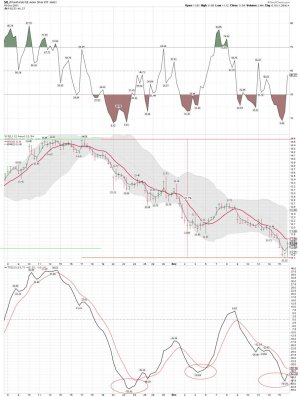
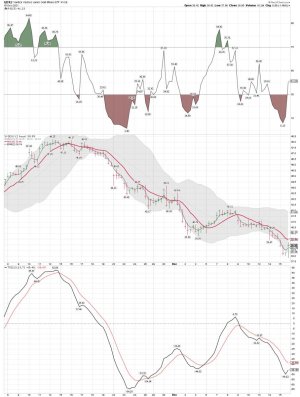
SILJ daily: Long SILJ, GDXJ and EQX. Short-term trading some NUGT and JNUG...... ALL remain in a down-trend below the 3 ema on the daily. That means I'm counter-trend trading and trying to catch the falling knife. We shall see how it plays out.
 

Attachments

  • a.jpg
    a.jpg
    141.7 KB · Views: 45
  • a.jpg
    a.jpg
    152.5 KB · Views: 45
Highly valued S&P 500 index is ‘near the top of its 85-year trend channel,’ says Deutsche Bank
Published: Dec. 13, 2021 at 4:48 p.m. ET

The S&P 500’s “extremely high” historical valuation puts the index near the upper bound of a “trend channel of price appreciation” that spans more than eight decades, but the broad equity benchmark still could go higher, according to Deutsche Bank Research.

The U.S. stock index is “near the top of its 85-year trend channel,” the bank’s strategists wrote in a research report dated Dec. 10. “It was only higher in the late 1930s and late 1990s, when it went above,” a chart in the report shows.
https://www.marketwatch.com/story/h...-trend-channel-says-deutsche-bank-11639432105


A dot-com style unwind of big tech stocks is coming on the heels of a Fed rate hike - and investors should sell now before the looming crash, Bank of America says
https://markets.businessinsider.com...sell-dot-com-bubble-unwind-rate-hikes-2021-12


LOL..... We shall see how this one plays out!

True Contrarian
@TrueContrarian

Dec 14
Elon Musk was named Time's Person of the Year--when this happened for Jeff Bezos 22 years ago the stock of Amazon dropped over 95% #ElonMusk Just sayin'
 

Attachments

  • a.png
    a.png
    109.5 KB · Views: 45
  • a.jpeg
    a.jpeg
    6.7 KB · Views: 44
  • a.jpg
    a.jpg
    36.1 KB · Views: 45
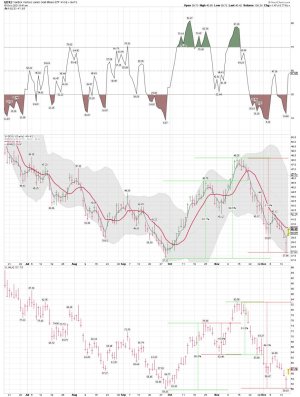
GDXJ and SILJ 2 hour charts: I will be trading using the 2 hour charts tomorrow as I wait to see if the miners can bottom, and get back above the 3 ema and the 10 sma on the daily chart. A nice bounce off the lows today, so we shall see if buyers are coming back in at these prices. Still no buy signal. A move back above the 10 sma on the 2 hour chart would be a good start.
 

Attachments

  • a.jpg
    a.jpg
    147.7 KB · Views: 48
  • a.jpg
    a.jpg
    133.3 KB · Views: 48
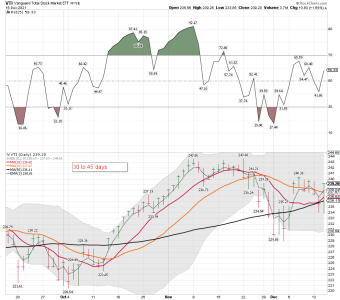
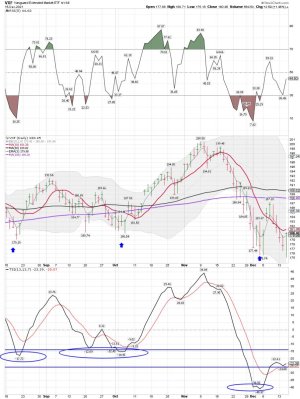
I'm currently flat VTI and VXF at Vanguard. Note the VXF chart...... Not what you want to see this time of the year..... I remain flat and my system is on a sell signal. A move of 13 days down below the 10 sma on the daily, and then a gap up and a bounce of only 2 days. Now trending back down again..... I will pass for now as many are getting whipsawed as they try to get on Santa's Sled for an easy ride. It doesn't look that way so far for this year. Is this another 2007? We shall see how this plays out. Waiting to see if VXF can close back above the 10 sma in the days ahead. If looks like a gap up and above the 10 sma at the open.

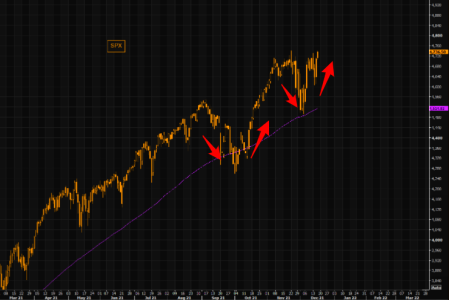
We have seen this movie before

The SPX corrected around 5% from September highs to October lows. The bounce was very violent. The index revisited ATHs, consolidated for a few days and ripped higher into the November ATH. This past sell off was more violent (VIX overshot massively), but it resembles the Sep/Oct sell off as we corrected almost 5% as well. We have had the furious bounce. We are at ATHs now. Maybe a pinned expiration "chill" and then the Santa rally?


https://themarketear.com/
 

Attachments

  • a.png
    a.png
    73.9 KB · Views: 48
  • a.png
    a.png
    49.9 KB · Views: 51
  • a.jpg
    a.jpg
    151.6 KB · Views: 52
Last edited:
LOL...... Bull is allowed so that would work..... These days I just trade the trend Brother - “There is only one side to the stock market; and it is not the bull side or the bear side, but the right side” Jesse L. Livermore
 
Ok, is this it? LOL..... we shall see as GDXJ looks like it might test the 10 sma on the daily today.

Long GDXJ and SILJ..... ST trading NUGT and JNUG.... We shall see how this plays out!
 

Attachments

  • a.jpg
    a.jpg
    147.4 KB · Views: 51
  • a.jpg
    a.jpg
    153.4 KB · Views: 50
A closer look...... I want to see a close above the 10 sma today, I'm taking profits on my JNUG trade..... I will move gains into GDXJ if we keep moving higher.

GDXJ - Trouble at the 10 SMA? Waiting.... I make trades for JNUG using the GDXJ data.......
 

Attachments

  • a.jpg
    a.jpg
    133.6 KB · Views: 55
  • a.jpg
    a.jpg
    130.6 KB · Views: 54
Back
Top