Bear Cave 2 (Bull Allowed)

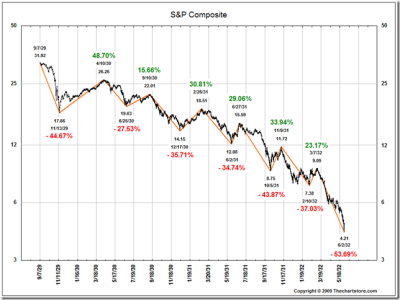
Huge short-term rebounds were common in 1931, 1974, 2001, and 2008, with these years sharing a common thread.


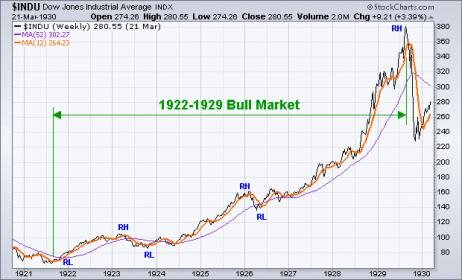
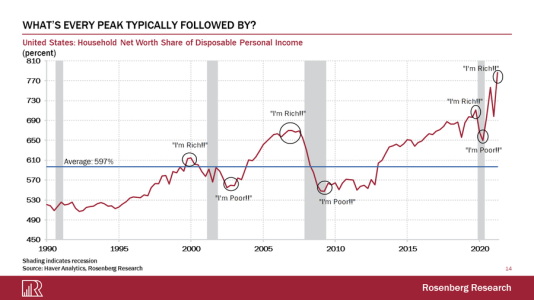
The biggest downward corrections and bear markets usually feature the most dramatic short-term rebounds, with 1931 being by far the top in that category with 2008, 2001, and 1974 not far behind. It is likely that the recent sudden surge higher for QQQ and similar baskets of large-cap U.S. equities are in the same category. This behavior encourages Bogleheads not to sell at favorable prices and induces momentum players to keep piling in and out at the wrong time. If you're wondering why you or someone you know didn't sell in a year like 2008 and 2001 then headlines about big up days for U.S. stocks often emotionally dissuade many investors from getting out until it is too late.

https://twitter.com/TrueContrarian?ref_src=twsrc^google|twcamp^serp|twgr^author
https://truecontrarian-sjk.blogspot.com/
 
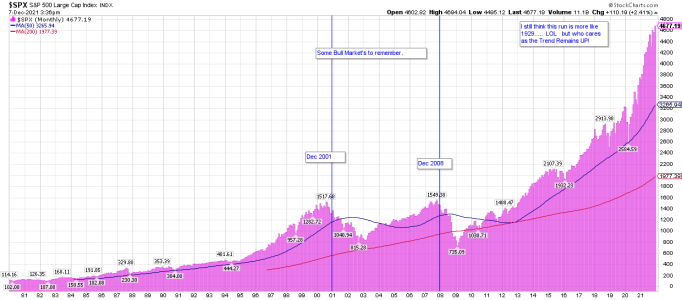
Are we currently in a Bear Market? It depends on who you ask......
 

Attachments

  • 1929.png
    1929.png
    85.3 KB · Views: 74
  • cycle-1922-1929-bull-market-50ma-620-376.jpg
    cycle-1922-1929-bull-market-50ma-620-376.jpg
    25.8 KB · Views: 72
  • a.png
    a.png
    21.8 KB · Views: 70
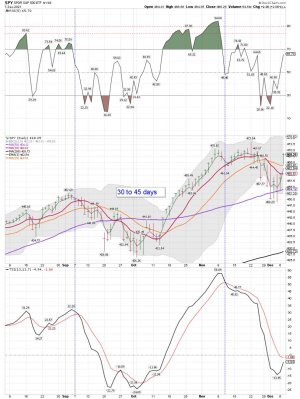
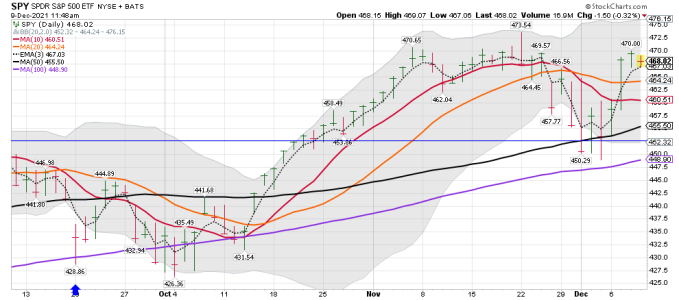
SPY daily after the close: Whats not to like? We should see some new buy signals from some of the Guru's, and the chasers should come into play. LOL.... if they didn't already buy. I took profits...... I will wait and see how this plays out! It will not take much to hit another ATH or maybe a lower high. We shall see!
 

Attachments

  • a.jpg
    a.jpg
    147.7 KB · Views: 77
Last edited:
Do not forget these (upcoming) risks
Despite the brutal short squeeze, there are risks to consider going forward. Volatility remains huge, both ways. Few risks to focus on according to Nomura:

1. Op-Ex and Fed next week

2. CTA deleveraging “sell triggers” will remain “proximate enough” to spot after this imminent covering squeeze tuckers-out

3. Skew stays completely “jacked up” and stress-y

4. US inflation prints are not expected to peak until 1Q21, it is highly probable that “Fed Put” strike is now much lower

The crowd has been shocked, both ways. Maybe this market needs to thread water and sober up before any new meaningful direction can take place...

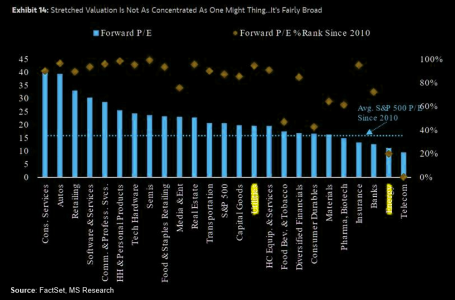
Stretched valuation is more broad-based
Morgan Stanley believes the Fed pivoting to a faster taper (not Omicron) is the primary driver of the market’s de-rating over the past two weeks. However, P/Es are still higher than they were two months ago at nearly 20x… with 70% of S&P 500 industry groups currently trading in the top 25% of historical forward P/E levels going back to ’10, and all but five groups (out of 24) trading above the SPX’s average multiple since ‘10 (15.9x). Bottom line: Elevated valuation is pervasive despite a lot of focus on a concentrated market, which strengthens the case for a market multiple de-rate, and the importance of stock selection.
https://themarketear.com/
 

Attachments

  • a.png
    a.png
    256 KB · Views: 78
LOL..... It was a nice move up and smoked the shorts again....

Boom Goes The Dynamite
Posted on December 7, 2021

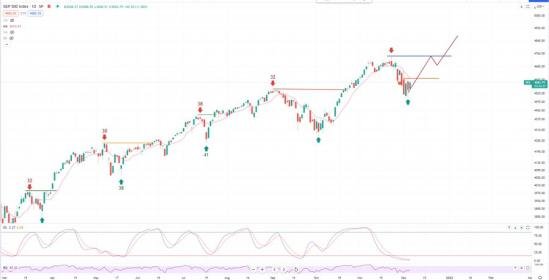
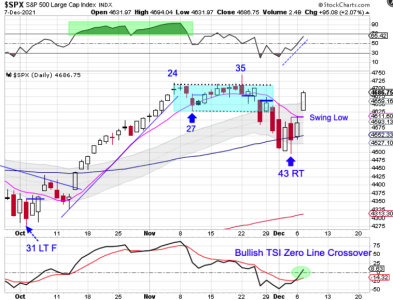
While stocks formed a swing low on on Monday, they were contained by the 10 day MA.

Boom.

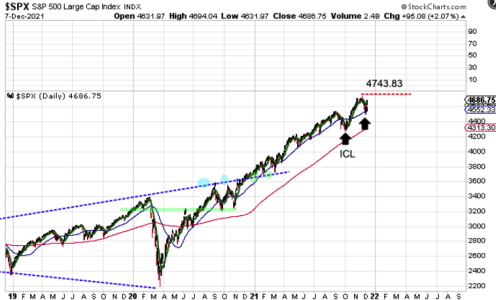
Stocks gapped above the declining trend line to end up rallying for 2.07% on Tuesday to signal the new daily cycle. Stocks also closed above the upper daily cycle band on Tuesday. Closing above the upper daily cycle band ends the daily downtrend and renews the daily uptrend.


Stocks are heading into the most bullish time of the year. If stocks can quickly breakout above the all-time high of 4743.83, that could trigger a melt-up phase.
https://likesmoneycycletrading.wordpress.com/author/likesmoneystudies/
 

Attachments

  • a.png
    a.png
    133.3 KB · Views: 78
  • a.png
    a.png
    87.2 KB · Views: 78
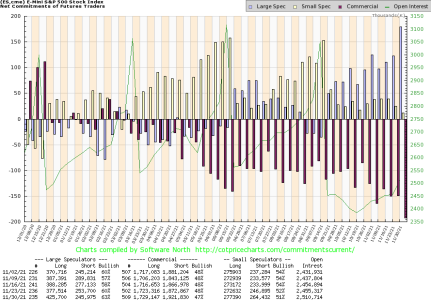
Not sure the COT matters, but someone is sure hedging going into next year.

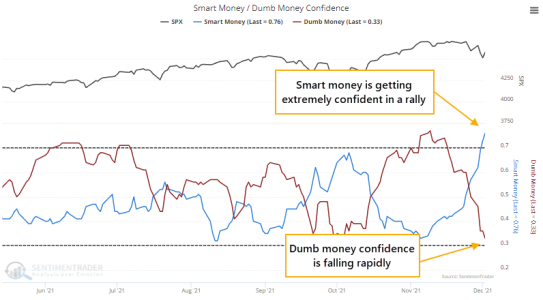
The spread in sentiment between Smart and Dumb Money is historic
Jason Goepfert
Jason Goepfert
Published: 2021-12-08 at 07:35:00 CST

Historic spread between Smart and Dumb Money

The past couple of weeks has triggered a drastic shift in sentiment. The confidence in a rally among Smart Money indicators has jumped. It would be even more extreme if there wasn't a curiously large plunge in "smart money" commercial hedger positions in equity index futures.

We can see the stark change in attitude below. Despite the weird increase in a net short position in index futures, Smart Money Confidence jumped to 77%, the highest since late April 2020. Dumb Money Confidence plunged to 30%, the lowest since early April 2020.
https://www.sentimentrader.com/blog...l&utm_term=0_1c93760246-9929f5ebd3-1271291994
Current Commitments of Traders Charts
 

Attachments

  • a.png
    a.png
    58.7 KB · Views: 68
  • a.png
    a.png
    39.8 KB · Views: 68
Last edited:
LOL..... A different take on the Smart Money...... Do you track what the insiders are doing? I sure do......

For the record: I DO NOT use this type of data for trading. However, I do track it.
When The Smart Money Says ‘Sold To You’

jessefelder
December 8, 2021

Over the summer I highlighted the rapid increase in leverage being put to use on the part of speculators in the equity markets. Since that time, it has only continued to grow. Margin debt, call option volumes, net futures positioning and leveraged ETF assets (depicted below) all show these folks putting on the most extreme leverage we have ever witnessed.

What makes this all the more notable is that the smartest of smart money, corporate executives and other insiders, are now selling at the fastest annual pace on record (largely driven by the most valuable companies in the market). Setting aside the economic message of the indicator below, the simple fact that insiders are taking the other side of speculators’ record leverage is significant, especially given their stellar track record.
https://thefelderreport.com/2021/12/08/when-the-smart-money-says-sold-to-you/
 
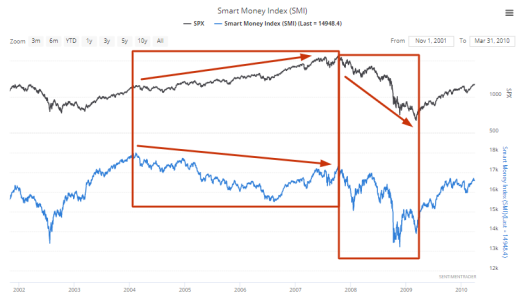
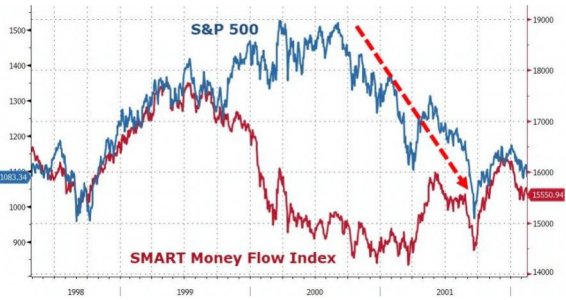
Hmmmmm..... Once again I DO NOT use this data for trading. The smart money looked pretty Bullish to me during the 1999 and 2007 tops. Not that I care. I just thought I would look over and compare the historical data.

Some thoughts on this and note this is NOT a current article. Again, something I DO NOT use for trading. I track several indicators, but the overall trend is what I'm trading.

Smart Money Index: What It Is and How It Works

https://www.warriortrading.com/smart-money-index/

Some historical charts about the smart money that I found after a web search. Looking for tops around 2008. Not looking up data about the dumb money.
https://www.google.com/search?q=sma...lz=1CAMWDF_enUS877&hl=en#imgrc=APG0aBEWvuYaaM
 

Attachments

  • a.png
    a.png
    59 KB · Views: 62
  • a.jpg
    a.jpg
    57.9 KB · Views: 57
Last edited:
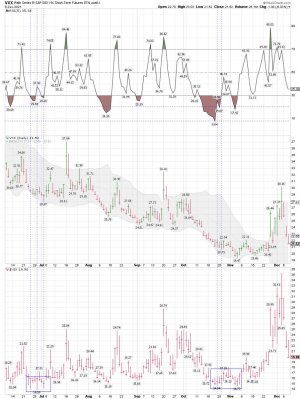
Well, the VIX under 15ish pattern played out. We shall if we fill the gap next and get another bounce..... I don't know what will happen. I'm just pointing out the pattern. Maybe we will head back under 15ish again.
 

Attachments

  • a.jpg
    a.jpg
    163.8 KB · Views: 67
Last edited:
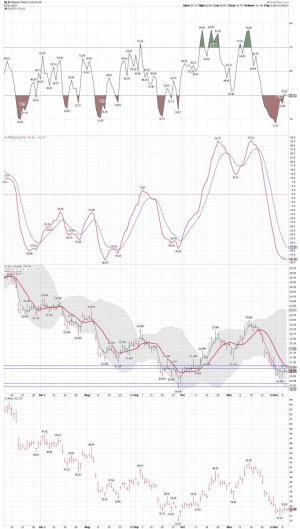
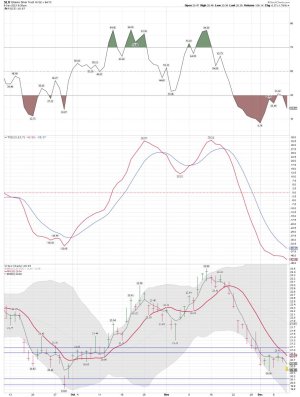
SLV daily: Trying to bottom or getting ready for the next move lower? I will buy a few shares around $20.00ish again this morning.

I will post a closer look after the open and see how far we gap down. It looks like $20.25ish.... We might just fill the gap at the open.

SLV daily a closer look: A bought one tranche before the open for a trade @ $20.25 These trades are small.....

12/09/2021 08:55:09 Bought SLV @ 20.25
https://stockcharts.com/h-sc/ui?s=SLV&p=D&yr=0&mn=3&dy=0&id=p05587762717&a=1077290747
 

Attachments

  • a.jpg
    a.jpg
    116.6 KB · Views: 57
  • a.jpg
    a.jpg
    131 KB · Views: 58
Last edited:
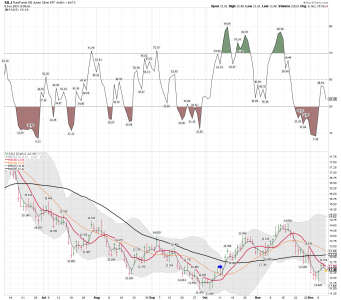
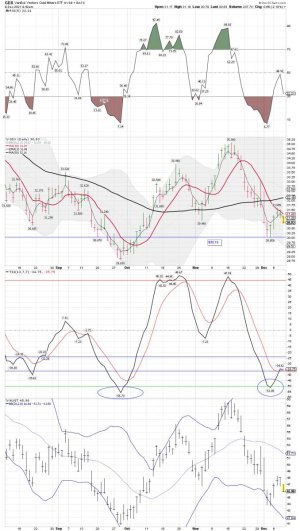
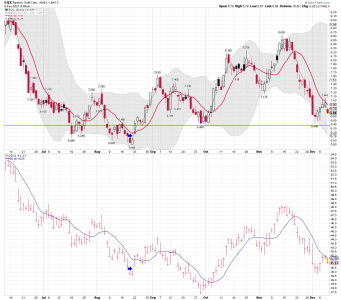
SILJ/EQX and GDX daily: All are having trouble at the 10 sma on the daily.....

The miners are always on my buy list "IF" the price is right.... LOL..... We shall see if buyers come in and we make higher lows, or just move lower. Either way I will be buying for a trade around these prices....
 

Attachments

  • a.png
    a.png
    79.1 KB · Views: 61
  • a.jpg
    a.jpg
    126.6 KB · Views: 60
  • a.png
    a.png
    66.3 KB · Views: 61
Last edited:
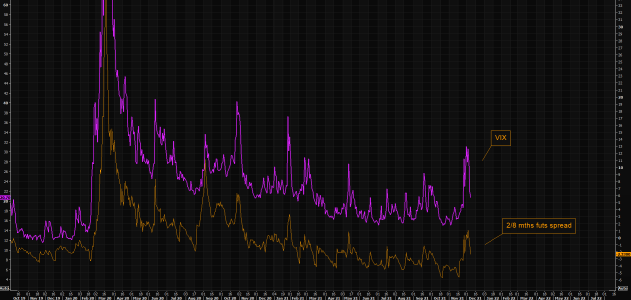
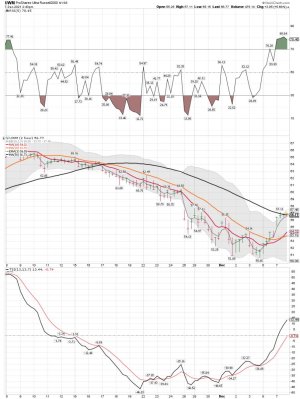
VIX 2 hour chart: VIX filling the gap!


VIX guy continues nailing it
NASDAQ futs unch, SPX futs unch,. What is the vol of that? As a reminder this is what our favorite VIX (inverse) indicator told us a week ago (here):

"His main idea was to buy VIX here. Needless to say we are starting to sell volatility here. One way to play it is via put spreads in VIX. After all, volatility is mean reverting and our VIX guy has continued holding the perfect 100% inverse track record. Will he nail it again?"

Here we are with the VIX having crashed and it continues moving lower today. Dealers are in long gamma and unless this moves asap they will add to vol selling as well as funds getting involved in overwriting stuff post the squeeze move. Chart showing the VIX as well as the 2/8 months spread imploding.
https://themarketear.com/
 

Attachments

  • a.png
    a.png
    55.8 KB · Views: 63
  • a.jpg
    a.jpg
    133.2 KB · Views: 62
2022 should be good for trading in my opinion. I think investors will NOT like it. Of course that is just an opinion, and I will trade what is happening and not what I think will happen.


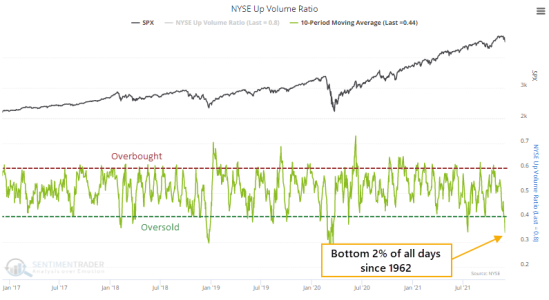
After a modest pullback, buyers come back in a historic way
Jason Goepfert
Jason Goepfert
Published: 2021-12-09 at 07:35:00 CST
Deeply oversold...then really, really not

At the end of November, selling pressure was concentrated enough to push the 10-day average of NYSE Up Volume below 40%. By December 1, that 10-day average dropped to 34%, oversold enough to be in the bottom 2% of all days since 1962.
https://www.sentimentrader.com/blog...l&utm_term=0_1c93760246-0bd1f7f8df-1271291994
 

Attachments

  • a.png
    a.png
    56.6 KB · Views: 62
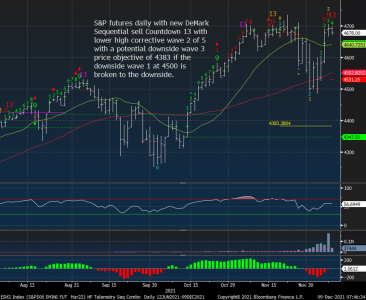
A couple of Tweets: Maybe a move back down to the 100 sma on the daily chart? That is not a guess from me, but a DeMark possible signal. I DO NOT trade based on any signals other then my own. We shall see how it plays out in the days ahead.

David Rosenberg
@EconguyRosie
·
2h
Initial jobless claims plunged to 184k in the December 4th week from 227k in the November 27th week. This is the lowest level since September 6th, 1969! Bullish statistic? No. A recession came out of the blue exactly three months later.
https://twitter.com/EconguyRosie?lang=en


John P. Hussman, Ph.D.
@hussmanjp
·
1h
Not part of our own process, but interesting in the context of the motherlode of overextended syndromes we're observing here (see special comment at top of this thread). Just FYI.
Quote Tweet
Thomas Thornton
@TommyThornton
· 2h
$SPX futures with DeMark Sequential sell Countdown 13 as we have been expecting. Now awaiting a price flip over the coming days.
https://twitter.com/hussmanjp?ref_src=twsrc^google|twcamp^serp|twgr^author
 

Attachments

  • a.png
    a.png
    362.3 KB · Views: 60
  • a.png
    a.png
    33.1 KB · Views: 57
Last edited:
More on Volatility for 2022. I don't really care what the markets do in 2022 since I trade both ways. However, I will just trade the current trend, but I too will probably get whipsawed more in 2022.

Proceed with caution’: here’s what Wall Street analysts see for the U.S. stock market in 2022
Last Updated: Dec. 9, 2021 at 10:06 a.m. ET
First Published: Dec. 8, 2021 at 12:55 p.m. ET

The CBOE Volatility Index VX00, -7.37%, or VIX, jumped in late November and remains above its 200-day moving average even after subsiding since last week, according to FactSet data. The VIX broke above 30 last week for the first time since the first quarter of 2021, the data show, amid market jitters over the emergence of omicron and the potential move by the Federal Reserve to remove some accommodation from the market faster than investors had anticipated.
https://www.marketwatch.com/story/p...-stock-market-in-2022-11638986154?mod=markets
 
Amazing how little it takes to the downside to make markets "oversold" nowadays. Based on that chart from sentimentrader, there haven't been too many periods as "oversold as this, but I guess that's a testament to how generous this market has been to those taking bullish bets - unless you've taken bullish bets on anything ARKK this year.
 
Back
Top