-
The Forum works well on MOBILE devices without an app: Just go to: https://forum.tsptalk.com
-
Please read our AutoTracker policy on the IFT deadline and remaining active. Thanks!
-
$ - Premium Service Content (Info) | AutoTracker Monthly Winners | Is Gmail et al, Blocking Our emails?
Find us on: Facebook & X | Posting Copyrighted Material
-
Join the TSP Talk AutoTracker: How to Get Started | Login | Main AutoTracker Page
You are using an out of date browser. It may not display this or other websites correctly.
You should upgrade or use an alternative browser.
You should upgrade or use an alternative browser.
Bear Cave 2 (Bull Allowed)
- Thread starter robo
- Start date
robo
TSP Legend
- Reaction score
- 471
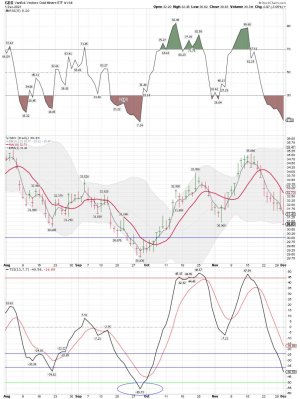
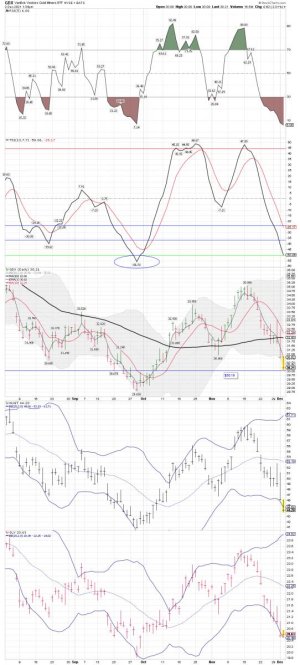
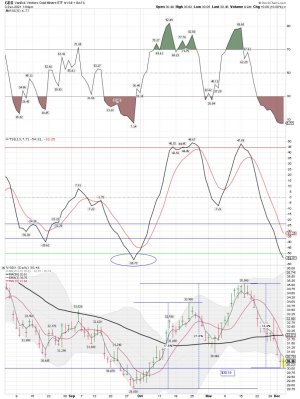
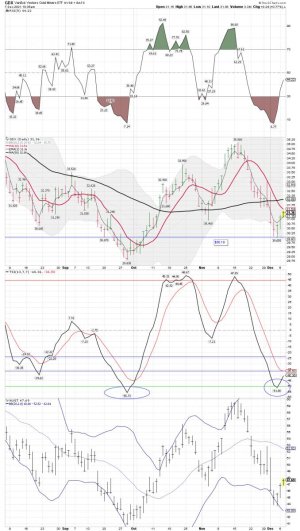
GDX daily: Close to tagging the $30ish level again. The trend remains down. I will be buying back shares of SLV and GDX for a trade only.
https://stockcharts.com/h-sc/ui?s=GDX&p=D&yr=0&mn=4&dy=0&id=p27425029531&a=1027437746
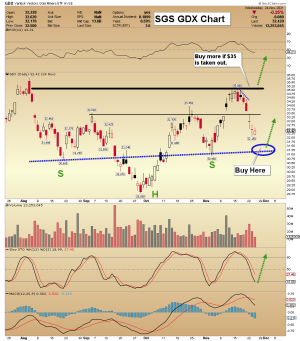
Morris: Second chart. We hit his target so we shall see how it plays out.
Nov 26, 2021 Gold Stocks: It's Almost Time To Buy Morris Hubbartt 321gold ...inc ...s
https://stockcharts.com/h-sc/ui?s=GDX&p=D&yr=0&mn=4&dy=0&id=p27425029531&a=1027437746
Morris: Second chart. We hit his target so we shall see how it plays out.
Nov 26, 2021 Gold Stocks: It's Almost Time To Buy Morris Hubbartt 321gold ...inc ...s
Attachments
Last edited:
robo
TSP Legend
- Reaction score
- 471
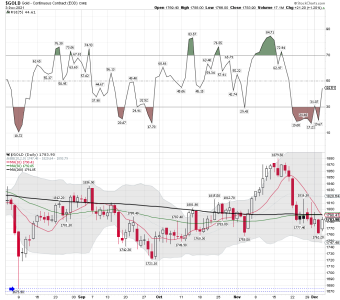
I bought some shares of SLV and GDX with the gap down at the open for a ST trade. We could still move much lower so I will be using stops on these two.
The trend remains down for both.....
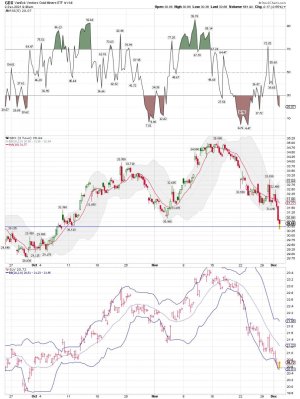
GDX 2 hour chart below:
Daily:
https://stockcharts.com/h-sc/ui?s=GDX&p=D&yr=0&mn=4&dy=0&id=p27425029531&a=1027437746
The trend remains down for both.....
GDX 2 hour chart below:
Daily:
https://stockcharts.com/h-sc/ui?s=GDX&p=D&yr=0&mn=4&dy=0&id=p27425029531&a=1027437746
Attachments
robo
TSP Legend
- Reaction score
- 471
GDX daily: Buying shares round $30.00ish again for a trade. The last time GDX tagged $30.00ish we went down to $28.83ish..... I bought then and I'm trying it again. This is a trade only and not an investment. We shall see how this plays out.
Long - VXF, SLV, GDX and NUGT and adding.....
Good trading!
Long - VXF, SLV, GDX and NUGT and adding.....
Good trading!
Attachments
Last edited:
robo
TSP Legend
- Reaction score
- 471
LOL..... OK! Getting ready for another meltup.....
America’s biggest pension fund CalPERS votes to reshuffle allocations, add leverage, in bid to combat low returns
America’s largest public pension plan that serves California state and local workers is going to make riskier investments.
On Monday, the board of the California Public Employees’ Retirement System, or CalPERS, voted to make changes to its portfolio in the face of what are expected to be lower returns in future years, even as it also decided to keep constant its expected rate of return.
https://www.marketwatch.com/story/a...rage-in-bid-to-combat-low-returns-11637256386
Earlier coverage: With lower returns on the horizon, public pensions will turn to riskier assets, Moody’s says
Public pension systems take in contributions from governmental employers and employees, and invest their portfolios in ways that aim to maximize returns, while also protecting the existing assets. That is always a tricky balance to strike, but after a blockbuster few years, most public pension systems are bracing for what many assume can only be an era of lower returns in the future.
“The portfolio we’ve selected incorporates a diverse mix of assets to help us achieve our investment return target,” CalPERS said in a statement. “By adding 5% leverage over time, we’ll better diversify the fund to protect against the impact of a serious drawdown during economic downturns.”
The fund has long had extensive allocations to alternative assets — on its website, it calls itself “one of the largest private-equity investors in the world” — but has never added leverage to its portfolio. An allocation to private debt is also new.
robo
TSP Legend
- Reaction score
- 471
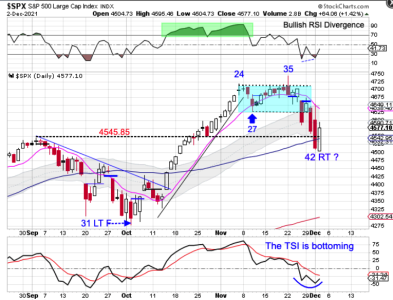
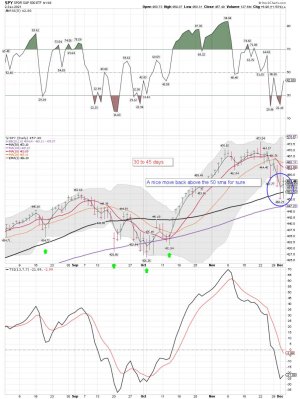
SPY daily: Can it hold above the 50 day sma?
Stock Recover The 50 Day MA
Stocks broke below the September breakout level on Wednesday to close below the 50 day MA. Stocks then broke lower on Thursday to print a bullish reversal. Thursday was day 42, placing stocks in their timing band for a DCL. Technically stocks still need to form a swing low. However, recovery of the September breakout level and the rising 50 day MA signals a new daily cycle.
Attachments
robo
TSP Legend
- Reaction score
- 471
robo
TSP Legend
- Reaction score
- 471
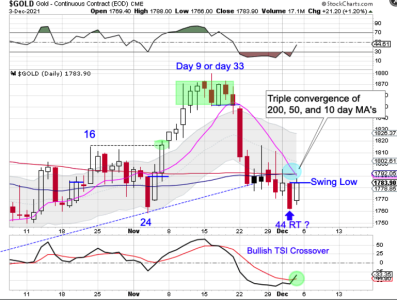
Gold – Triple Convergence
by likesmoneystudies
Gold formed a swing low on Friday.
Gold printed its lowest point on Thursday, day 44, placing it late in its timing band for a DCL. Gold formed a swing low on Friday. A close above triple convergence of the 200 day MA, the 50 day MA, and 10 day MA will have us label day 44 as the DCL. Gold is currently in a daily downtrend. Gold will remain in its daily downtrend unless it closes above the upper daily cycle band.
https://likesmoneycycletrading.wordpress.com/2021/12/04/gold-triple-convergence/
Attachments
robo
TSP Legend
- Reaction score
- 471
robo
TSP Legend
- Reaction score
- 471
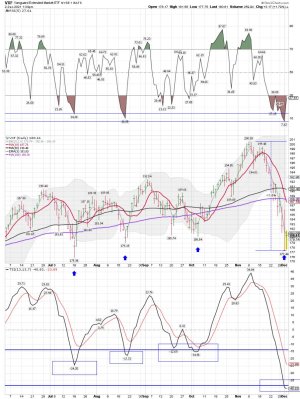
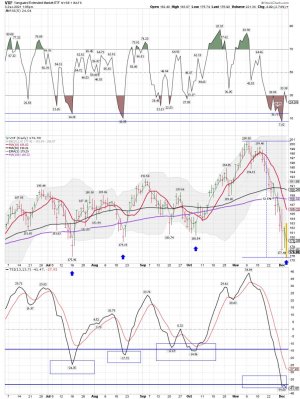
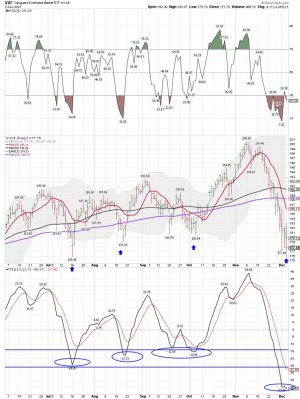
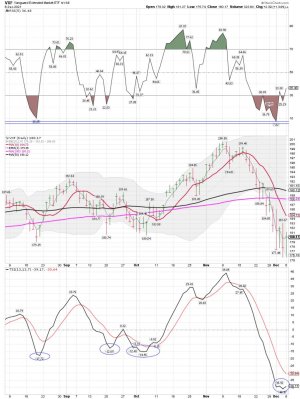
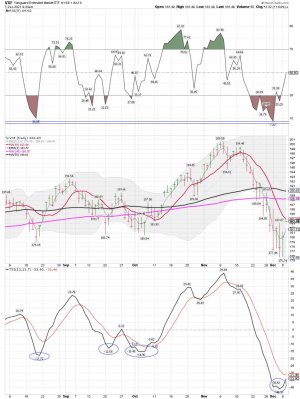
VXF daily: The selling for small and mid caps continues.....
I have a small position of VXF and added a few more shares Friday. It remains a losing trade as I try and catch the falling knife! This a ST trade, and I will sell if we don't bounce soon.
Long: GDX, VXF, UWM, and NUGT
I have a small position of VXF and added a few more shares Friday. It remains a losing trade as I try and catch the falling knife! This a ST trade, and I will sell if we don't bounce soon.
Long: GDX, VXF, UWM, and NUGT
Attachments
robo
TSP Legend
- Reaction score
- 471
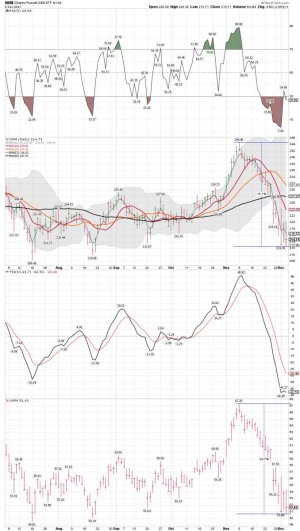
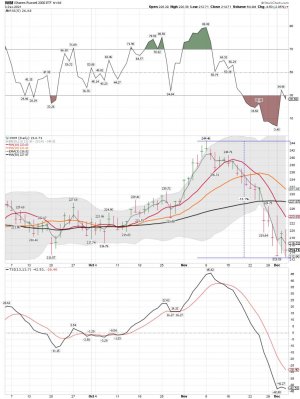
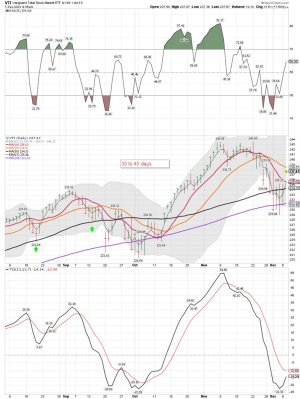
IWM daily: Remains in a downtrend as the selling continues......
I now have a small position of UWM that I bought Friday during the beat down as additional sellers throw in the towel. LOL.... That might be the correct move...... We shall see how next week plays out.
Keep in mind I'm ST trading and these positions are small. I'm playing an oversold bounce, but so far we are seeing additional selling after a gap up in the morning.
Attachments
Last edited:
robo
TSP Legend
- Reaction score
- 471
Capital Excess
John Mauldin John Mauldin
|
Thoughts from the Frontline
|
December 3, 2021
Irrational Exuberance
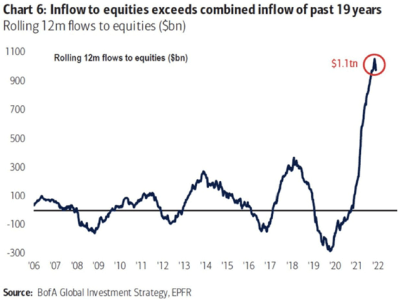
Worse, the incoming cash raises valuations at a time when other incoming cash is doing the same thing. Here’s a chart we shared in Clips That Matter last week. It shows year-over-year money flow into equities. You may notice a slight change recently.
Needless to say, but I’ll still say it: This is not normal. Everything we see about today’s markets screams “overvalued.” Let’s look at some data from my friend Ed Easterling at Crestmont Research who provides the raw numbers to, again, my friends at Advisor Perspectives (it’s good to have a lot of friends).
https://www.mauldineconomics.com/frontlinethoughts/capital-excess
Attachments
robo
TSP Legend
- Reaction score
- 471
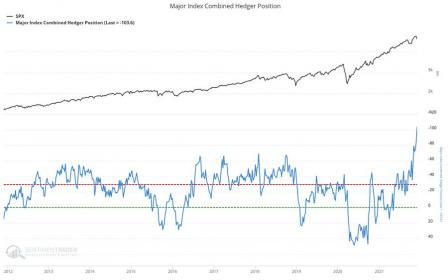
Some sure bought this dip. I did too..... We shall see how next week plays out. Like the chart John posted above......
SentimenTrader
@sentimentrader
·
Dec 3
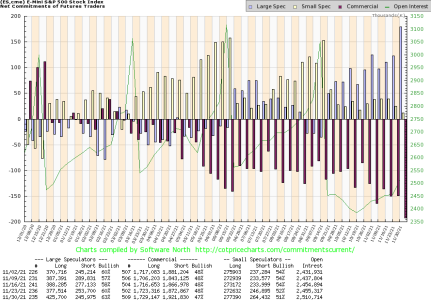
All aboard a derailed train.
This week, speculators in major equity index futures bought aggressively, moving to a net long position of over $100 billion.
That's nearly twice as large as any other position extreme, in either direction, ever.
SentimenTrader
@sentimentrader
·
Dec 3
All aboard a derailed train.
This week, speculators in major equity index futures bought aggressively, moving to a net long position of over $100 billion.
That's nearly twice as large as any other position extreme, in either direction, ever.
Attachments
robo
TSP Legend
- Reaction score
- 471
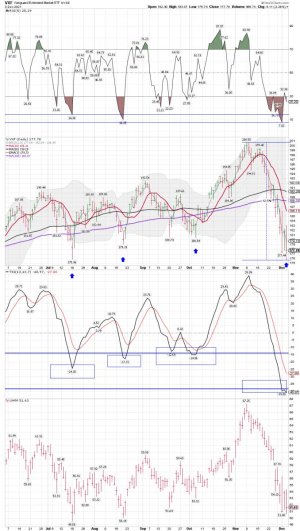
So far a nice bounce for my UWM trade..... I would like to see IWM move back above the 10 sma on a daily closing price. We shall see how the rest of the week plays out. I will post my VXF and IWM charts after the first hour of trading.
VXF before the open: Back above the 3 ema on the daily and working on the 50 sma. The 10 sma be up next and that is an important one to me for trend trading.
https://stockcharts.com/h-sc/ui?s=VXF&p=D&yr=0&mn=4&dy=0&id=p85554228307&a=1072787352
SPX - welcome to the vol puke
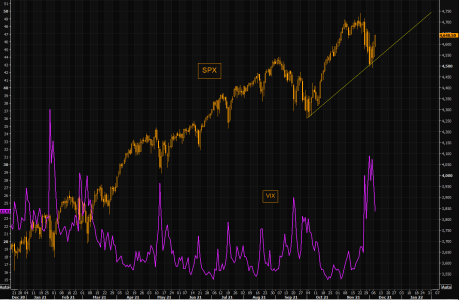
SPX is down 60 handles from all time highs and VIX is down 12% as of writing, but (still) trading at 24. Fear has been huge during this correction. On Nov 30 we outlined our short volatility logic post the VIX guy calling us with his latest ideas. We reminded our readers and we wrote: "After all, volatility is mean reverting and our VIX guy has continued holding the perfect 100% inverse track record. Will he nail it again?" So far he has nailed it, but given the fact a vol shock takes time to "feed" through the system, there should be more potential for vols to calm down.
https://themarketear.com/
Attachments
Last edited:
robo
TSP Legend
- Reaction score
- 471
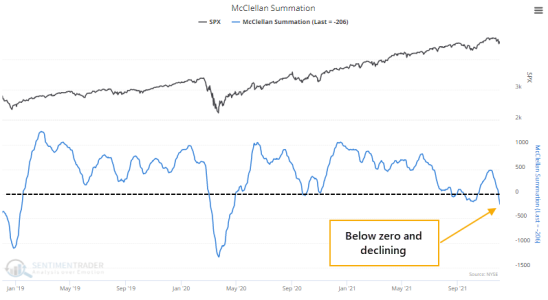
Traders are panicking the most since the pandemic
Jason Goepfert
Jason Goepfert
Published: 2021-12-07 at 07:35:00 CSTAn iffy market environment with hints of pessimism
Over the 20 years we've been publishing here, we've had the good fortune to test thousands of strategies. There is a reason we keep coming back to sentiment-related measures - because they worked more consistently over a multi-month time frame than any other.
One of the keys, however, is context. Investors behave differently during bull markets than they do during bear markets, and both of those are different than trading ranges.
For the first time since the March 2020 surge in buying interest, there is reason to question the trends underlying most securities and investors' willingness to buy the dip. Within indexes like the S&P 500, trends are mostly healthy and not unlike other pullbacks over the past 18 months. But it's a different story across the broader universe of stocks.
https://www.sentimentrader.com/blog...l&utm_term=0_1c93760246-eeaace566a-1271291994
Jason Goepfert
Jason Goepfert
Published: 2021-12-07 at 07:35:00 CSTAn iffy market environment with hints of pessimism
Over the 20 years we've been publishing here, we've had the good fortune to test thousands of strategies. There is a reason we keep coming back to sentiment-related measures - because they worked more consistently over a multi-month time frame than any other.
One of the keys, however, is context. Investors behave differently during bull markets than they do during bear markets, and both of those are different than trading ranges.
For the first time since the March 2020 surge in buying interest, there is reason to question the trends underlying most securities and investors' willingness to buy the dip. Within indexes like the S&P 500, trends are mostly healthy and not unlike other pullbacks over the past 18 months. But it's a different story across the broader universe of stocks.
https://www.sentimentrader.com/blog...l&utm_term=0_1c93760246-eeaace566a-1271291994
Attachments
robo
TSP Legend
- Reaction score
- 471
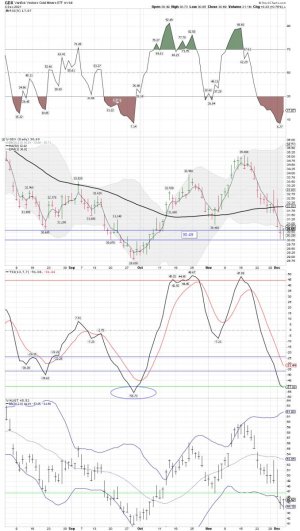
GDX daily: Above the 3 ema on the daily and the 10 sma be up next. Following stocks as BTDer's are back! Waiting to see how this week plays out...
https://stockcharts.com/h-sc/ui?s=GDX&p=D&yr=0&mn=4&dy=0&id=p47988629250&a=1027437746
https://stockcharts.com/h-sc/ui?s=GDX&p=D&yr=0&mn=4&dy=0&id=p47988629250&a=1027437746
Attachments
Last edited:
robo
TSP Legend
- Reaction score
- 471
LOL..... It's very possible, but I have been hearing this for sometime now. Maybe we are getting closer as the Fed continues to talk about reducing its buy program.
MACD, M2 And Millennials Indicate A Major Correction Is Imminent
Dec. 07, 2021 10:50 AM ET
Summary
I recently showed you a historically overvalued market that was long-term overbought and running on leverage.
Now, MACD is showing extreme readings that indicate a correction is imminent, and it could be epic.
On the liquidity front, the M2 money supply is plunging.
If you "believe in" risk management, I haven't seen these many signals and circumstances line up in 25 years.
This idea was discussed in more depth with members of my private investing community, Margin of Safety Investing.
I have run a series of articles now since August suggesting that early 2022 could be in line for a significant stock market correction. In this piece, I suggested that fundamentals, technicals, and leverage all were lining the stock market up for a correction:
https://seekingalpha.com/article/44...urce=seeking_alpha&utm_term=RTA+Article+Smart

