Bear Cave 2 (Bull Allowed)

ANALYSIS, PERSPECTIVE, TRADING STRATEGY

AT THE EDGE OF CHAOS: BACK TO THE FUTURE - WHAT IF THE COVID LOCKDOWNS SURGE JUST AS THE FED STARTS TO TAPER?

Editor Joe Duarte in the Money Options

November 21, 2021

Does it make sense for the Fed to taper as a “fourth wave of COVID” begins to develop?

Welcome to the Edge of Chaos:

“The edge of chaos is a transition space between order and disorder that is hypothesized to exist within a wide variety of systems. This transition zone is a region of bounded instability that engenders a constant dynamic interplay between order and disorder.” – Complexity Labs

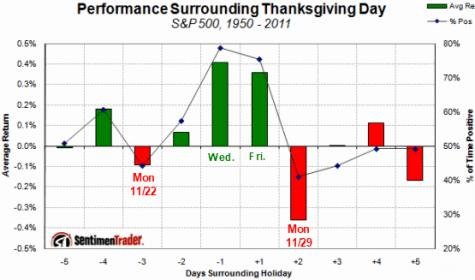
Talk about that butterfly flapping its wings, eh? Sure enough, recent events suggest that the combination of a pandemic surge occurring simultaneously with the start of the Fed’s QE tapering may be too much for the stock market to handle, despite its heading into what is usually a very positive season.

Not another Perfect Storm Please

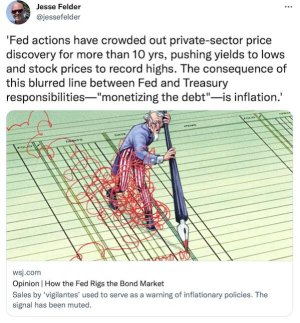
Let the games begin. The Federal Reserve will be reducing its bond purchases by $10 billion per month starting in December, formalizing the beginning of the tapering of its COVID-19 pandemic record setting QE. And while the stock market initially took the news in stride it seems as if traders are suddenly running for the exits.

https://www.joeduarteinthemoneyoptions.com/reports/TA.asp
 
Nasty Mean Reversion
Nov. 25, 2021 2:45 AM

Summary
Assets which are dramatically below fair value will have a very high likelihood of rallying toward fair value and beyond to a nearly opposite extreme, while those that have become the most overpriced relative to fair value will have a powerful tendency to plummet to fair value and beyond to a similarly undervalued bottom.

Only a tiny minority of investors will structure their net worth to anticipate this process, since when assets are the most overvalued, they appear to be the most likely to continue climbing, while assets which are the most out of favor and the best bargains will appear to be hopeless and inferior.

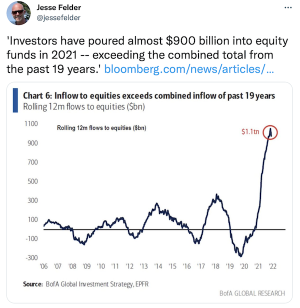
This is one of the primary reasons that we have experienced all-time record inflows into U.S. equity funds in 2021. Recent market participants are so confident that they are far more concerned about missing out on gains than they are about the risk of losing money.
https://seekingalpha.com/article/4471899-nasty-mean-reversion
 
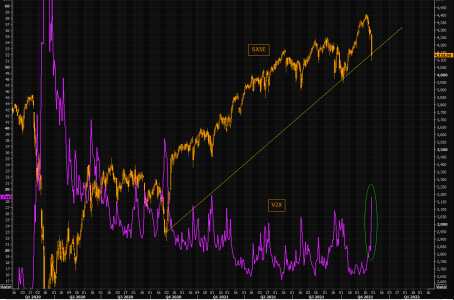
Welcome to pure panic

We haven't seen Eurostoxx 50 "VIX", V2X, spike by almost 50% in a long time. This is pure panic. Having much view on volatility here is naive, but if you ever felt like buying when there is blood on the streets, this could be one of those days...
https://themarketear.com/
 

Attachments

  • a.png
    a.png
    62.6 KB · Views: 62
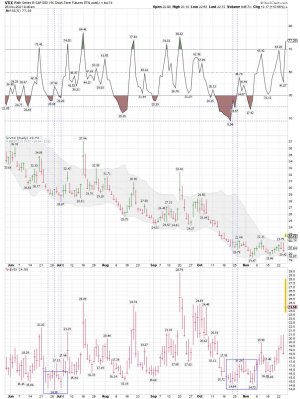
VIX under 15ish: The pattern did repeat. We shall see where it goes next. VIX gaps up tend to fill quickly as the BTDer's and the Fed weekly 80 billionish come in fairly quickly. Who knows when that will stop.

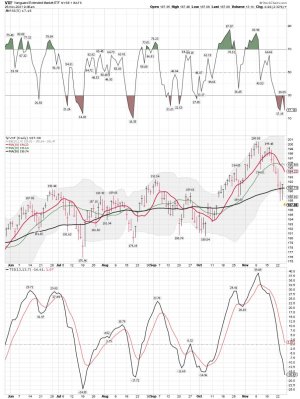
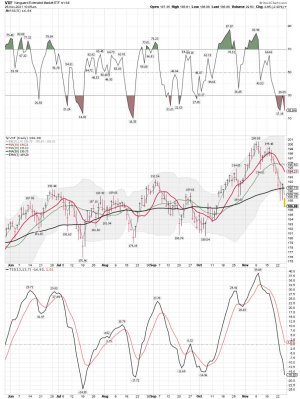
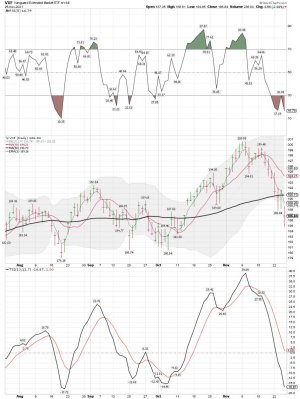
VXF daily: Close to the S Fund, and it gaped down hard below the 50 sma on the daily. We shall see if that turns out..... One would think we will see some buyers come in quickly. Patterns that moved below the 50 sma on the daily have resulted in a move back up to the upper BB in the days ahead. We shall see if it repeats again.
 

Attachments

  • a.jpg
    a.jpg
    168.2 KB · Views: 57
  • a.jpg
    a.jpg
    156.9 KB · Views: 55
  • a.jpg
    a.jpg
    159.4 KB · Views: 54
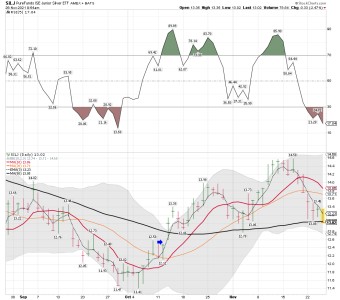
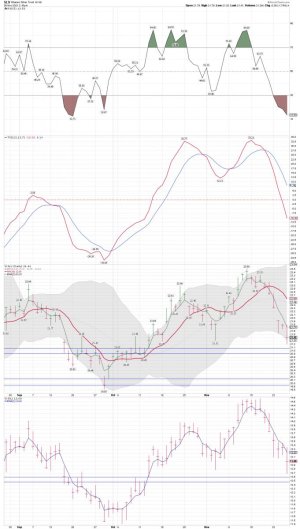
SILJ daily: Moved below the 50 sma on the daily. It's on my buy list, but haven't bought shares back yet.

I sure don't like this chart.... I want to buy some SILJ once I get the next signal.

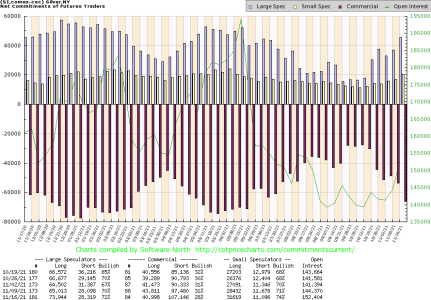
SLV (SI) Silver COT:
 

Attachments

  • a.png
    a.png
    49.7 KB · Views: 57
  • a.png
    a.png
    33.7 KB · Views: 55
The way markets are reacting to the latest variant seems a bit overblown, but maybe all those underlying issues previously ignored are finally coming to light (crypto madness, China slowdown, tax-loss selling bubble stocks, poor market breadth).
 
"The way markets are reacting to the latest variant seems a bit overblown"

I agree..... My system is now on a sell signal, so I will just wait on the next buy signal and remain mostly in a cash position. Trading a small position of SDS and VXX today based on the data.
 
This could be the start of something very ugly.

Well, it be possible. The trend is now down and has been for several days on the VXF index. It leads often. ( Under the 3 ema on the daily) So it's time to just wait and see how this plays out. Waiting on my next buy signal. This day 7 since moving below the 3 ema on the daily. That is a ST sell for me in my trading accounts. A move below the 10 sma is a confirmed ST sell signal and I buy SDS or Hedge if I plan on holding longs.

VXF daily: The S Fund is taking a pretty big smack down today.
https://stockcharts.com/h-sc/ui?s=VXF&p=D&yr=0&mn=6&dy=0&id=p70685597667&a=1069574510
 

Attachments

  • a.jpg
    a.jpg
    161.3 KB · Views: 65
Last edited:
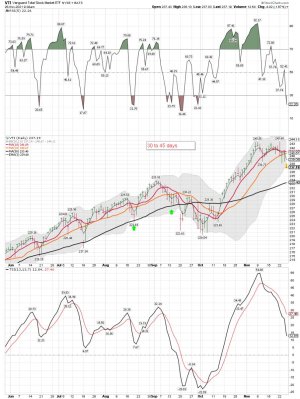
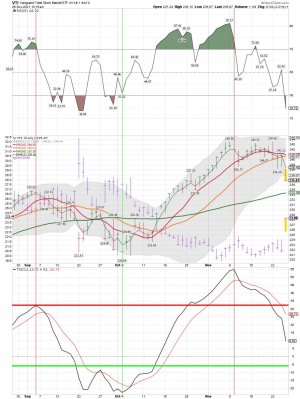
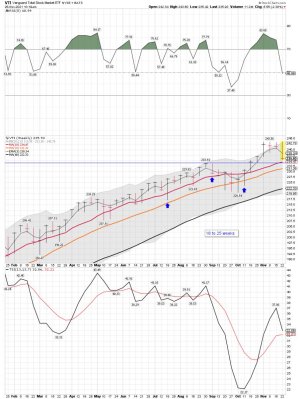
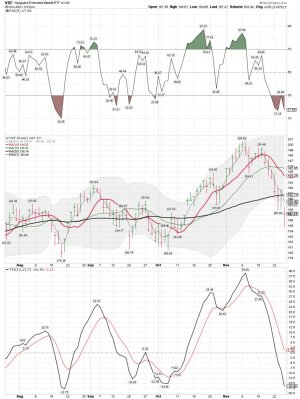
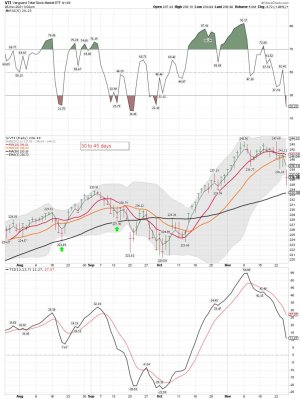
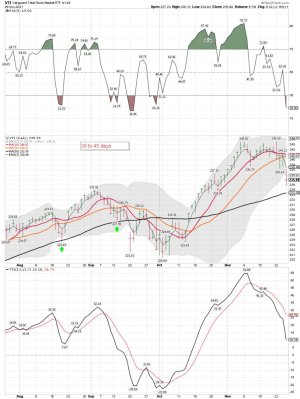
VTI weekly: Used for MT trading. VTI remains above the 10 sma on the weekly so still no sell signal for some anyway. I trade the daily, but my son uses the weekly in his TSP account. A move below the 3 ema on the weekly is a sell for me, and I don't care about whipsaws because I have unlimited moves. Those in TSP do not. When a HLC bar extends above the upper BB on the weekly it's a warning signal, and the move below the 3 ema confirm's the ST signal. We shall see where go from here. One would think that buyers will come in and hold VTI above the 10 sma on the weekly.

We are already starting to see a bounce for VTI, but VXF is having trouble. https://stockcharts.com/h-sc/ui?s=VXF&p=D&yr=0&mn=6&dy=0&id=p70685597667&a=1069574510
https://stockcharts.com/h-sc/ui?s=VTI&p=D&yr=0&mn=6&dy=0&id=p26945411051&a=1068983392
 

Attachments

  • a.jpg
    a.jpg
    155.2 KB · Views: 87
Last edited:
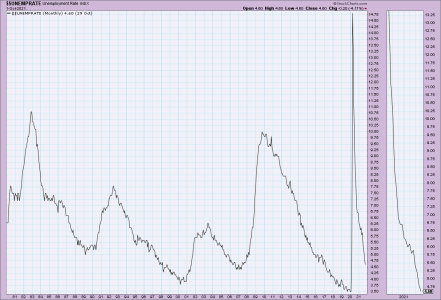
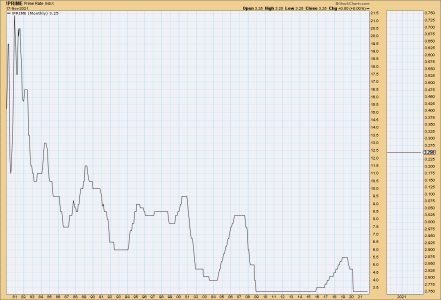
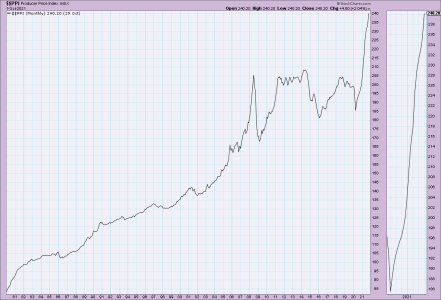
Some Historical Charts: How much longer can the Fed keep rates this low?
 

Attachments

  • a.png
    a.png
    38.8 KB · Views: 87
  • a.png
    a.png
    29.5 KB · Views: 86
  • a.png
    a.png
    29.4 KB · Views: 87
Last edited:
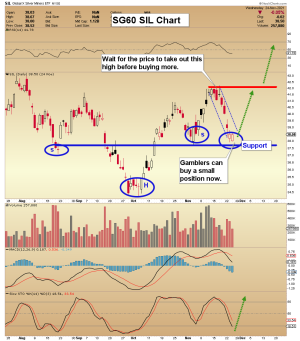
SLV daily: Remains in a down trend. My plan was to buy a few shares when the SILJ gap filled for "A TRADE" not an investment. I bought some shares @ 12.80ish. The COT for SI remains very ugly. I posted it earlier.


Gold Stocks: It's Almost Time To Buy
Morris Hubbartt


Super Force Precious Metals Video Analysis

Morris Hubbartt

Nov 26, 2021


Some comments from Morris: I DO NOT trade based on his comments or charts, but do like to look over his market thoughts.

Nov 26, 2021 Gold Stocks: It's Almost Time To Buy Morris Hubbartt 321gold ...inc ...s
https://www.youtube.com/watch?v=7sMFZkeuOMw
 

Attachments

  • a.jpg
    a.jpg
    107.8 KB · Views: 90
  • a.png
    a.png
    108.4 KB · Views: 88
Last edited:
VXF and VTI daily charts after the close: We did see some buyers come in, but we still remain in a down trend. Moves outside of the lower BB have been good buy points in the past for VXF. We shall see how this one plays out. The pattern has been to move back up into the BB and maybe a tag of the upper in the days ahead. Buyers and sellers make these patterns I just trade what I see.....

Bottom Line: VXF and VTI are both in a down trend so I'm in a cash position. However, VXF is more oversold, (S Fund) but Tom's chart indicated we might still be under some extra selling pressure next week.
 

Attachments

  • a.jpg
    a.jpg
    144.7 KB · Views: 93
  • a.jpg
    a.jpg
    22.2 KB · Views: 86
  • a.jpg
    a.jpg
    140.5 KB · Views: 94
Oil Game Changer

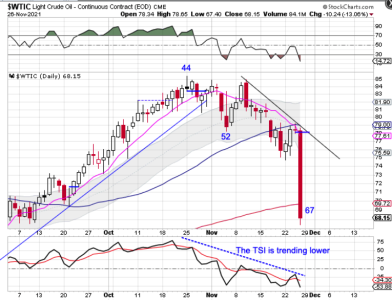
Oil dropped over 13% on Friday to extend its daily cycle decline.
Oil printed its lowest point on Friday, day 67, placing oil very deep in its timing band for a DCL. At this late stage of the daily cycle, a swing low and close back above the 200 day MA will have good odds of marking the DCL.

So, while oil could potentially begin a new daily cycle next week, Friday’s huge drop is a game changer that will likely send oil into an intermediate and yearly cycle decline. Which I further discuss in the Weekend Report.
https://likesmoneycycletrading.wordpress.com/2021/11/27/oil-game-changer/
 

Attachments

  • a.png
    a.png
    130.4 KB · Views: 85
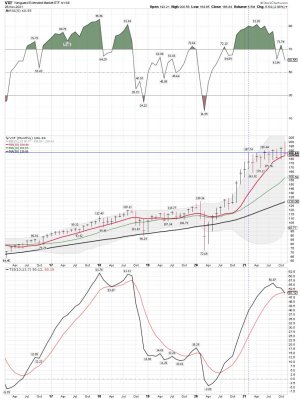
VXF monthly: Remains below its February high...... Still, if you are an investor and use the monthly data we still don't have a sell signal. The trend remains above the 10 sma on the monthly.
 

Attachments

  • a.jpg
    a.jpg
    145.8 KB · Views: 89
VXF and VTI daily trends: If you trade or make moves using the daily data like I do, you would be in a cash position for these two indexes. Day 7 of the move lower for VXF.
( Trending below the 3 ema ) A nice bounce off the lows before the close Friday, so we shall see how next week plays out.
 

Attachments

  • a.jpg
    a.jpg
    142.3 KB · Views: 98
  • a.jpg
    a.jpg
    140.4 KB · Views: 101
Back
Top