Bear Cave 2 (Bull Allowed)

LOL...... Just BTD! Extremes continue to get more extreme.....

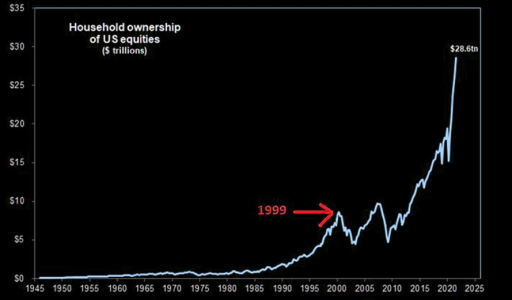
Household ownership of equities: closing in on $30 trillion
 

Attachments

  • a.png
    a.png
    134.9 KB · Views: 64
Heard someone talking about a similar chart to above and they said it's mostly Boomer wealth that continues to compound. Gen-X'ers are close, but nowhere near. Millenials and below are a blip on the radar. Younger generations can make 100% on a $10,000 crypto trade, but that's still less money than someone who "only" makes 3% on a $340,000 portfolio with less risk and very low chance of loss.

I wonder what happens when those who bought SPXU in preparation for an October crash decide to finally hit the stop loss button.
 
LOL..... I'm tracking a few dudes that have a 25% position or higher using SPXU. Since some are all in they can't even add position's unless they borrow money. Maybe they will borrow money against their extremely over valued house's and buy some more SPXU. I remain debt free and trade much smaller positions these days.

Bottom Line: The trend remains up until it's not.

Take Care Brother!
 
Last edited:
When Bubble Meets Trouble
Print Friendly, PDF & Email


John P. Hussman, Ph.D.
President, Hussman Investment Trust

November 2021

"I think it’s clear that we’re deep into bubble territory. Bubbles are characterized typically at the end of a long bull market by a period where they accelerate, and they start to rise at two or three times the average speed of the bull market, which they did last year of course. Of course, they’re always extremely overpriced by average historical standards. There are a few people who would still argue that 2000 was higher, but most of the data suggests that this is the new American record for highest priced stocks in history. Then there’s the most important thing of all, which is crazy behavior, the kind of meme stock, high participation by individuals, enormous trading volume in penny stocks, enormous trading volume in options, huge margin levels, peak borrowing of all kinds, and the news is on the front page. This is all characteristic of the handful of great bubbles that we’ve had.

We’ve checked off all the boxes. Now the question is how high is high? Very hard to tell always what the peak will be, but what you do know is that how high the peak is has no bearing at all on what the fair value is. What it does change is the amount of pain that you get to go back to fair value and below. You profoundly do not wish for a super high level to your bubble, and you profoundly do not wish for more than one asset class to be bubbling at the same time. I’ve been very clear about what I consider a definition of success – and that is only that, sooner or later, you will have made money to have sidestepped the bubble phase.

You can very seldom identify the pin that pops it. 1929, no one has agreed yet what the pin was. The biggest cage rattler of all is everything else you haven’t thought about that could go wrong. And my guess is that’s probably the cause, in the end, of most of the bubbles deflating. The mechanics of a bubble is you have maximum borrowing, maximum enthusiasm. And then the following day, you’re still enthusiastic but not quite as enthusiastic as yesterday. A week later, you’re not quite as enthusiastic as last week and last month. And gradually, the enthusiasm level drops off a bit, you have no more money to borrow, you’re fully borrowed, and the buying pressure gradually slows down. And that’s it.

The next time we’re pessimistic, we have more potential to write down asset prices than we have ever had in history, anywhere."

– Jeremy Grantham, GMO, The Top of the Cycle, August 2021
https://www.hussmanfunds.com/comment/mc211108/
 
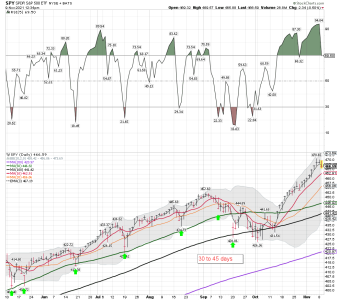
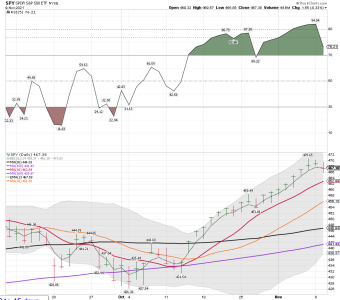
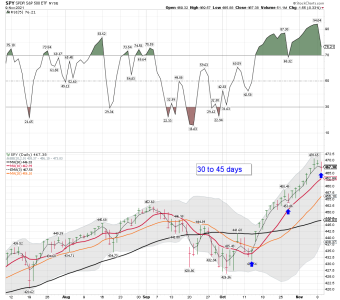
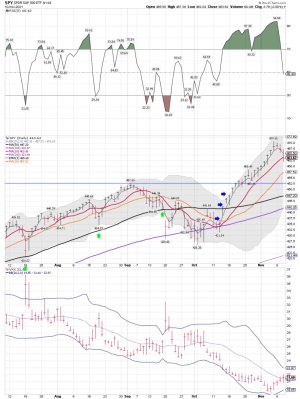
SPY daily: There hasn't been much to say lately after starting a new cycle, except the trend remains up. Will this be a back test of the 10 sma on the daily chart? For now SPY be testing the 3 ema on the daily..... We shall see how this plays out.
 

Attachments

  • a.png
    a.png
    59.7 KB · Views: 55
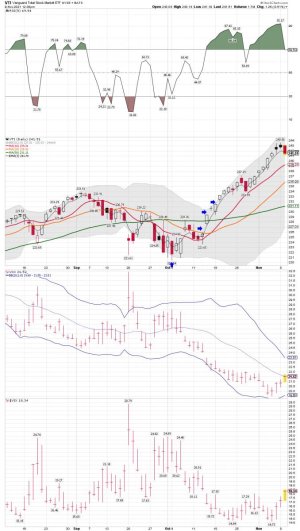
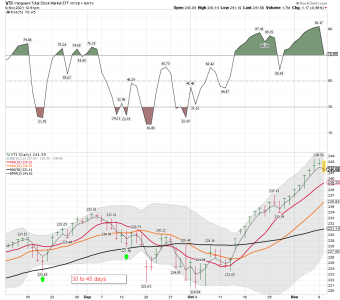
VTI daily: Still no sell signal..... Waiting a watching since I already reduced on the way up after the buy signal. For those that read my comments you know I trade using the Total Stock Market at Vanguard. (VTI)
 

Attachments

  • a.jpg
    a.jpg
    121 KB · Views: 55
VTI daily: A move below the 3 ema on the daily so I'll be watching closer for a possible SDS trade. You can see what happened the last time we closed below the 3 ema on the daily. However, we are deeper into the daily cycle this time. I have to see a confirmed sell before I reduce or add. That is a move below the 10 sma on the daily. That doesn't mean I will not get whipsawed, but I just take the trades when I get the signals.

Good Trading to those that have trading accounts. If you have a trading account it should be a Roth IRA in my opinion.


Yes Sir! The comment below is possible, but my Risk Management data keeps me trading much smaller right now.

Pass the Popcorn at these levels!

Could, not should...
With the obvious risk of now being accused of "becoming bullish at the top", we still wanted to list a couple of things that could elude to that there actually could be more immediate upside in the equity markets. Or to put it in another way, that this could get even more stretched and crazy. Emphasis is on "could"...not that it will...

This "all-time-high" measure could actually get better
The market is at all-time highs, but the 12-month rolling number of new S&P 500...

https://www.zerohedge.com/premium?u...campaign=premium&utm_content=tme_website_link
 

Attachments

  • a.png
    a.png
    47.6 KB · Views: 58
  • IMG_1960.JPG
    IMG_1960.JPG
    24.3 KB · Views: 57
Last edited:
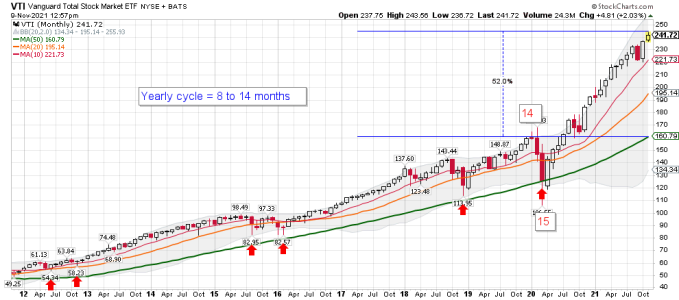
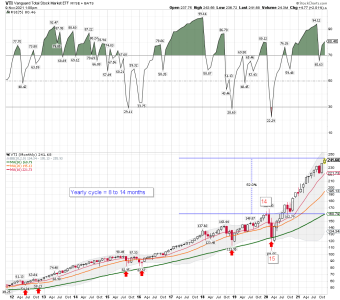
VTI monthly: Trend traders don't try and pick tops, but I sure reduce based on the daily cycle data.

The trend remains up!

Ok, thanks for the warning...... How many of these have you heard the last several months. Still, this not a time to be all in using leverage.

With asset prices soaring, we’ve made the difficult and contrarian decision to lower our sails and reduce risk.
Based on current prices, we believe investors are dismissing the substantial risk associated with extraordinarily expensive valuations combined with unsustainable monetary and fiscal policies.
After comparing our calculated business valuations to current equity prices, we see little reason why stocks could not have similar declines to those experienced after the technology and housing bubbles popped.
In fact, given current valuations and the unstable foundation on which they stand (ability to maintain monetary accommodation in an inflationary environment), we believe the potential downside in equity prices has never been greater.
--Eric Cinnamond, "Gone With the Wind", PalmValleyCapital.com, November 4, 2021.
 

Attachments

  • a.png
    a.png
    24.9 KB · Views: 58
  • a.png
    a.png
    47.5 KB · Views: 57
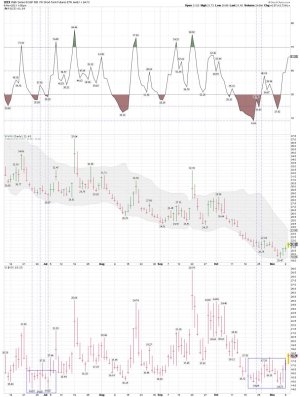
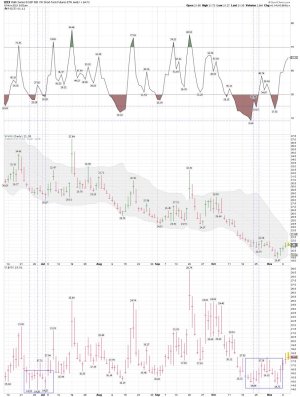
VIX daily: Hummmmm...... Something I track using patterns. Any move that the VIX moves under 15ish....

VIX dropped several times below 15 in recent weeks.


Throughout 2021 VIX has fallen numerous times below 15 but so far hasn't dropped below 14. VIX has also remained above its lowest points from recent years. This is typical of how VIX behaves during a transition from a bull to a bear market for U.S. equities. TLT, the U.S. dollar, the Japanese yen, options trading (especially the paucity of put buying), and similar signals which have been reliable for decades are sending a consistent signal. Just like the all-time record ratio of insider selling to insider buying, combined with by far the most intense market inflows in history by a large multiple, these are all signaling very choppy waters ahead when the vast majority of sailors are expecting smooth sailing.

Kaplan
 

Attachments

  • a.jpg
    a.jpg
    155.1 KB · Views: 66
SPY daily after the close: A close right at the 3 ema...... We shall see if buyers come in tomorrow or if the 10 sma on the daily chart is going to do play catch up. Getting deeper into the daily cycle so a BT could be coming our way.

Bottom Line: The SPY trend remains UP!
 

Attachments

  • a.png
    a.png
    40.2 KB · Views: 64
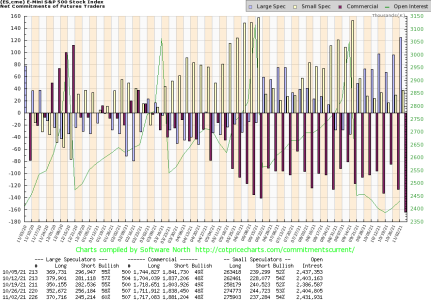
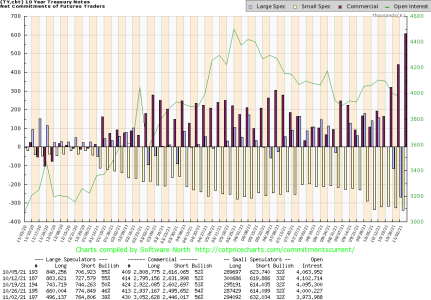
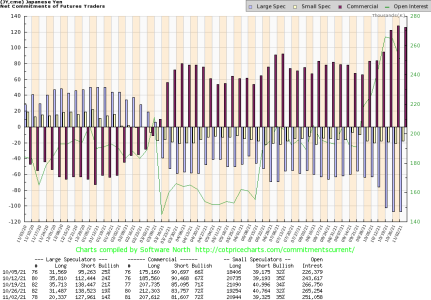
We shall see if these COT charts matter in the weeks ahead.
 

Attachments

  • a.png
    a.png
    44.5 KB · Views: 61
  • a.png
    a.png
    35.2 KB · Views: 59
  • a.png
    a.png
    34.5 KB · Views: 59
Love your SPY chart! Thank you! Do you use 3-day Ema to ID possible exit points?

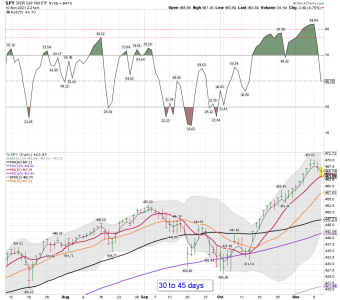
SPY daily after the close: A close right at the 3 ema...... We shall see if buyers come in tomorrow or if the 10 sma on the daily chart is going to do play catch up. Getting deeper into the daily cycle so a BT could be coming our way.

Bottom Line: The SPY trend remains UP!
 
Yes I do, and a move below the 10 sma gets my attention. I also use it for turning points after selloffs. We shall see if we move below the 10 sma or bounce some. Keep in mind I'm tracking and using cycles as tools too for Risk Management with my trend trading. Tuesday was day 26....

A warning signal below from a cycle guy..... You can BT it on the chart below. I'm using the daily closing prices, and a move below the 10 sma on the daily and I sometimes buy SDS. Trend trading doesn't always work, and I haven't always been a trend trader. However, in this market it's been easy to make money, because there are so many BTDer's and moving the market higher. Someday that will change..... We shall see how this daily cycle (DCL) plays out. A quick pullback and then another ATH, or maybe a move down to the 20 sma or lower.

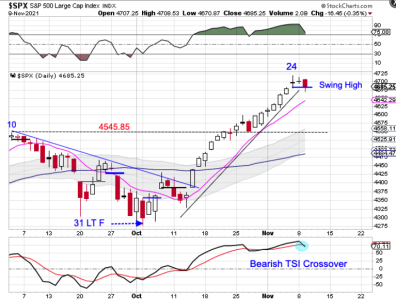
Stocks Form A Swing High

Stocks formed a swing high on Tuesday.

Tuesday was day 26 for the daily equity cycle. That places stocks 4 days shy of their timing band for a DCL. Any bearish follow through should send stocks into their daily cycle decline. A daily cycle decline would allow stocks to backtest the breakout level and allow sentiment to cool off. This would set stocks up to emerge from a DCL heading into the most bullish time of the year. Stocks are currently in. a daily uptrend. If they form a swing low above the lower daily cycle band then they will remain in their daily uptrend and trigger a cycle band buy signal.
https://likesmoneycycletrading.wordpress.com/2021/11/09/stocks-form-a-swing-high/
 

Attachments

  • a.png
    a.png
    121.2 KB · Views: 64
  • a.png
    a.png
    52.5 KB · Views: 66
SPY daily: Tagged the 10 sma on the daily. BTD or is there something bigger getting ready to happen? We shall see, as buyers are already coming in. We shall see how we close.

Keep an eye on the breadth data......

SevenSentinels
@SevenSentinels
·
52m
Wednesday 1:30
SS LOLR STS
Up Down Up
5/2 1/6 2/5

Breadth: -900/-1100

NYSE McO: 42
NASDAQ McO: 3
https://twitter.com/SevenSentinels?ref_src=twsrc^google|twcamp^serp|twgr^author
 

Attachments

  • a.png
    a.png
    55 KB · Views: 60
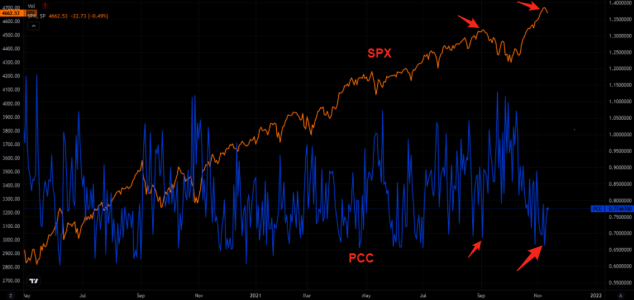
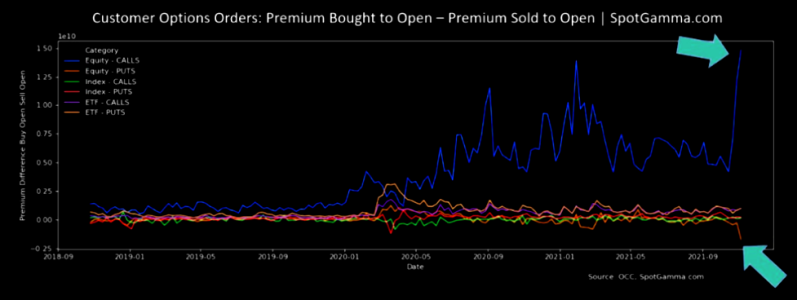
People hated puts when they should have loved them
We saw people puke puts just in time for the reversal.

Nothing new really, but it adds to the complex psychology of this market.
https://themarketear.com/
 

Attachments

  • a.png
    a.png
    155.9 KB · Views: 61
Not only did they hate puts...
...they had to sell them short and load up on calls.

This is just a gentle reminder of one of the most important charts out there, if not the most important.

Greed has become so big, driving people into shorting puts and putting all that premium into calls.

Humans have come a long way, but greed and fear never changes...
https://themarketear.com/
 

Attachments

  • a.png
    a.png
    94.1 KB · Views: 62
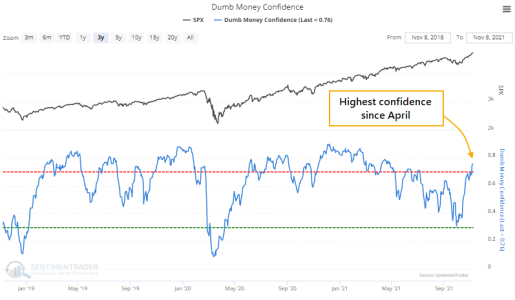
Dumb Money Confidence has made a furious comeback - of course it did! We are now in the best six months.....


Dumb Money Confidence has made a furious comeback
The dumb money is confident again.

After a streak of optimism, Dumb Money Confidence turned pessimistic at the end of September. The ends of other long streaks of optimism led to higher prices, as buyers finally saw a good chance to step in.

The lack of optimism didn't last long, and now it's back to an extreme. On the lower end of that threshold, but still.

https://www.sentimentrader.com/blog...l&utm_term=0_1c93760246-e2f7e299ce-1271291994

SPY daily: It looks like a gap up and back above the 10 sma on the daily. Just BTD remains in play.....

LOL..... Not many bears left these days.....


Sven Henrich
@NorthmanTrader

5m
"they don't ring a bell....."
Quote Tweet
*Walter Bloomberg
@DeItaone

*PERMA BEAR RUSSELL CLARK TO SHUT HIS HEDGE FUND
https://vimeo.com/644550919/b2b5258...&utm_medium=email&utm_source=Revue newsletter
 

Attachments

  • a.png
    a.png
    58.2 KB · Views: 61
  • a.jpg
    a.jpg
    146.2 KB · Views: 62
Last edited:
Back
Top