Bear Cave 2 (Bull Allowed)

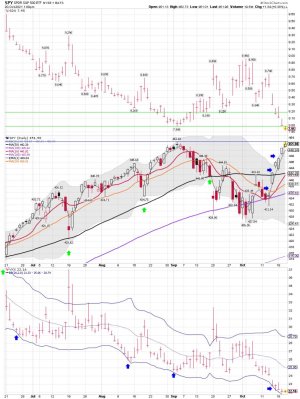
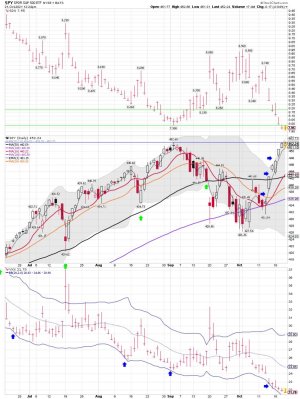
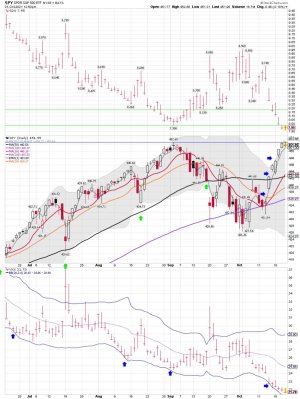
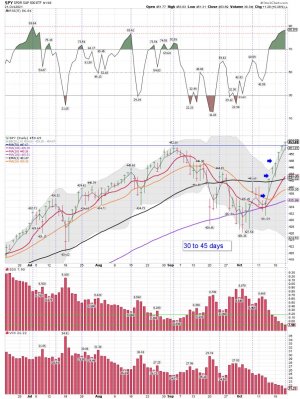
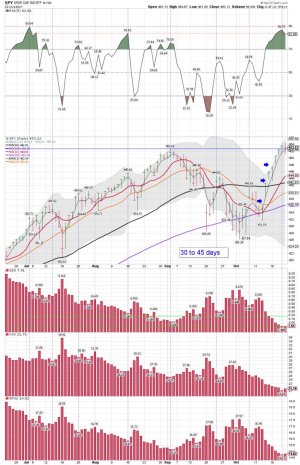
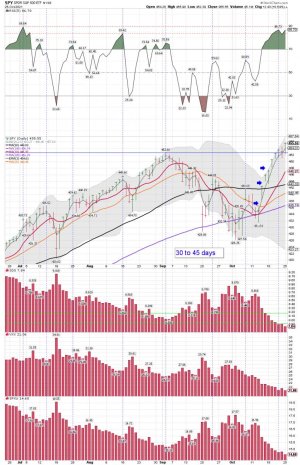
SPY daily: Ok, we be testing the 452.60 marker...... We shall see how it plays out.....

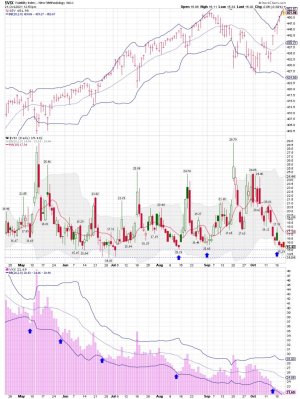
Bottom Line: The SPY trend remains up, but the ST data for the VIX remains a concern. I'm going to reduce a tad more and add to my beer money protection trade. Buying some VXX...... That be a small position.....

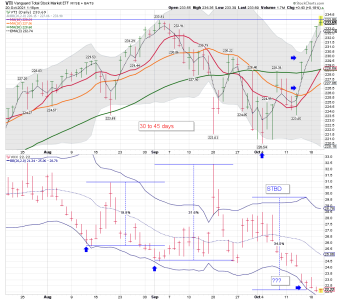
VTI daily: The trend remains up!
 

Attachments

  • a.jpg
    a.jpg
    157.3 KB · Views: 87
  • a.png
    a.png
    49.4 KB · Views: 83
Last edited:
Nasdaq and anything tech down today. The "take out a HELOC to buy stocks crowd" must be switching to bitcoin ETF's today.
 
Jesse Felder Retweeted
Tom McClellan
@McClellanOsc
·
6h
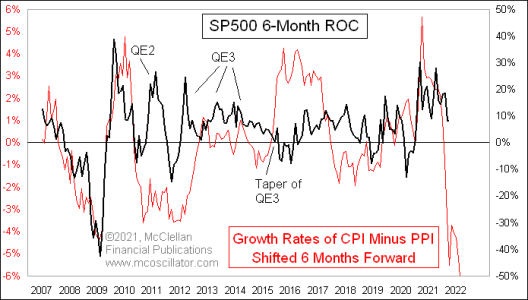
This relationship is not a perfect correlation, but it is a really interesting one. It has gone off track when the Fed puts a thumb on the scale.
https://twitter.com/jessefelder
https://twitter.com/McClellanOsc

Jesse Felder Retweeted
David Rosenberg
@EconguyRosie
·
10h
Atlanta Fed down to -1.6% SAAR for Q3 real final sales. It was +2.3% at the end of July. At no point in the past 70 years have they contracted this much without a recession taking hold. We'll just have to be patient and wait for Wile E. Coyote to start looking down.
 

Attachments

  • a.png
    a.png
    11 KB · Views: 71
  • a.jpg
    a.jpg
    72.8 KB · Views: 72
SPY daily: Another go at the ATH...... SPY remains stretched above its 10 sma on the daily chart. Looks like more sideways action while it catches up or a quick shakeout lower to test it is possible.

Bottom Line : The trend remains up as we get deeper into the current daily cycle.


Update: The pullback into the half cycle low is getting closer..... Not a time to chase or add to your SPY position just yet in my opinion. I have been peeling off some profits as we moved higher and tested the all time highs.

VXX daily: Continues to get cheaper..... LOL.... Who needs protection in this market! A waste of money.....
 

Attachments

  • a.jpg
    a.jpg
    162.2 KB · Views: 64
  • a.jpg
    a.jpg
    158.8 KB · Views: 63
Last edited:
Update: The pullback into the half cycle low is getting closer..... Not a time to chase or add to your SPY position just yet in my opinion. I have been peeling off some profits as the SPY has been moving higher and testing the all time highs. I have not made any money on my beer money trades using VXX as it continues to be smashed lower. I use VXX as a hedge sometimes, but call them Beer Money Trades because they are small.....
 

Attachments

  • a.jpg
    a.jpg
    161.7 KB · Views: 70
  • a.jpg
    a.jpg
    180.5 KB · Views: 71
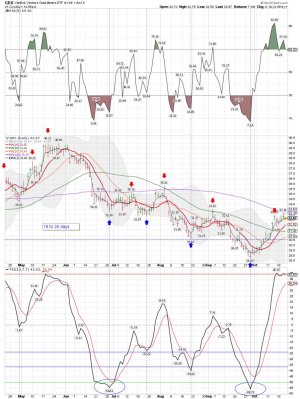
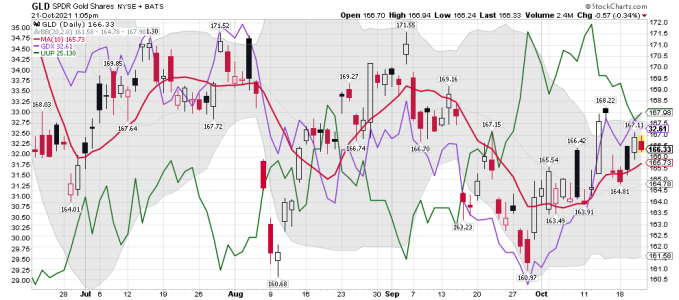
GDX daily: A NICE RUN...... I'm expecting some sideways action or a pullback into the half cycle low....

The TSI pattern is clear to me and I use it as an indicator for trading in this sector. I don't buy when the TSI is getting close to (+50) I take some profits. I like to buy when TSI is getting close to (-50) which I did. That is why those red and green lines are on the chart ( -50 and +50 ) One is for adding shares and the other is for reducing. I use other tools too..... The TSI data is more like a warning signal that a buy or sell/add or reduce shares is coming. Keep in mind I mainly waiting extremes to trade in this sector. LOL..... Normally you get one a few times a year.... Just using TSI for trading is not going to get it. That can be seen on the current patterns on the daily chart below. Charts don't tell you everything, but they can help you track things. Since I'm a trend trader and a cycle tracker they are useful for tracking the indexes I like to trade. I also like to use them for tracking ratios. Like the dollar and GLD.

Good trading to those trading this sector. It is NOT EASY to trade.
 

Attachments

  • a.jpg
    a.jpg
    180.7 KB · Views: 66
  • a.png
    a.png
    48.4 KB · Views: 65
  • a.png
    a.png
    47.3 KB · Views: 65
Last edited:
LOL..... It sure looks that way! (See comments below)

Bottom line: The SPY trend remains UP!

Buy the dip. Buy the rip

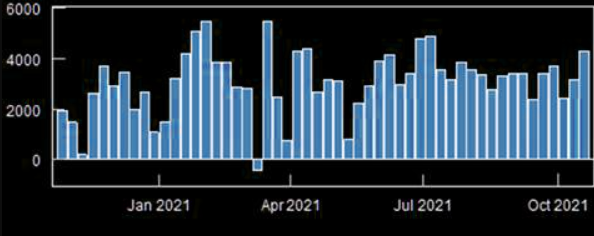
Last week, retail market order imbalance saw a net buying of +$4.3B, the highest weekly inflow since July, and coincided with a Tuesday-to-Tuesday weekly Russell 3000 return of 3.8%, the strongest performance since November 2020.

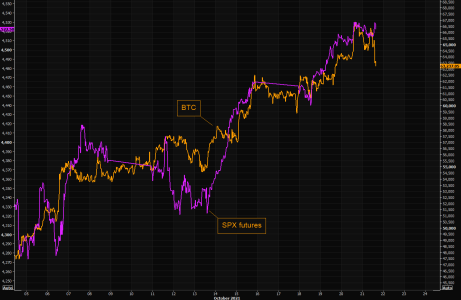
Watch Out If The Bitcoin "Narrative" Is Driving Everything?
If that is the case, then maybe equities are getting short term "stretched"?

BTC vs SPX in October is basically the same chart...until recently.
https://themarketear.com/

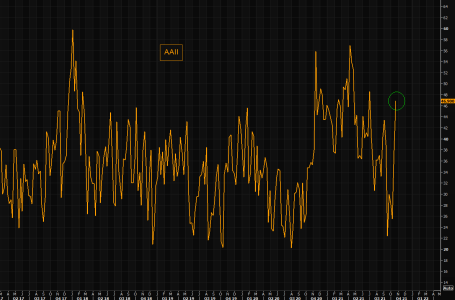
Finally The Bulls Are Joining In
Latest AAII bullish sentiment readings show bulls are back from hibernation. We ask ourselves if our "VIX guy" is included in this survey?

Sharp move to the upside, but do we need to test recent highs before anything meaningful occurs to the downside?
 

Attachments

  • a.png
    a.png
    70.2 KB · Views: 65
  • a.png
    a.png
    53.5 KB · Views: 64
  • a.png
    a.png
    27.9 KB · Views: 63
SPY daily: What's not to like? Another ATH and VXX continues to get smashed down..... There just isn't much Fear out there right now....


SPY after the close: It looks nice, but remains stretched over the 10 sma on the daily chart for those of you that use Risk Management.

LOL..... Guess what is coming up? "Free Lunch Friday" and "Easy Money Monday"

We shall see how that plays out...... Sure, there is lots of crap to worry about, but I just trade the trend and ignore all the noise. I treade what is happening and not what I think will happen. LOL..... If you are an investor you have a lot to worry about right now.

Bottom Line: The trend for the SPY remains up and it just made another ATH. That is what I see...... and I trade what is happening.

For the record: I have sold most of my long positions and will be going flat shortly after the close.

I don't think anyone even cares about the data below from this tweet. However, traders use to care about it before we had all this money coming into the market from the Fed.

SevenSentinels
@SevenSentinels

1h
3 PM

SPX Tests ATH Via Nearly 1000 Net Declines
https://twitter.com/SevenSentinels?ref_src=twsrc^google|twcamp^serp|twgr^author
 

Attachments

  • a.jpg
    a.jpg
    201.9 KB · Views: 66
Last edited:
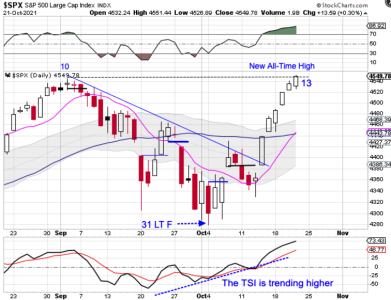
Stocks closed at a new all time high on Thursday.

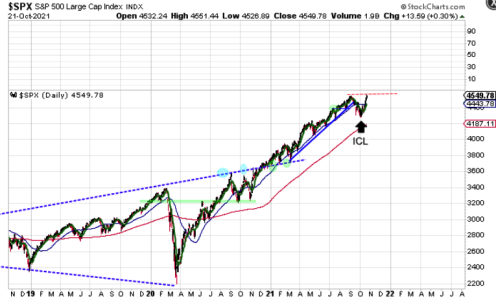
Quite frankly I was a bit surprised to see stocks close above the pervious all time on the first try. Still, stocks are quite stretched above the 10 day MA. They may require some consolidation to allow the 10 day MA to catch up to price.

The decline into the ICL has stretched the ‘elastic band’ lower. This quick recovery is a very good sign. A bullish break higher could trigger a final melt-up phase.

https://likesmoneycycletrading.wordpress.com/2021/10/21/stocks-ready-to-cross-the-line/
 

Attachments

  • a.png
    a.png
    124.7 KB · Views: 62
  • a.png
    a.png
    88.9 KB · Views: 62
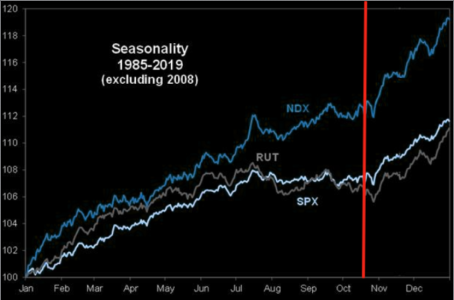
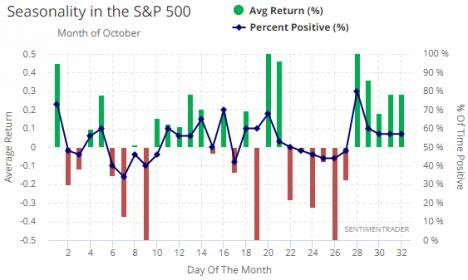
Hmmmm..... I agree we are coming into the best 6 months, but the SPY remains stretched above the 10 sma on the daily in the ST. Note the chart Tom post's on his daily reports. Next week looks to have a poor seasonality pattern. We shall see how it plays out. I don't use this data for trading, but do track it.

Seasonality Is Huge
Q4 is bullish, period. As BofA notes, "75 of past 95 years = Q4 rally in S&P".

According to BofA we have only had 7 negative Q4's since the 1987 crash...almost all were associated with some sort of a "wobble" in credit.

Everybody is now bullish the seasonality pattern. Is this when it stops to work?
https://themarketear.com/
 

Attachments

  • a.png
    a.png
    195.9 KB · Views: 55
  • a.jpg
    a.jpg
    20.9 KB · Views: 54
  • a.jpg
    a.jpg
    184.4 KB · Views: 55
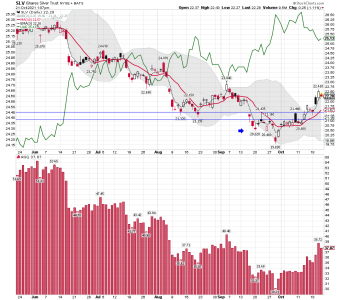
How will you trade or invest if this is just the start of a Commodity Bull? What happens to rates? Did you know I bonds look to head to over 7% returns soon? Got any I bonds? I'm still holding some SLV..... The miners are looking good too.... That is how I will trade it....

Some opinions about the markets. I just trade the trend......

Commodity bull should still have 5-7 years to go

https://www.youtube.com/watch?v=6sIqN_Lllns&t=11s


Gold update: Don’t get complacent

https://www.youtube.com/watch?v=TQWcVgb-eZM

Stocks Surge As Earnings Roll-In, But Is Risk Gone? 10-22-21
by Lance Roberts | Oct 23, 2021 | alerts, Markets/Economy, Real Investment Advice

Our concern is that while the expected rally from support occurred, there has been very little “conviction” to that advance. Therefore, we tend to agree with David Tepper of Appaloosa Management when he stated:

“Sometimes there are times to make money…sometimes there are times not to lose money.“

While the market is within the seasonally strong year, the risk of a correction remains. Such is particularly the case as we head into 2022.
https://bullsnbears.com/2021/10/23/stocks-surge-as-earnings-roll-in-but-is-risk-gone-10-22-21/
 
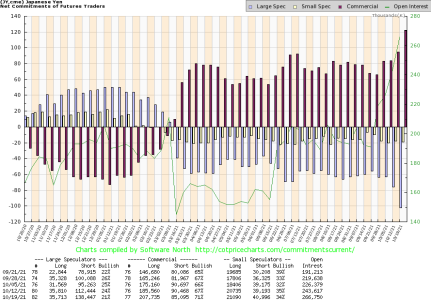
COT: One I'm watching closely. This is NOT what you want to see......

https://cotpricecharts.com/commitmentscurrent/

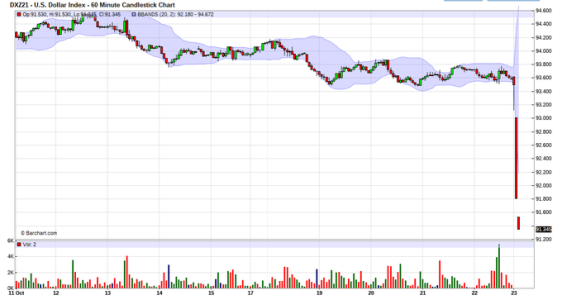
Hmmmmm...... "Amid anxiety about global growth, the yen is soaring. The currency is racing higher as investors look for safe places for their money."

We shall see how this plays out. Why do I always say that. Well, because my Magic 8 Ball is broken, and I don't know for sure how it play out.
 

Attachments

  • a.png
    a.png
    34.7 KB · Views: 83
  • magic8ball.jpg
    magic8ball.jpg
    82.7 KB · Views: 86
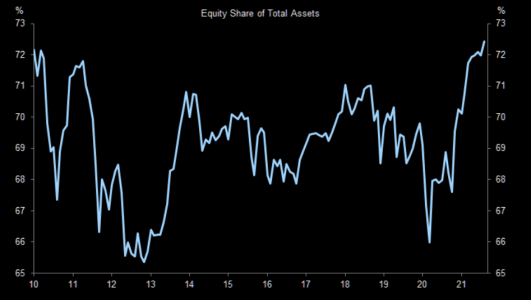
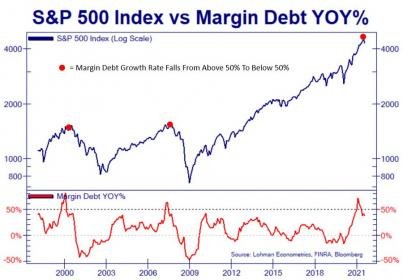
Ok, another data point to watch? Maybe! The data on the chart indicates we could see some trouble ahead. However, in this market one never knows for sure. Plenty of stuff investors will have to look over.

Jesse Felder Retweeted
Not Jim Cramer
@Not_Jim_Cramer


16h
Margin Debt Growth Rate Falls Below 50%...
https://twitter.com/jessefelder
 

Attachments

  • a.jpg
    a.jpg
    20.5 KB · Views: 89
  • a.png
    a.png
    338.5 KB · Views: 90
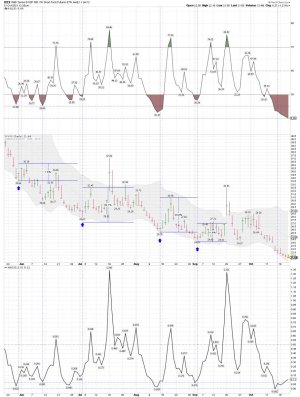
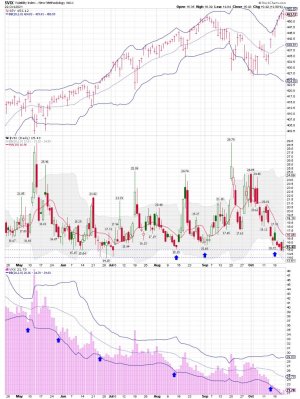
VIX daily: LOL.... My VXX Beer Money trades have been losers lately..... You can see why on my tracking chart below.... The VXX has been smashed down...

Tom McClellan
@McClellanOsc

Oct 22
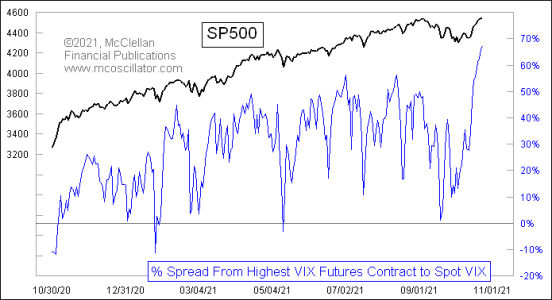
Spot VIX Index at 14.96 at the moment, but its most expensive futures contract is June 2022 at 24.95. That creates the biggest such spread since 2017. It means the VIX futures traders are not agreeing with the bullish SP500 options traders who are driving down the spot VIX.
 

Attachments

  • a.png
    a.png
    7.8 KB · Views: 92
  • a.jpg
    a.jpg
    181.7 KB · Views: 95
Time To Raise Stops
Posted on October 25, 2021

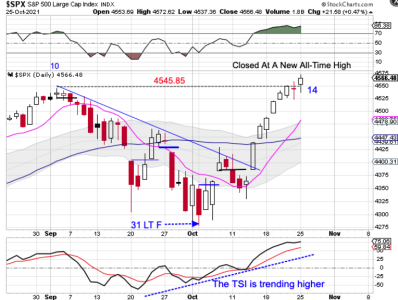
On Thursday we discussed that stocks were ready to cross the line. Well, stocks closed above the previous daily cycle high on Monday.

Stocks are only on week 3 for their new intermediate cycle. Monday was only day 14 for the new daily cycle. Right translated cycles often peak on or after day 30. So stocks are breaking out to new all time highs early in the intermediate cycle with still plenty of time in the current daily cycle. And the holiday season is right around the corner which is typically one of the most bullish times of the year. Stops can be raised to a close below the previous daily cycle high of 4545.85.
 

Attachments

  • a.png
    a.png
    126.2 KB · Views: 84
  • a.jpg
    a.jpg
    186.6 KB · Views: 86
The 1 Trillion Dollar Inflow
Global Equities logged >$1 Trillion dollars worth of inflows during the last 51 weeks and the start of positive vaccine news. This is the biggest market structure dynamic of the year. For context, the prior best rolling 51 week record was +$250 Billion. 2021 is 4x larger than the next best yearly inflow.

Scott Rubner (GS): "I think the equity TINA money flow train keeps charging to close the year and accelerates aggressively in November. I calculate a significant, +$18B worth of non-fundamental equity demand every day this week and this increases with massive November monthly inflows and corporate demand after >47% of the S&P reports next week" . And remember - a large portion of every inflow dollar goes to Big Tech. (Goldman trading desk).
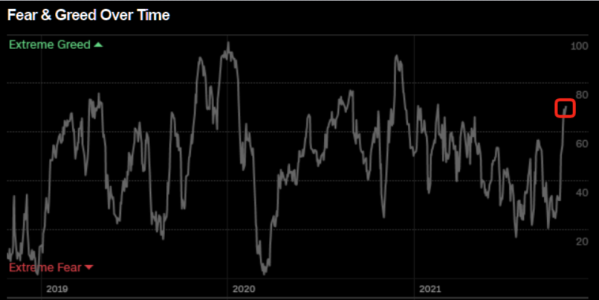
Greed - Welcome Back
Inflows are huge and people are forced to chase this market higher.

Time for some extreme greed before the "top"?
https://themarketear.com/
 

Attachments

  • a.png
    a.png
    89.1 KB · Views: 84
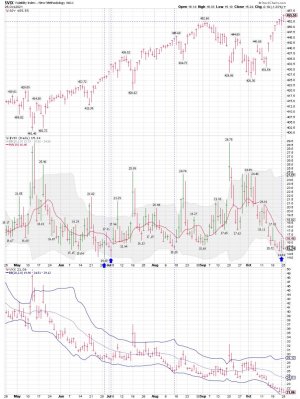
VIX daily: Another move under 15ish..... LOL... NO FEAR! VIX moving under 15 could mean it is close to a ST bounce.

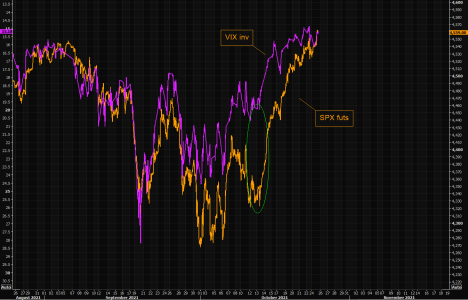
SPX - The Relatively Exuberant One
Recall when VIX was the exuberant one during the early part of the latest melt up?

Those days are gone. SPX has caught up fully and the "gap" between the two is gone. As a matter of fact, VIX has done very little over the past days, despite SPX printing new highs.

VIX has a "natural floor"...so do not expect VIX to move much lower.
 

Attachments

  • a.png
    a.png
    55.7 KB · Views: 85
  • a.jpg
    a.jpg
    176.2 KB · Views: 87
Hmmmmm... You don't say! BUY BUY BUY and NO FEAR..... Back to the melt-up comments for sure and this really has been a very nice rip up..... Probably not many shorts left standing.... The bears better throw in the towel... Today will be day 10 since my buy signal.... We shall see how the next DCL low plays out as most are calling this a NEW intermediate term cycle.

https://www.youtube.com/watch?v=TfAYz6p-mlw


SPY daily: Bottom Line The trend remains up!

The chances for an imminent correction just cratered
Jason Goepfert
Jason Goepfert
Published: 2021-10-26 at 07:35:00 CDT
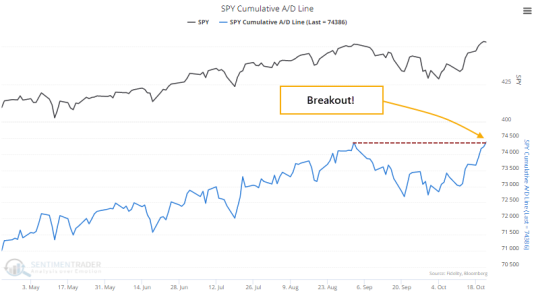
The most benchmarked index in the world is trying to hold a breakout to record highs. Supporting its case is the fact that most of its stocks have been rising, and breadth within the index confirms its good performance.

Even though the S&P 500 settled back a bit on Friday, most of the stocks in the index gained ground. That was enough to push the S&P's Cumulative Advance/Decline Line to a new high, the first in more than 30 sessions.
Among other major indexes, the Nasdaq 100 has also seen a breakout in its Advance/Decline Line but other indexes have not.

Many times over the past couple of decades, we've discussed the idea that stocks are less likely to suffer a large drawdown in the following months when the advance/decline line breaks out to a new high.

Since 1928, the S&P 500 was three times more likely to suffer a 10% decline at some point within the next three months if the S&P's Advance/Decline Line was not at a multi-year high. When it did break out to a new high, there was only a 4.6% probability of a 10% or greater decline within the next few months.
 

Attachments

  • a.png
    a.png
    46.7 KB · Views: 84
  • a.jpg
    a.jpg
    17.3 KB · Views: 84
Last edited:
Back
Top