Bear Cave 2 (Bull Allowed)

IT swing low looking very possible today.

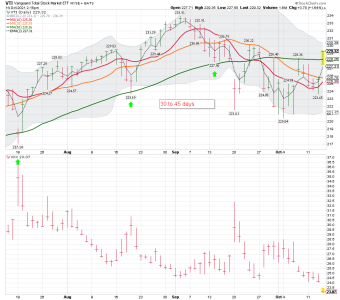
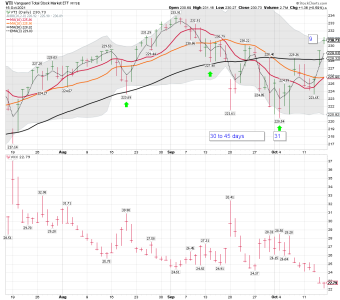
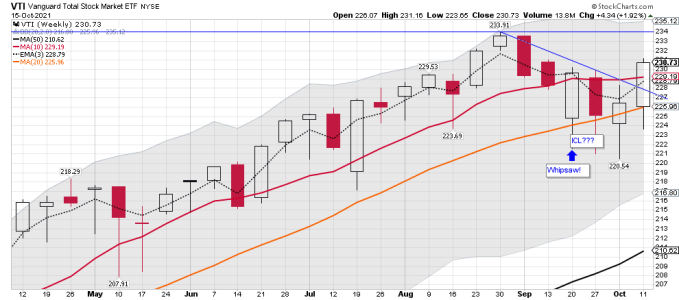
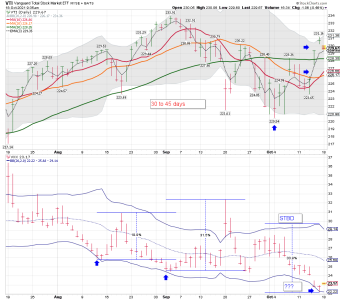
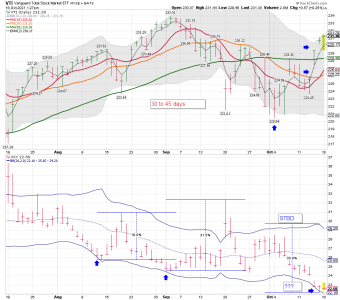
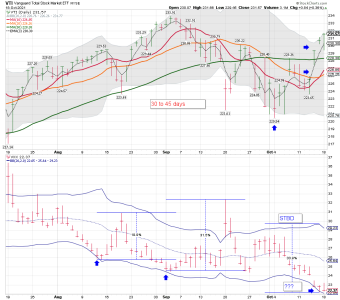
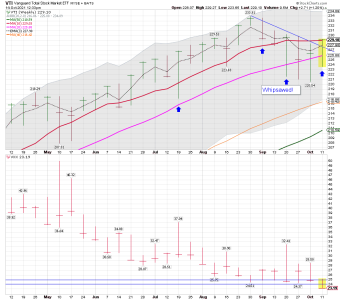
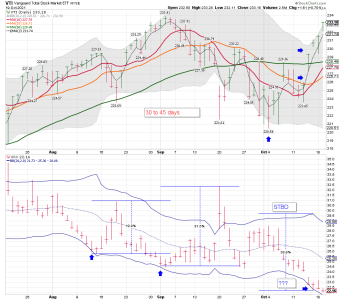
It Looks pretty darn good so far. I still like to use VTI for trend trading, and the buyers just took it back above the 10 week sma. One would think there is some short covering going on here... LOL..... We know a couple of GURU's that are still short. The last time VTI moved above the 10 week sma the STRer's took some profits, and I got whipsawed. We shall see how this move plays out.....

STR = Sell the Rip
 

Attachments

  • a.png
    a.png
    34.9 KB · Views: 98
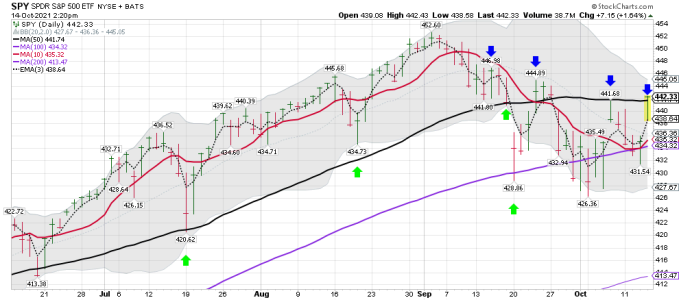
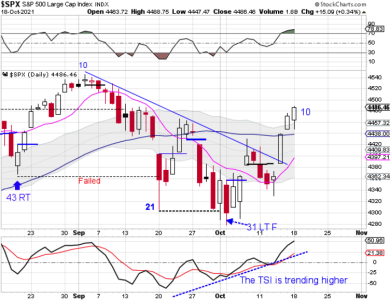
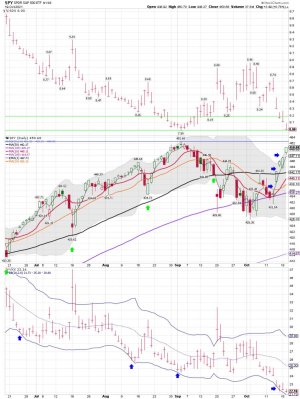
SPY and VTI daily charts: Nice moves above the 50 sma on the daily charts..... Folks are covering.......
 

Attachments

  • a.png
    a.png
    87.2 KB · Views: 86
  • a.png
    a.png
    34.4 KB · Views: 85
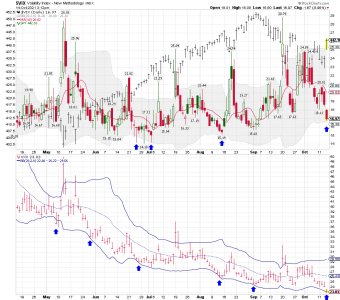
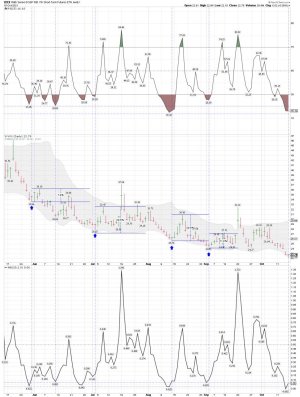
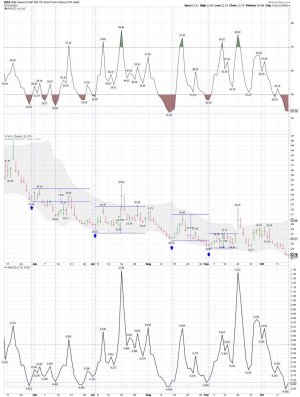
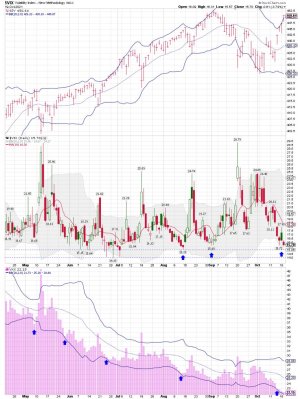
VIX/VXX chart: Heading into the final hour of trading: Anyone buying some VXX if you are long stocks? A lower BB tag for VXX...... We shall see how that plays out....

That tag is a Beer Money Trade for me......

A small position of VXX at Vanguard. I use VXX on occasion as a hedge for my VTI positions or a straight up Beer Money trade if it tags the lower BB. It's no more then a pattern trade..... ( see pattern below) This trade has above average odds of being a winner based on the chart. LOL..... Nothing is every 100% but I like to play the odds on some short-term trades. I will be using a 2% stop or around $50.00ish at risk.....

Account: robo
Transaction type: Buy
Order type: Market
Security: BARCLAYS IPATH SER B S&P 500 VIX SHORT TRM FUTURE ETN NEW (VXX)
Quantity: 100 share(s)
Price:* $22.95
 

Attachments

  • a.png
    a.png
    46.7 KB · Views: 90
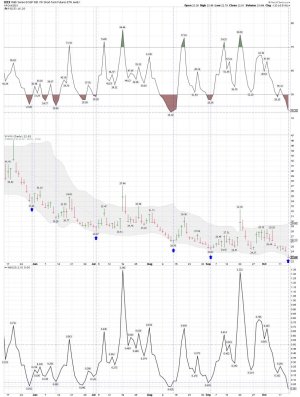
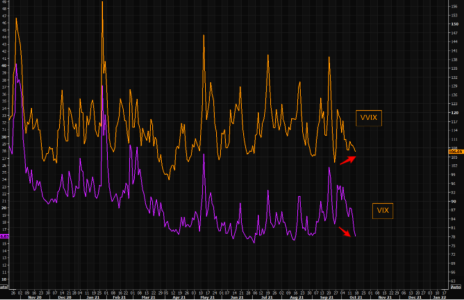
Late Friday protection time - VVIX ain't "buying" the latest VIXimplosion
The equities vol reset has been rather dramatic this week opening up for rather cheap protection/hedging opportunities given the macro backdrop.

VVIX has not participated during this last VIX reset.

The 2/8 VIX month futures spread has collapsed to levels not seen in "forever" (chart 2). This is rather impressive and offers great term structure plays, especially for the crowd that believes we will see more volatility going forward and/or need hedges.

Don't open the Friday Sassicaia before the VIX book is "full"...
 

Attachments

  • a.png
    a.png
    125.5 KB · Views: 74
  • a.jpg
    a.jpg
    158.4 KB · Views: 75
Tom pointed this out in his daily comments. "Today is an options expiration Friday so the action isn't always predictable - as if it ever is. Pre-expiration week has a positive bias and that has certainly kicked in over the last two days, but the week after expiration Friday tends to have a more bearish bias." We shall see how this October plays out.....

Please note the date of this article below.

This article was written by Sy Harding. I had his service for a couple of years after the 2008/2009 Bear Market.

Sy Harding profile picture. (See below)

Sy Harding

Market Patterns Look Normal

Oct. 24, 2008 1:36 PM ETSPDR Dow Jones Industrial Average ETF (DIA)

As strange as it seems, in all this wild volatility, the weekly patterns are still playing out normally.

For instance, options expirations take place on the third Friday of each month. The week before the expirations week tends to be negative. The week in which the expirations will expire on Friday tends to be positive. And the week after the expirations tends to be negative.i
it’s almost bizarre that the patterns could overwhelm even these economic and market conditions.

I can’t prove what causes the pattern around the monthly expirations, but for many years I have been expressing my suspicions. Those suspicions are that the huge program-trading firms use the power of their huge automated sell-programs to drive the stock market down the week before the options expirations week. They can then buy the highly leveraged options and futures that will expire the following week for pennies on the dollar. They then use the power of their huge buy-programs to drive the market back up the week of the expirations. They can then sell those about-to-expire options they bought for pennies on the dollar the previous week for huge profits. And the next week they unload the stocks they bought to drive the market up the previous week, adding to any negative activity in the week after the expirations.

I know, I know. It couldn’t be, since market manipulation is illegal (except for the Fed when it rushes in with a big rate-cut, or a surprise weekend announcement, when it fears the market will tumble the next day).

Nor could it be huge buy-programs in the final hour of the day that often manipulate an ugly market up to a better close. No, that’s just millions of investors suddenly deciding at the same moment that they need to be in the market.

https://seekingalpha.com/article/101928-market-patterns-look-normal

Sy Harding passed away in April of 2015.
https://jeffhirsch.tumblr.com/post/117799796948/rip-sy-harding
 

Attachments

  • a.png
    a.png
    179.3 KB · Views: 85
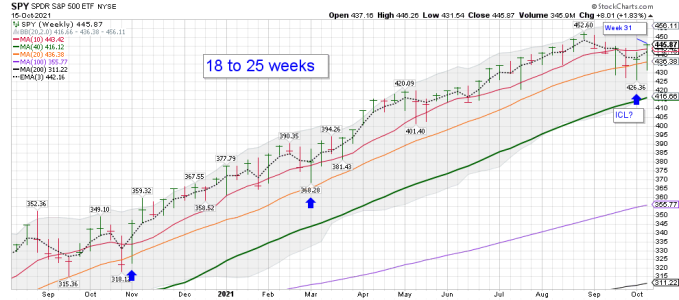
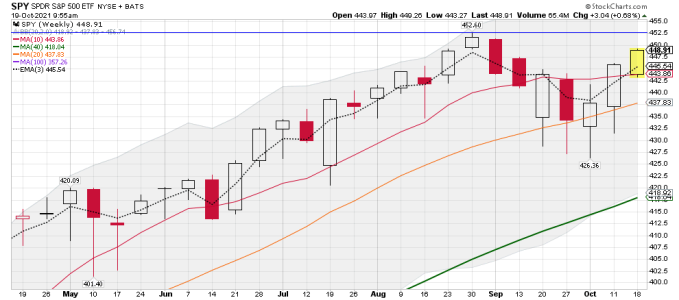
SPY Weekly chart: Week 31 looks to be the intermediate cycle low. We shall see how that plays out and if we can make new all time highs. However, The Yearly cycle low remains in play on the monthly chart.

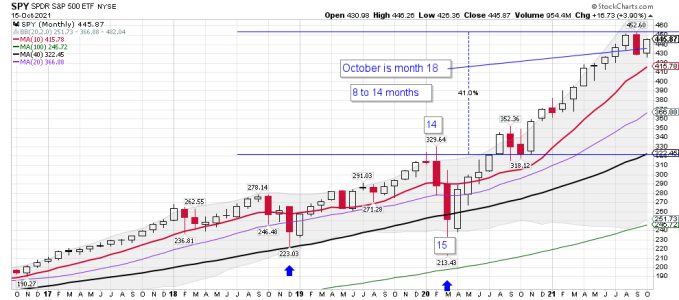
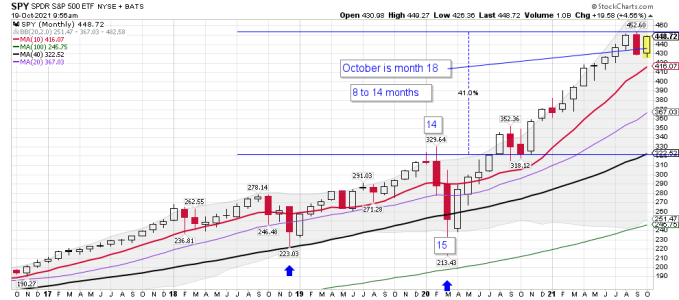
SPY Monthly chart: Because of the (right translated) formation of this intermediate cycle the yearly cycle decline is going to have to wait some more......

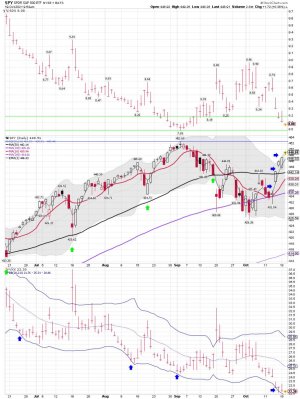
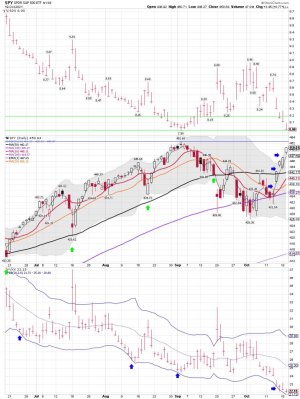
SPY daily: Day 9 it looks like and a nice move back above the 10, 20, and 50 sma on the daily chart. There was probably lots of buy signals going out for many trading systems last week. It was a nice move last week if you were long.... We shall see how it handles the upper BB tag. The VXX data indicates some were buying protection before the close Friday.
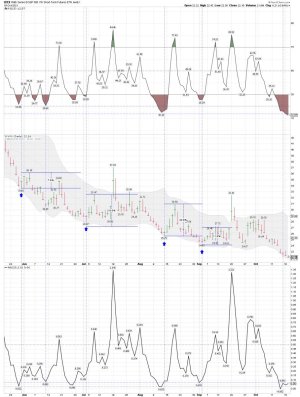
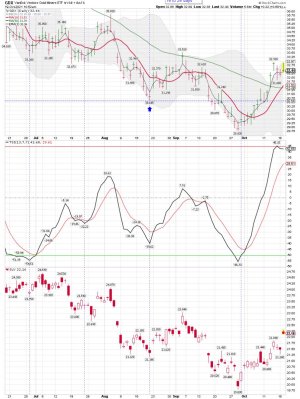
VXX daily:
 

Attachments

  • a.png
    a.png
    31.8 KB · Views: 84
  • a.png
    a.png
    25.9 KB · Views: 86
  • a.png
    a.png
    40.6 KB · Views: 84
  • a.jpg
    a.jpg
    158.4 KB · Views: 85
Last edited:
The Fed and inflation plus a few tweets:

Conversation
Michael Ashton
@inflation_guy
Transitory is dead. There is too much liquidity. The Fed now needs to choose whether to drain liquidity (not just taper), and live with much lower asset prices, or keep pumping asset prices "for the rich," while we all ultimately lose in real purchasing power.

https://twitter.com/inflation_guy/status/1448281876641222668?mc_cid=468dc7e376&mc_eid=5b348a9ca0


Mikael Sarwe
@MikaelSarwe

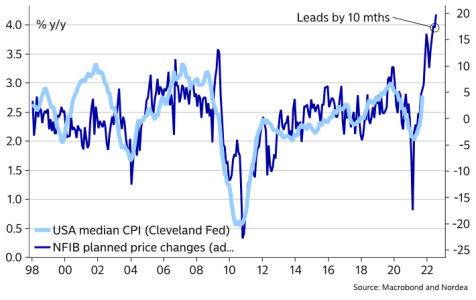
���� The Fed has been looking for broadening inflation. Well, now they have it. Median CPI jumped 0.5% m/m to 2.8% y/y. Small businesses moreover indicate that this is only the beginning... ( Chart 1)

SentimenTrader
@sentimentrader
·
18h
Well, a bit of a downer.

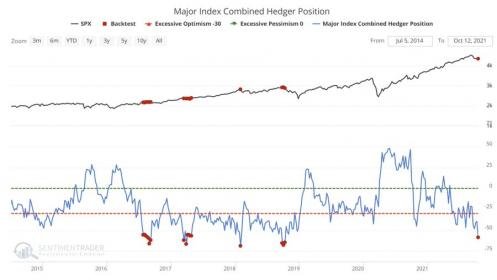
After holding more than $46 billion net long in major equity index futures a year ago, smart money commercial hedgers are now net SHORT almost $60 billion dollars' worth.

That's a headwind that stocks haven't faced much of in recent years.
 

Attachments

  • a.png
    a.png
    59.7 KB · Views: 87
  • a.jpg
    a.jpg
    16.4 KB · Views: 87
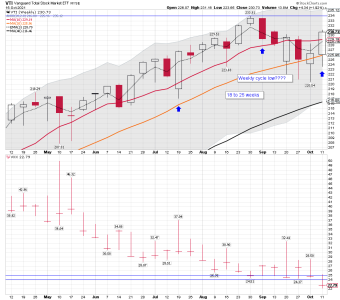
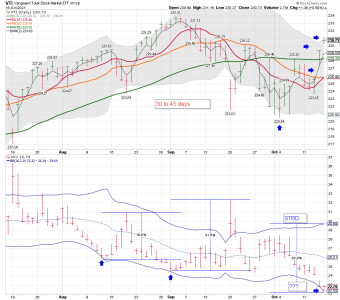
Weekly cycle low: Weekly cycles average 18 to 25 weeks. This sure looks like a weekly cycle low, but we need to make new highs before we can say for sure. VTI is grinding higher, and is above the 10 week sma and the 3 week ema, but that doesn't mean another whipsaw isn't coming my way.

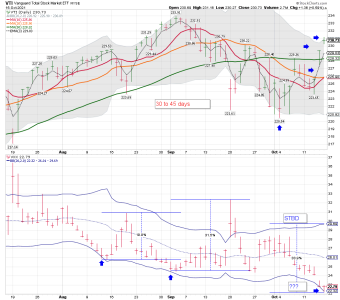
VTI daily: Looks good..... We shall see how it handles a tag of the upper BB on the daily chart.
 

Attachments

  • a.png
    a.png
    35.7 KB · Views: 94
  • a.png
    a.png
    26.1 KB · Views: 94
  • a.png
    a.png
    44.5 KB · Views: 93
Last edited:
Ok, "Easy Money Monday is up next"

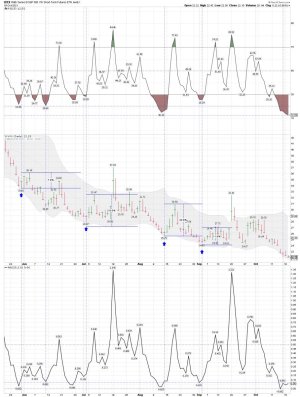
SPY/VXX daily: (My chart 3) Odds are above average for a (ST) short-term pullback, but that doesn't mean we will get one. (Chart 3)

Second comment: I'm sure watching the VIX (Chart 2)

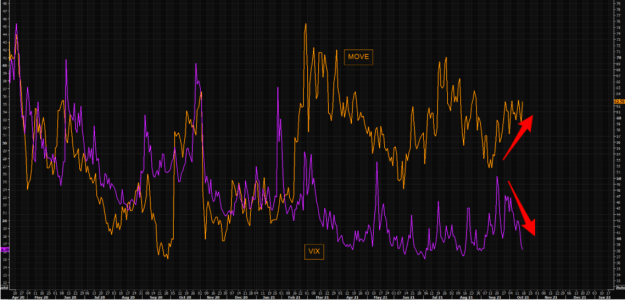
Do you trust big bond or small equity people?
Bond volatility has continued to move higher since mid Sep. At the same time, VIX has continued the "epic" reset.

https://themarketear.com/

This gap is becoming rather extreme here. Time to watch it carefully...
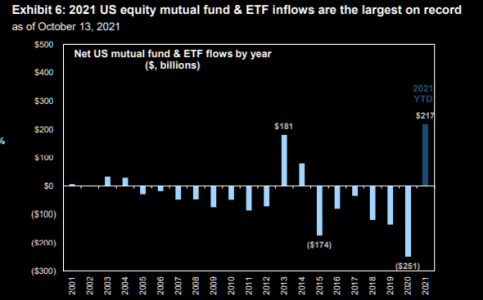
FOMO cash going into Equities (Chart 1)


Recent flow activity suggests a portion of the record level of US cash assets will be deployed into equities. Households, mutual funds, pension funds and foreign investors hold $19 trillion of US cash assets, accounting for 68% of total US cash assets and reflecting a $4 trillion rise vs. their pre-pandemic holdings. Goldman: "We expect some of this cash will shift into equities. US ETF and mutual fund net inflows YTD are the highest in any year since at least 2001 (Exhibit 6). The ratio of equity to bond inflows in the US is near a record high".
 

Attachments

  • a.png
    a.png
    34 KB · Views: 97
  • a.png
    a.png
    176.1 KB · Views: 99
  • a.png
    a.png
    44.5 KB · Views: 95
Last edited:
Hmmmmmmm... I will be watching to see how this plays out!

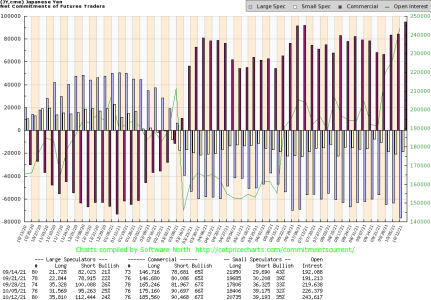
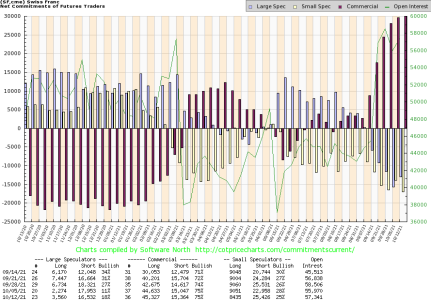
"Notice the multi-year extreme commercial long positions in the Japanese yen and Swiss franc, both safe-haven currencies which outperform when global growth is generally contracting:"

Kaplan

True Contrarian
@TrueContrarian

4h
My prediction: the most important development of the next few years will be when the money which flooded into the market in 2021 floods out of the market sooner or later
https://twitter.com/TrueContrarian?ref_src=twsrc^google|twcamp^serp|twgr^author
https://truecontrarian-sjk.blogspot.com/


Free COT data: I "DO NOT USE" this data for trading, but it does provide some clues....
https://cotpricecharts.com/commitmentscurrent/
 

Attachments

  • a.png
    a.png
    32.9 KB · Views: 96
  • a.png
    a.png
    36.4 KB · Views: 98
The Wealth Is In The Denominator
Print Friendly, PDF & Email


John P. Hussman, Ph.D.
President, Hussman Investment Trust

October 2021

Simply put, investors should be fully prepared for a very long period in which stocks essentially go nowhere in an interesting way. Nothing in our discipline relies on that possibility, even though it reflects merely run-of-the-mill assumptions supported by more than a century of market cycles. In contrast, passive investors are resting their future on the historically unfounded hope that this possibility can be ruled out.

From a historical perspective, it’s interesting that while the valuations preceding the 1987 crash were nowhere near those of 1929 or 2000, the total return of the S&P 500 outperformed Treasury bills by less than 1% annually during the nearly 22 year period from August 1987 to March 2009, despite two intervening speculative bubbles. As for the 2000 peak, after more than a decade of negative total returns, investors needed the most extreme speculative bubble and largest Federal Reserve stick-save in history just to get the 20-year total return of the S&P 500 2.5% over the depressed level of T-bill returns. Given current extremes, investors must now rely on a “permanently high plateau” in market valuations order to outperform T-bills. Indeed passive investors now fully rely on the assumption that market valuations will never, ever reach – much less fall below – historical norms again.
https://www.hussmanfunds.com/comment/mc211015/
 
VTI daily: Will these VTI gaps fill this week? My focus remains on the VIX for this week. VXX tagged the lower BB and VTI tagged the upper BB. We shall see how this plays out. The Bulls have the edge since this is "Easy Money Money"
 

Attachments

  • a.png
    a.png
    45 KB · Views: 96
VTI daily: A nice bounce as buyers remain in control...... "Easy Money Monday" remains in play and VXX smashed back down...... We shall see how we close...

Are traders still BTD or STR?
 

Attachments

  • a.png
    a.png
    45.1 KB · Views: 92
VTI daily after the close: The move up continues as "Easy Money Monday" be over.

SPY daily cycle:

Stocks Deliver Bullish Follow Through

We discussed last week that stocks needed to close above the declining trend line to confirm the new daily cycle.
Stocks closed convincingly above the declining trend line on Thursday then deliverered bullish follow through on Friday and Monday to close above both the 50 day MA and the upper daily cycle band. Closing above the upper daily cycle band ends the daily downtrend and begins a new daily uptrend. Closing above the upper daily cycle band also indicates that the intermediate cycle low has been set.

https://likesmoneycycletrading.wordpress.com/2021/10/18/stocks-deliver-bullish-follow-through-6/
 

Attachments

  • a.png
    a.png
    122.2 KB · Views: 87
  • a.png
    a.png
    45.9 KB · Views: 84
SPY Daily, Weekly and Monthly: It looks like the SPY is on its way to test the high.....

Charts don't tell you what the future will bring. It's just a history lesson of the past and what is happening in real-time. However, they can give you clues. I'm a trend trader and the current trend is UP. I trade what is happening not what I think will happen.

Good Trading to all those that have trading accounts.
 

Attachments

  • a.jpg
    a.jpg
    161 KB · Views: 88
  • a.png
    a.png
    24.4 KB · Views: 82
  • a.png
    a.png
    26.5 KB · Views: 81
Last edited:
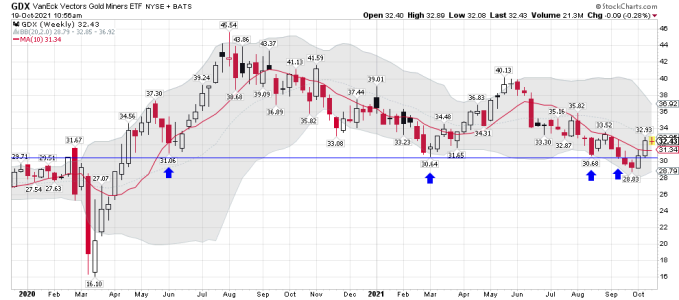
GDX daily: Day 11 since the buy signal...... Day 14 since tagging and moving above the 3 ema which I like to use for ST trading. (ST= short-term trading)

SLV and GDX still looking good, but probably getting closer to the next shake-out.... This is a tough sector to trade.....

GDX weekly: Above the 10 week sma

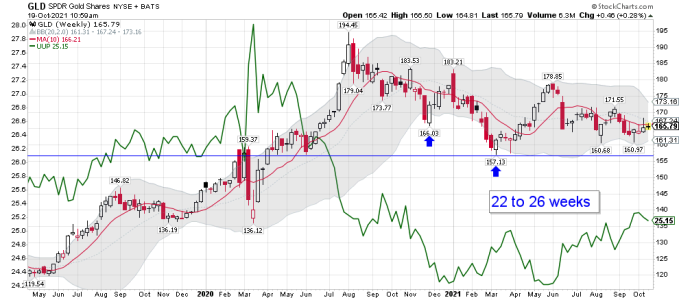
GLD weekly: Trouble at the 10 week sma and starting to see some compression.

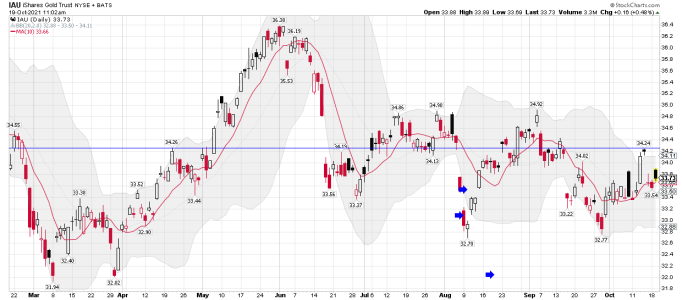
IAU daily: You can see for yourself!

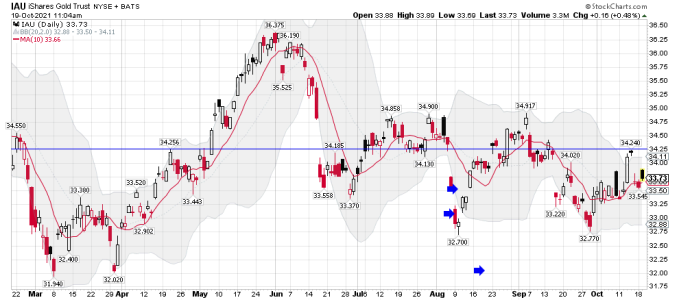
IAU daily: Now you can see it all..... Still below the April high marker, but lots of swings since then. Not an easy sector to trade.
 

Attachments

  • a.jpg
    a.jpg
    168.7 KB · Views: 83
  • a.png
    a.png
    24.9 KB · Views: 79
  • a.png
    a.png
    36.5 KB · Views: 83
  • a.png
    a.png
    43.5 KB · Views: 87
  • a.png
    a.png
    33.1 KB · Views: 83
Last edited:
SPY daily after the close: The move higher continues, but a tad stretched above the 10 sma on the daily. One should expect a move sideways in the days ahead. I had a few long positions and I'm reducing by 1/2 before the close and taking another beer money trade using VXX.

SDS tagging the lows, but probably due to slippage.

VTI daily after the close: The trend remains up as we are in a new daily cycle.

VXX after the close: Continues to be smashed down. Probably not many Bear's left standing after this move up the last few days. Looks like lots of short-covering to me...... The gaps up keep adding up.....

Good Trading to those that can!
 

Attachments

  • a.jpg
    a.jpg
    153.8 KB · Views: 86
  • a.png
    a.png
    47.2 KB · Views: 86
  • a.jpg
    a.jpg
    150.9 KB · Views: 86
SPY daily: I have to agree it has been a nice bounce.....

Bottom Line: The trend remains up, but the VXX current pattern is worth watching and maybe adding some protection for the short-term action.

Jason Goepfert
Published: 2021-10-20 at 07:35:00 CDT

Stocks in the S&P 500 Have Made a Stunning Comeback
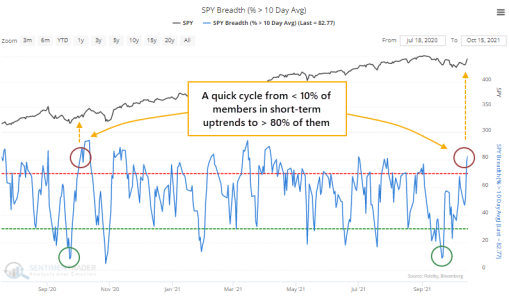
At various points during the summer, there were odd stretches where indexes like the S&P 500 were pushing higher but with a troubling lack of participation.

Each time, the situations resolved by the indexes moving even higher. As the indexes stumbled in September, though, there was a quick washout among stocks. By September 20, fewer than 10% of stocks in that index held above their 10-day moving averages.

Then buyers stepped in, and by the end of last week, more than 80% of members were trading above their averages, a stark change in less than a month.
https://www.sentimentrader.com/blog...l&utm_term=0_1c93760246-91f29c502f-1271291994
 

Attachments

  • a.png
    a.png
    69.7 KB · Views: 71
  • a.jpg
    a.jpg
    154 KB · Views: 73
  • a.jpg
    a.jpg
    150.4 KB · Views: 73
  • a.jpg
    a.jpg
    178.1 KB · Views: 76
Last edited:
The VIX......

He just called us...
Yesterday, before the market closed, our "VIX guy" called us explaining the case for a continuation of the VIX collapse.

Arguments are basically that everything is awesome and no risks can affect this market as strong seasonality is upon us.

We agree on the seasonality factor, but when the VIX guy calls us explaining why VIX should go even lower post this last volatility reset we get "uneasy". He continues to hold a 100% inverse track record.

It is probably time to look at some cheap protection trades.

https://themarketear.com/


$VIX
By TheNorthCast • Issue #17 • View online
Chart discussion on the $VIX:

https://www.getrevue.co/profile/The...wser&utm_medium=email&utm_source=TheNorthCast
 
Back
Top