Bear Cave 2 (Bull Allowed)

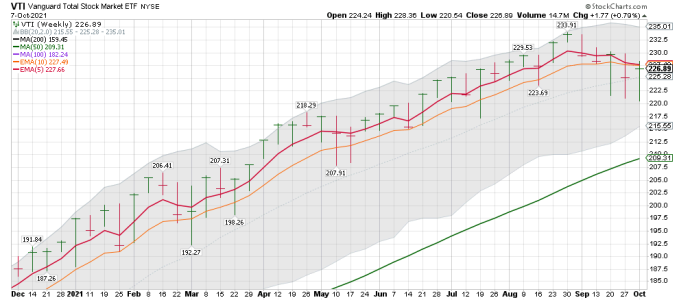
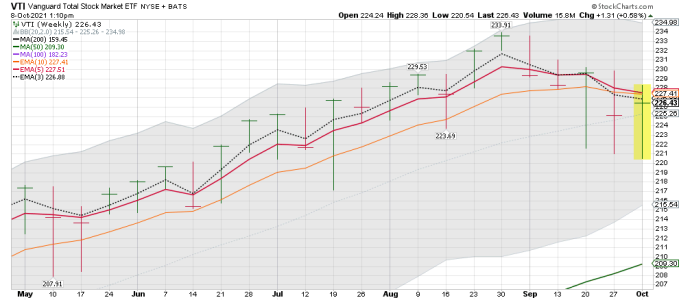
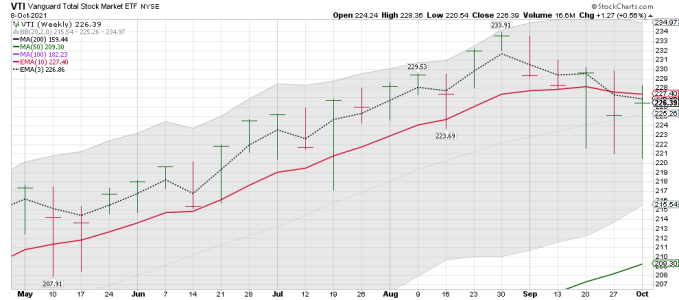
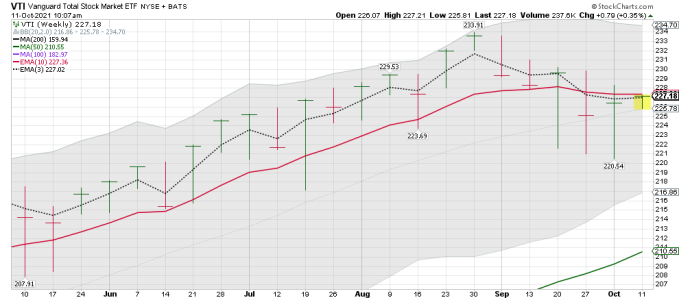
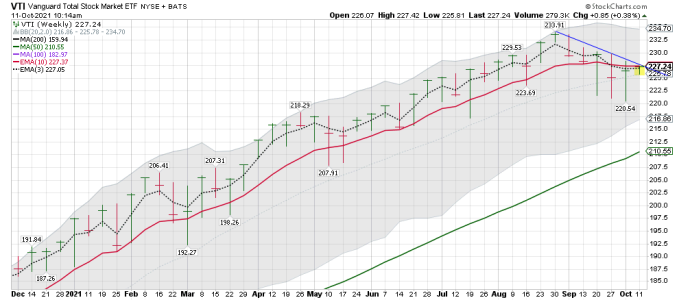
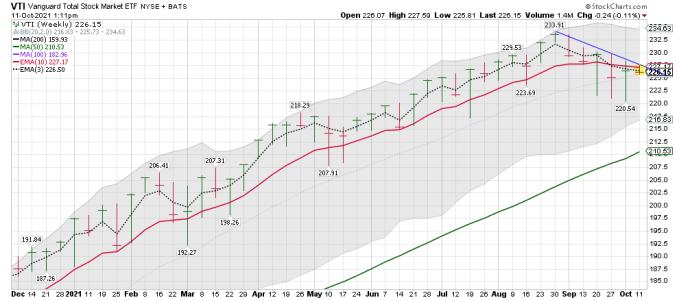
VTI weekly: As I pointed out in a post above, I will be watching the weekly data more. VTI has trended below the 5 EMA four out of the last five weeks. Not what you want to see. We shall if the Bulls can turn this back up and we can get an ICL. The video above seems to think we have already started the move. I want to see a close back above the 5 ema on the weekly chart below before I get to excited about an ICL being in. I also want to see a close back above the 50 sma on the daily chart. The 50 sma is watched by many traders. Yes, I'm a trader not an investor.

VTI weekly using the 5 and 10 week ema on the chart below: Read about EMA's and SMA's at the link below. There is also a video, but you really don't need to watch it. I use the EMA's sometimes when I'm looking for turns. I will sometimes use the 3 ema on the daily. The point is - we do not want to see the index trending below the 5 ema like it is right now on the weekly. However, some better news on the shorter time frame as the 3 ema is turning up. Day 3 that VTI has closed above the 3 ema. The Bulls should be able to push the indexes higher the next two days.....

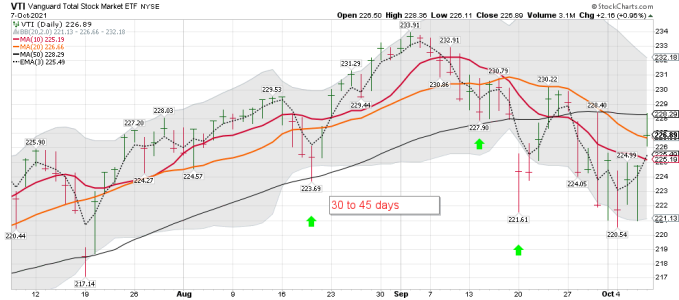
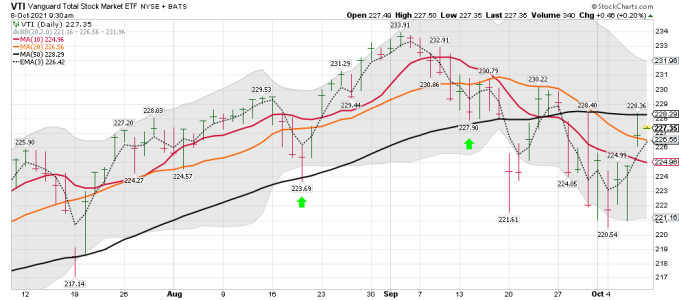
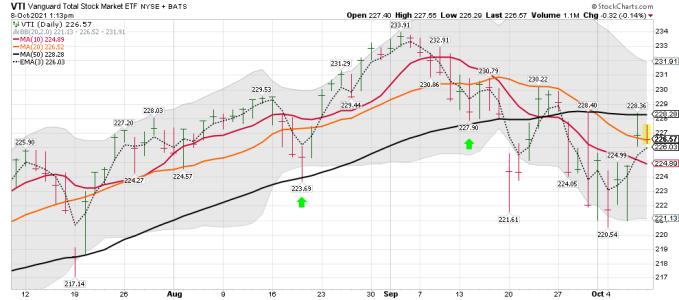
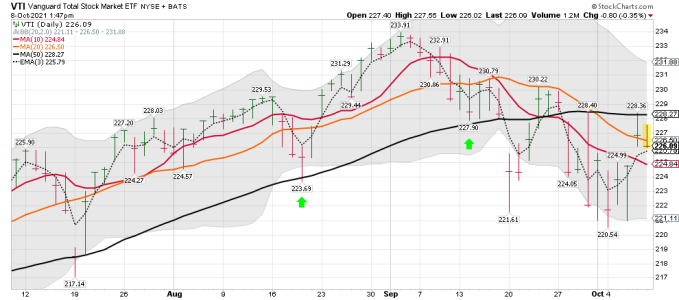
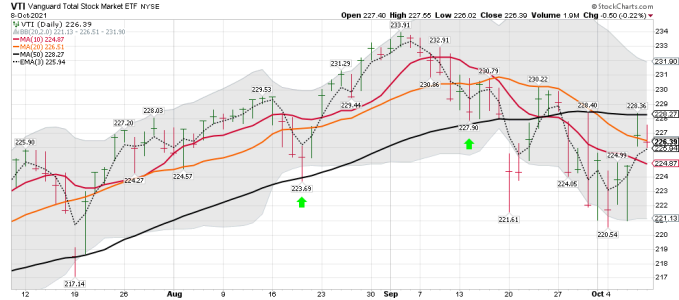
VTI daily chart below with the 3 ema and the 10 and 20 sma and I like to use this for tacking the current market price action. Notice how the 3 ema turned up and one could ST trade that signal if you kept the trade small and stayed nimble. This is day 3 that VTI has closed above the 3 ema and that could turn out to be very bullish after this current downtrend. We shall see how it plays out.

The point of all of this is the 3 ema can help you spot turns on the daily and I use with cycles and the other sma's for helping me to decided when and how big the read should be. I haven't used the ema much in this market because all you had to do is just BTD!..... Maybe that is changing, but I will trade what is happening and not what I think will happen.

Exponential Moving Average (EMA)
By JAMES CHEN

Reviewed by CHARLES POTTERS on April 28, 2021

What Is an Exponential Moving Average (EMA)?
An exponential moving average (EMA) is a type of moving average (MA) that places a greater weight and significance on the most recent data points. The exponential moving average is also referred to as the exponentially weighted moving average. An exponentially weighted moving average reacts more significantly to recent price changes than a simple moving average (SMA), which applies an equal weight to all observations in the period.
https://www.investopedia.com/terms/e/ema.asp
 

Attachments

  • a.png
    a.png
    26.1 KB · Views: 68
  • a.png
    a.png
    31.1 KB · Views: 66
Last edited:
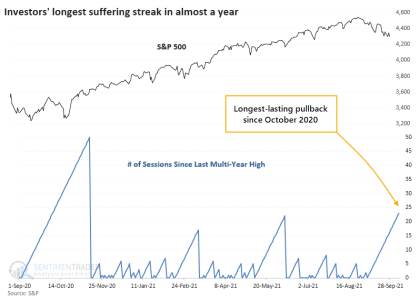
The Longest Pullback in Almost a Year

Jason Goepfert
Published: 2021-10-08 at 07:30:00 CDT
Last August, the S&P 500 did what was unthinkable just a few months prior - it broke out to a new all-time high.

Soon after, stocks saw a bit of a blow-off peak and the S&P didn't regain its highs until November. And it hasn't looked back since. The most protracted pullback that investors suffered was 22 days in June. Until now.
https://www.sentimentrader.com/blog...l&utm_term=0_1c93760246-2cf560257d-1271291994
 

Attachments

  • a.png
    a.png
    55.6 KB · Views: 69
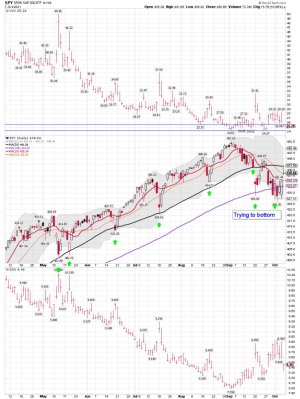
VTI daily and the Jobs numbers - September’s jobs report badly misses expectations with payrolls increasing by just 194,000. So far the market doesn't seem to care. The Bulls will want to close the SPY back above the 50 sma. I track VTI. ( VTI = The Total Stock Market)

For the record: Just because I post links and video's doesn't mean I agree with them. Like many other traders there are a few Guru's I track. I'm a trend trader and all the rest is just noise to me.

Bottom Line: Yesterday was day three for VTI closing above the 3 ema. This is indicating we "COULD HAVE" bottomed. I still want to see a close back above the 50 sma and then I will take a look at the weekly again.

I wait for the next ICL too. (ICL = Intermediate cycle low) Another gap up at the open. After all, It's "Free Lunch Friday" We shall see how all this plays out today.
https://stockcharts.com/h-sc/ui?s=VTI&p=D&yr=0&mn=3&dy=0&id=p05528534859&a=1039656966
 

Attachments

  • a.png
    a.png
    30.7 KB · Views: 68
Last edited:
VTI weekly: A fairly boring day..... As for the weekly chart. VTI remains below the 3, 10 and 20 ema. Not what I would call the all clear signal. The bottom could be in, but it is one of those calls..... Do you feel lucky? I remain in cash at Vanguard, and I will continue to only short-term trade using the daily data. Sure, we could keep grinding higher, but I want to see a better risk/reward set-up before putting bigger money to work. Maybe we will need one more (IC) intermediate cycle before the next year cycle low, but I will wait grasshoppers!

VTI weekly: Still NO BUY signal based on my data.....

VTI daily: I'm currently short-term trading from the long-side based on the data. However, I will keep it small and stay nimble until the weekly confirms an ICL is in. A close above the 50 sma on the daily would be a good start! You can read about the daily, and weekly cycles at the link above.

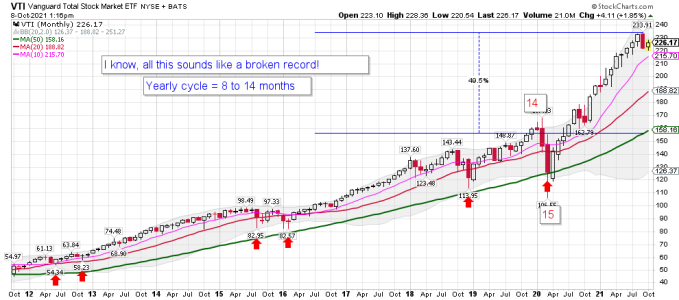
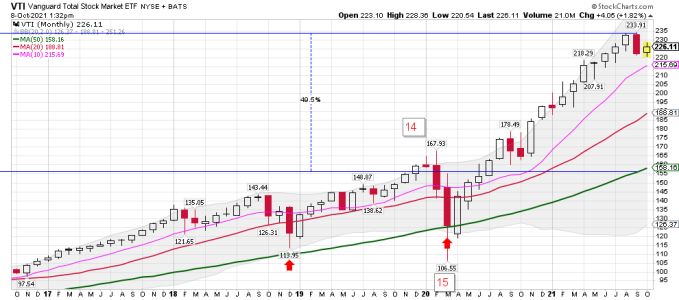
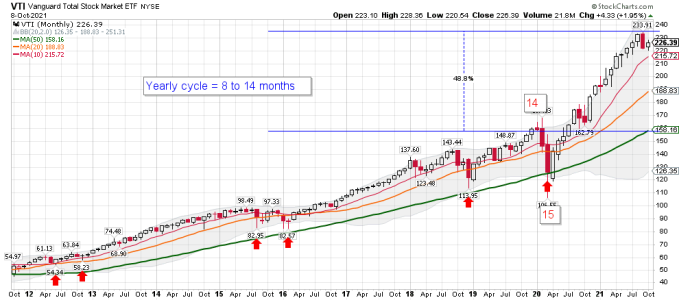
VTI monthly: I'm waiting for a yearly cycle low (YCL) and don't mind waiting to see how this plays how. Maybe we will have a very mild YCL.... Heck, maybe it's in, but I will pass at these levels.

See the last chart Grasshoppers......

VTI monthly: A closer look.....
 

Attachments

  • a.png
    a.png
    25.5 KB · Views: 61
  • a.png
    a.png
    30.3 KB · Views: 58
  • a.png
    a.png
    25.6 KB · Views: 60
  • z.jpg
    z.jpg
    47.2 KB · Views: 60
  • a.png
    a.png
    23.8 KB · Views: 58
Last edited:
VTI daily: Remains above the 3 ema which keeps me trading on the long-side, but has moved back under the 20 sma. We shall see how we close today as "Easy Money Monday" be up next! "Free Lunch Friday" is having some trouble so far. We shall see if buyers come in before the close. One would think they want to paint the pattern going into the weekend. However, that is harder to do if traders are now selling the RIP. (BTD or STR) = Buy the dip or Sell the Rip

https://stockcharts.com/h-sc/ui?s=VTI&p=D&yr=0&mn=3&dy=0&id=p44019181310&a=1039656964
 

Attachments

  • a.png
    a.png
    30.5 KB · Views: 70
VTI daily: I would like to see a close back above the 50 simple moving average (sma) early next week to start the so called best 6 months.

VTI weekly: We shall see how it plays out in the weeks ahead.... First VTI needs to close back above the 3 and 10 week ema.

The 10/09/21 Weekend Report Preview
Stocks

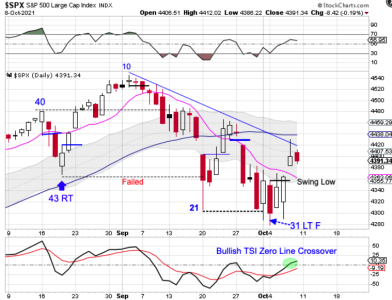
Stocks printed their lowest point on Monday, day 31, placing them in their timing band for a DCL.

Stocks formed a swing low on Tuesday then closed above the 10 day MA on Thursday to signal the new daily cycle. Stocks should go on to break above the declining trend line as they rally out of the DCL. Stocks are in a daily downtrend. They will remain in their daily downtrend unless they can close back above the upper daily cycle band.
 

Attachments

  • a.png
    a.png
    120.1 KB · Views: 61
  • a.png
    a.png
    30.4 KB · Views: 60
  • a.png
    a.png
    22.9 KB · Views: 61
Last edited:
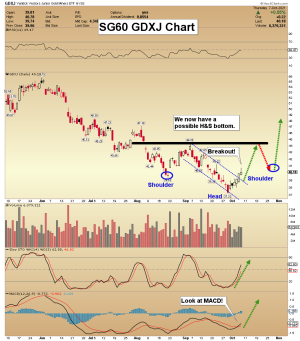
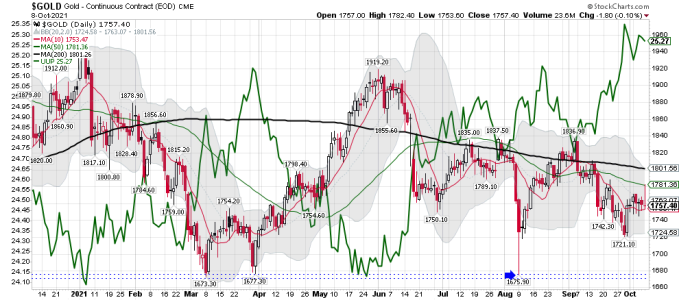
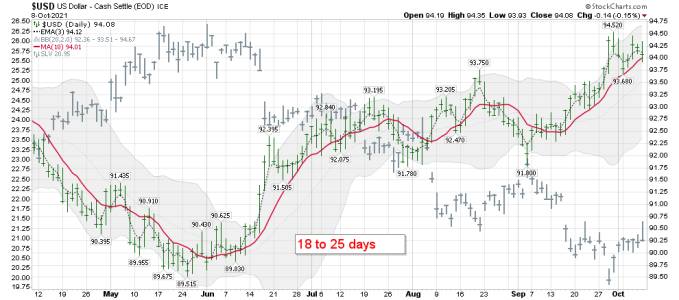
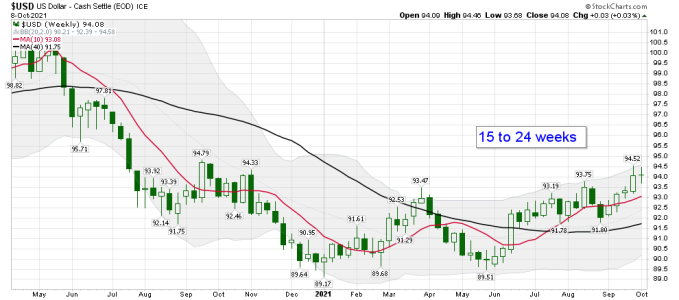
Morris weekly update: Well, I say we shall see to all of his comments.I will post some more metals/miner charts later. I'm waiting to to a (MT) medium-term position. A position i could hold for several weeks or longer.

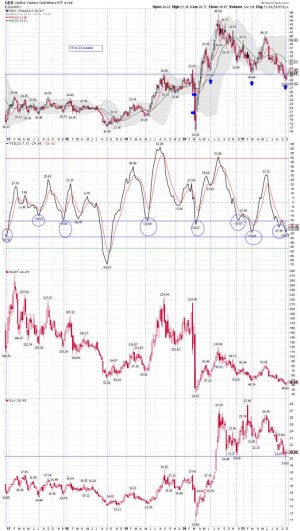
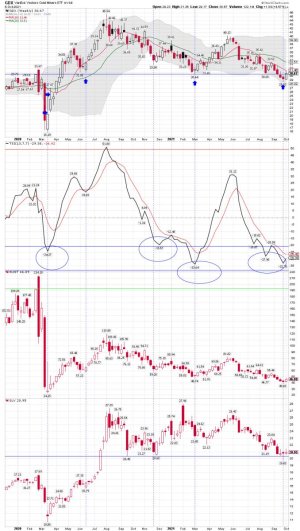
GDX weekly: I'm mainly watching the weekly, but trading the daily. The GDX weekly trend remains BELOW the 10 week simple moving average (SMA)
GDX weekly: A closer look. Week 17 that GDX has been trending lower under the 10 week (SMA) simple moving average.
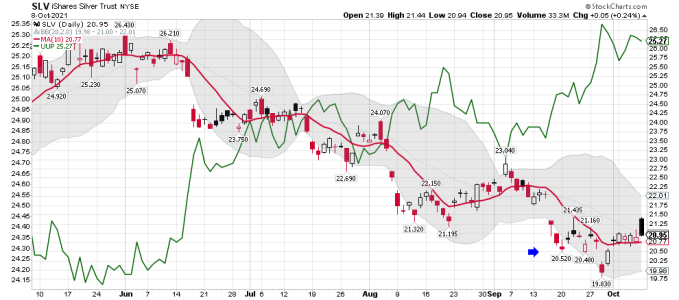
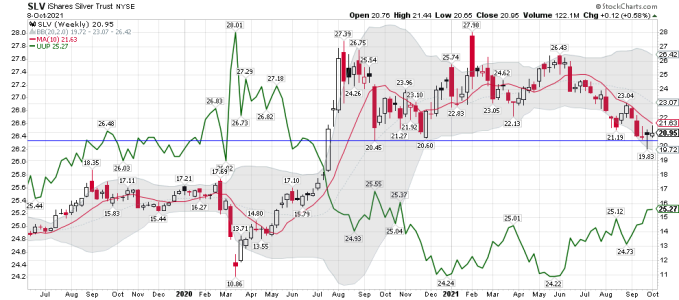
SLV daily: I'm still long some SLV

For the record: I DO NOT trade based on his data, but like his videos.

Gold Stocks: The Breakout Is Here

https://www.youtube.com/watch?v=AJAdC3dhJd0
 

Attachments

  • a.png
    a.png
    108.6 KB · Views: 61
  • a.jpg
    a.jpg
    165.6 KB · Views: 60
  • a.png
    a.png
    35.3 KB · Views: 58
  • a.jpg
    a.jpg
    139.2 KB · Views: 61
Last edited:
Do you trade the metals and the miners? I do..... LOL...... Like I always say..... We shall see!

Gary is a cycle dude. If you don't understand some of the terms he is using you will need to to do reading. You can try the guy below for 6 weeks for $15.00 and that should be enough time to have a good idea how cycles are used for trading. You not trying to become an expert. You are just trying to understand the terms. I leave the cycle work to the cycle dudes. I have enough to do daily trading using my own system.

https://lmtoolbox.wordpress.com/


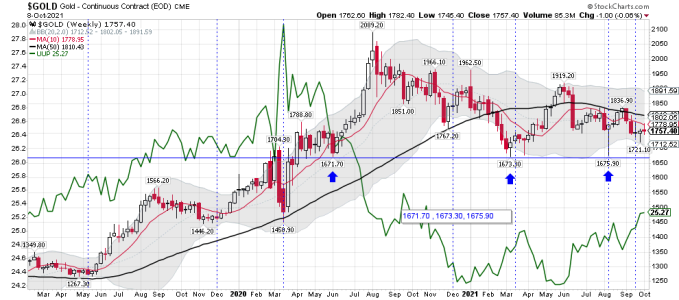
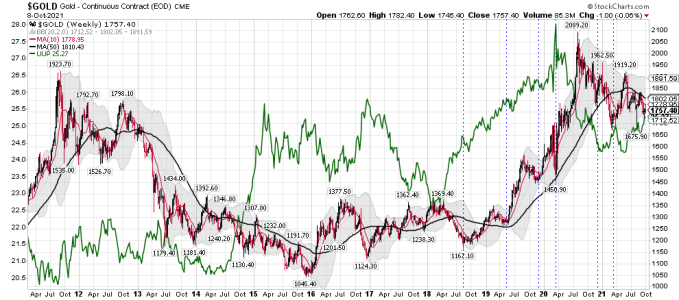
Gold update: Time to accumulate

https://blog.smartmoneytrackerpremium.com/2021/10/gold-update-time-to-accumulate.html
 

Attachments

  • a.png
    a.png
    39.9 KB · Views: 67
  • a.png
    a.png
    54.9 KB · Views: 69
  • a.png
    a.png
    55.6 KB · Views: 65
  • a.png
    a.png
    33.7 KB · Views: 62
  • a.png
    a.png
    24.7 KB · Views: 62
  • a.png
    a.png
    38 KB · Views: 63
Last edited:
Another cycle guy below, but he is not cheap. The link to his free blog is below. Even though they are old videos, if you watch them you will pick up some nuggets about using cycles for trading.

FOR THE RECORD: I DO NOT not make trades based on cycle data. I use cycles for Risk Management ONLY!

Using cycle for trading: "IF I like odds and probabilities it helps me determine my position size" Bob's comments below.


Everyone wants winning trades, and the best chance of getting them is when the forces in favor of the trade converge. Identifying these convergences is where the study and discipline of Cycles can give investors a serious edge. Combining Macro and Cycles Analysis, The Financial Tap will only put on trades if the right odds and probabilities greatly favor the trade being successful.

It’s all about putting the trade in perspective, executing when it makes the most sense, having the conviction to stand aside when the odds are not in our favor.
https://thefinancialtap.com/free-blog/
 
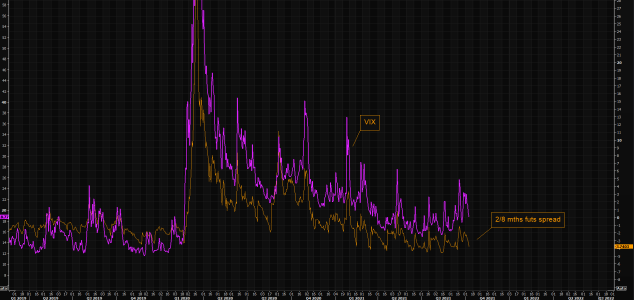
Is VIX to zzzzz?
We outlined our latest VIX logic on Friday (here). The previous note (here) has a lot of implications, for VIX as well.

Given the latest move lower in VIX, as well as the move lower in the VIX 2/8 months futs spread, hedging with various VIX strategies is making sense to us here.

Play the term structure of the VIX spread (+short end of the curve vs short the longer end in case you believe things won't continue to be calm).

Another hedge we like is call spreads in VIX given the latest move lower VVIX.

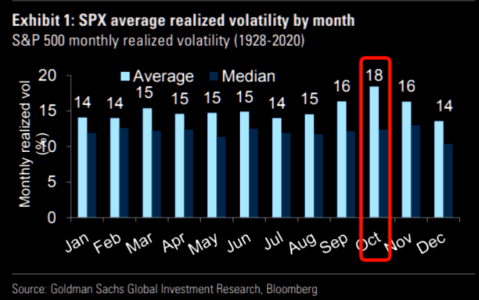
After all October is the VIX season...

https://themarketear.com/
 

Attachments

  • a.png
    a.png
    53.8 KB · Views: 68
  • a.png
    a.png
    159.1 KB · Views: 71
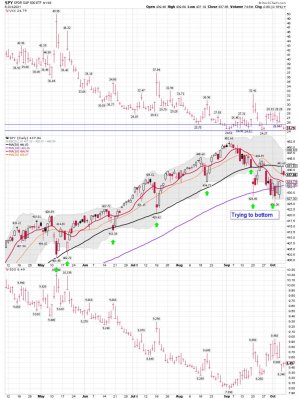
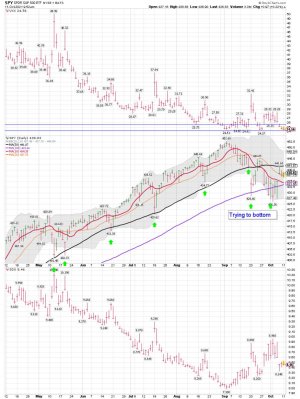
SPY daily: Grinding higher to get back above the 20 sma. The Bulls need to get the 50 sma back this week. LOL..... Should I buy VXX or SSO? Maybe I will buy both.....
 

Attachments

  • a.jpg
    a.jpg
    166.4 KB · Views: 74
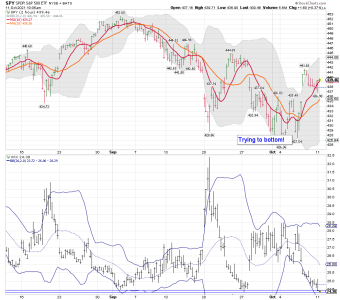
SPY 2 hour: A look at the 2 hour....

Beer Money Trade VXX @ $24.40..... The Bulls have the edge for now.....
https://stockcharts.com/h-sc/ui?s=SPY&p=120&yr=0&mn=2&dy=0&id=p15152828332&a=1037364940

VTI weekly: Moved back above the 3 week ema ( A good start) and the 10 week sma be up next. Looking for a place to go long VTI again for a weekly trade. Has been drifting lower for around 6 weeks, and trying to find a weekly cycle low. We shall see if the BTDer's come in or the STRer's are still in play.

(BTDer's = Buy the dip) (Sell the Rip = STRer's)

SSO - Looking good so far....
 

Attachments

  • a.png
    a.png
    50.1 KB · Views: 72
  • a.png
    a.png
    23.2 KB · Views: 74
  • a.png
    a.png
    27.7 KB · Views: 71
  • a.jpg
    a.jpg
    163.3 KB · Views: 69
Last edited:
VTI daily: ( The Total Stock Market) A very boring day if you are trading. I'm still focused on the weekly data, and not much happening so far today. I want to see SOME BEEF and a move above the 10 week SMA (Simple moving average) on the daily closing price! You can see on my chart the weekly 3 ema and the weekly 10 sma. The grind down continues.

Bottom Line: More sellers then buyers in the Total Stock Market. VTI remains fairly flat for today. One would think the Bulls will step up before the close. We shall see how we close.

Have a nice day!
 

Attachments

  • a.png
    a.png
    27.9 KB · Views: 66
  • a.jpg
    a.jpg
    49 KB · Views: 66
VTI daily: ( The Total Stock Market) A very boring day if you are trading. I'm still focused on the weekly data, and not much happening so far today.

It's getting whippy out there. No bonds today and a ton of inflation data on deck this week. It could get a lot less boring in the coming days.
 
Back
Top