Bear Cave 2 (Bull Allowed)

Strength on Friday usually rolls into Monday.

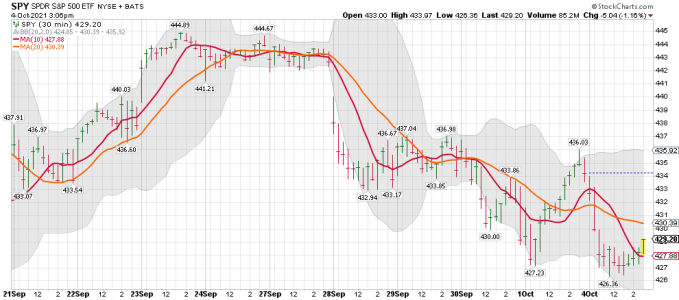
That has been the pattern lately. We also have the start of a new month which helps. I'm going to continue to only ST trade right now. I'm currently trading from the long side, but went flat before the close.

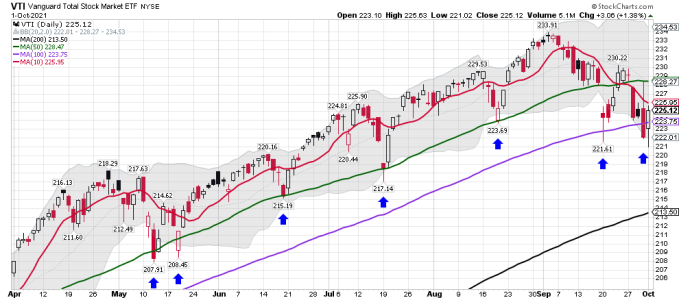
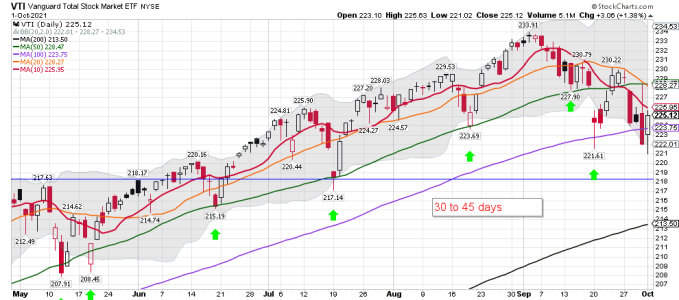
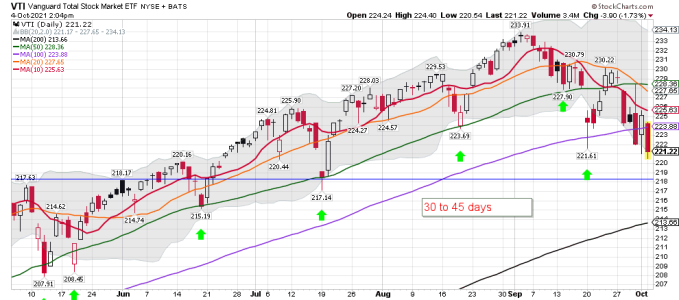
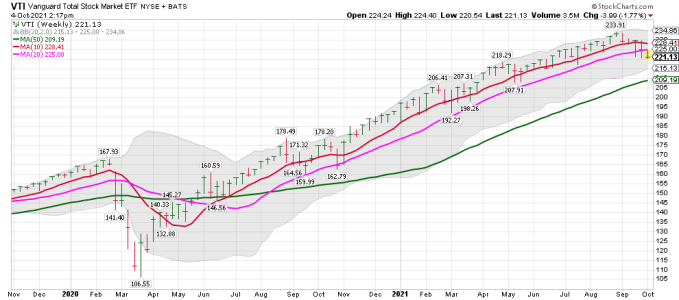
VTI daily: Not the picture the Bulls wanted to paint. However, as you pointed out - Strength on Friday usually Rolls into Monday.
 

Attachments

  • a.png
    a.png
    32.4 KB · Views: 61
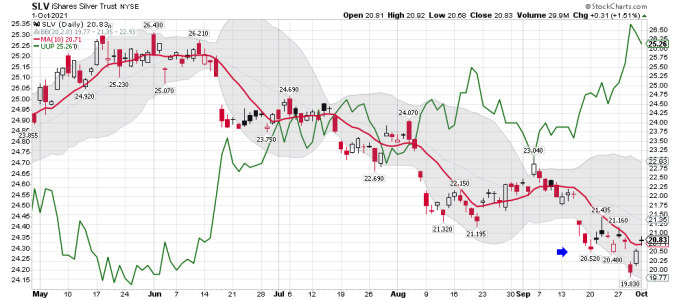
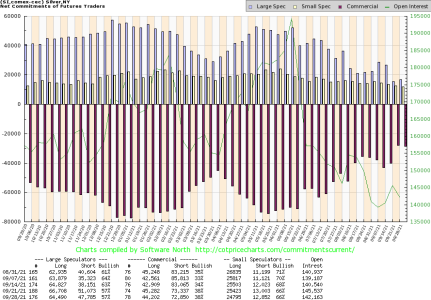
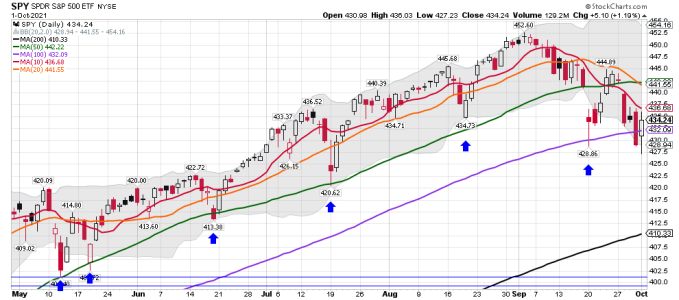
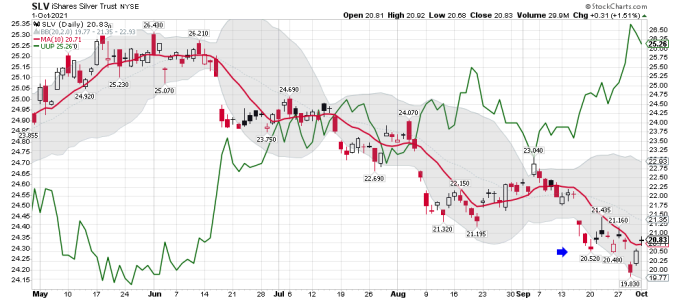
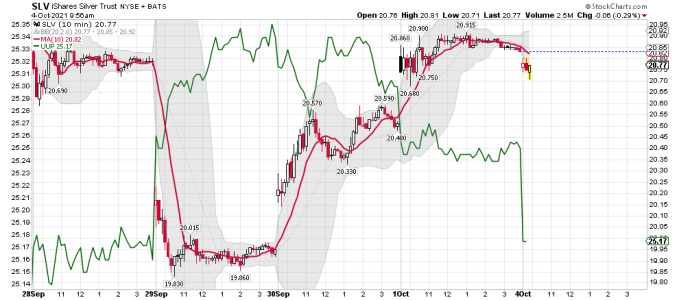
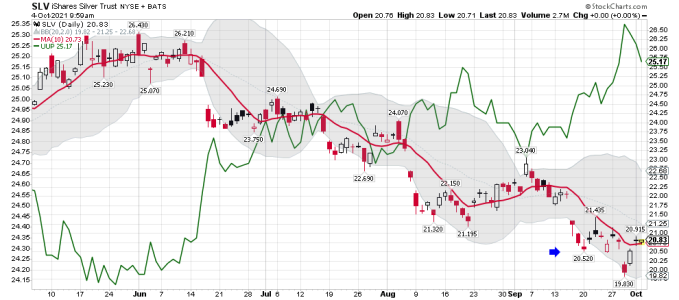
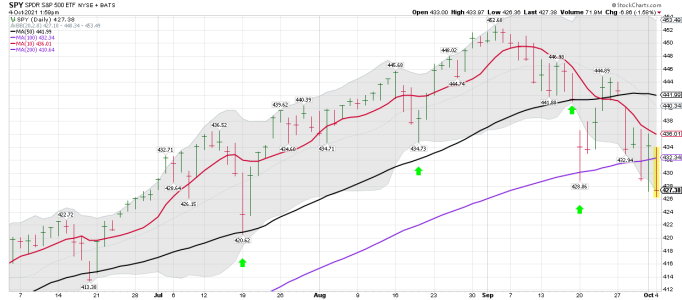
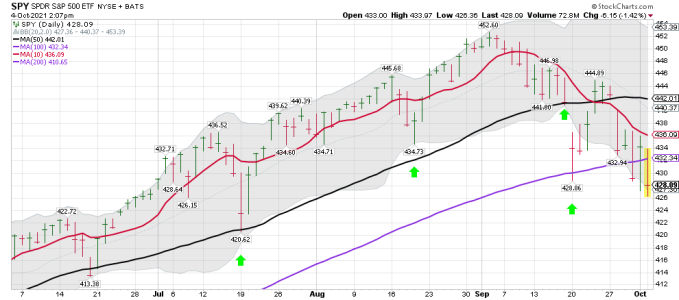
SPY daily: The Bulls need to get the SPY back above the 10 dma early next week. I would think that would happen Monday based on the patterns we have been seeing. I went flat going into the weekend except for a small position of SLV. SLV remains above the 10 dma and I plan to hold for now. Not much change on the COT data.

For the record: I DO NOT make trades based on this data, but I do track Morris.

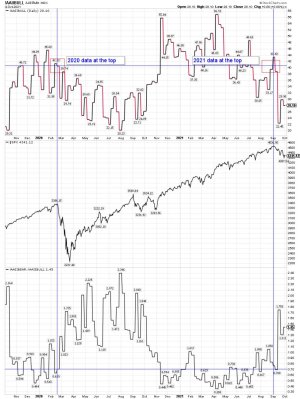
A update from Morris: I say we shall see! Morris: Stk Mkt Inferno & Gold Blastoff

https://www.youtube.com/watch?v=SZAGK0kQutg
 

Attachments

  • a.png
    a.png
    95.2 KB · Views: 52
  • a.png
    a.png
    88.1 KB · Views: 54
  • a.png
    a.png
    36.1 KB · Views: 52
  • a.png
    a.png
    33.8 KB · Views: 52
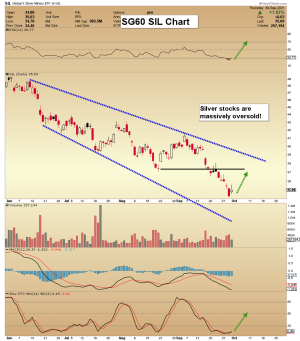
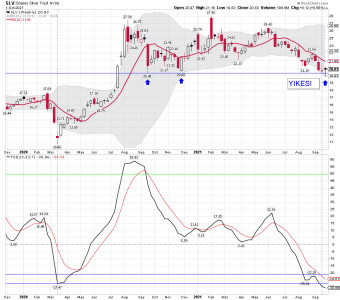
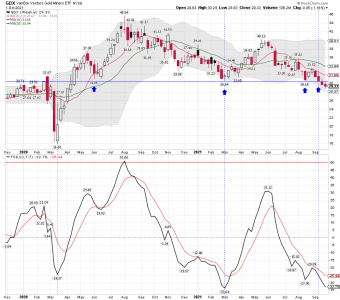
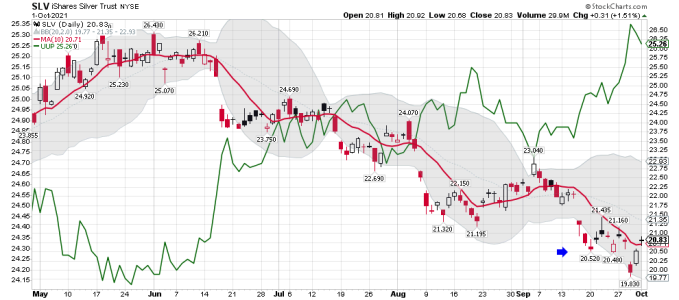
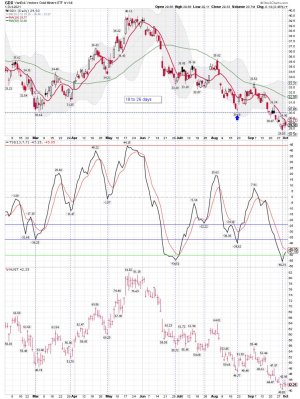
Silver Investors might be Undaunted, but I bet lots of stops were hit when SLV moved under $20.00ish last week. Looking to add SLV and I will buy GDX back based on the data. GDX did get a bounce, but remains in a downtrend and under the 10 dma.

GDX daily:
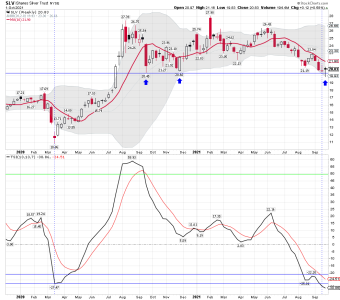
SLV weekly:
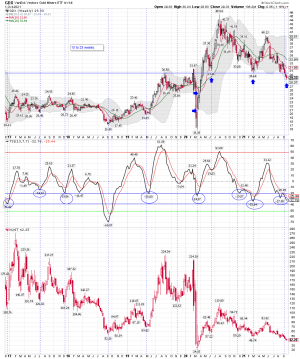
GDX weekly: Moved under the $30.00ish zone this week.

Silver Investors Undaunted

2021 has been challenging psychologically due to all that heavy gold-futures selling, with silver down 18.4% year-to-date as of this week. Yet SLV's holdings merely retreated 3.2% during that span, a small draw bordering on immaterial. This SLV-holdings proxy for global silver investment reveals silver investors remain undaunted by this year's silver selloffs! There's only one reason they'd stay through that.

Persistent price weakness turns the screws on investors, ratcheting up pressure to give up, sell, and exit that bleeding sector. Investors will only hold through vexing downtrends if they are convinced big gains are still coming on the other side. So SLV's relatively-stable holdings this year imply bullishness among silver investors remains strong. They know silver is being forced down by unsustainable gold-futures selling.

That implies selling exhaustion, that speculators have both sold all the silver-futures longs they are likely to as well as done all their probable short selling. That leaves room for nothing but buying, which propels silver sharply higher due to the big leverage inherent in silver futures. Investment demand should soar as investors see silver powering decisively higher again. That has real potential to fuel a big coming silver upleg.

Oct 01, Silver Investors Undaunted Adam Hamilton 321gold ...inc ...s
 

Attachments

  • a.png
    a.png
    44.2 KB · Views: 52
  • a.png
    a.png
    48.5 KB · Views: 53
  • a.png
    a.png
    36.1 KB · Views: 51
  • a.png
    a.png
    26.8 KB · Views: 49
  • a.png
    a.png
    27.5 KB · Views: 51
  • a.png
    a.png
    38.2 KB · Views: 49
Last edited:
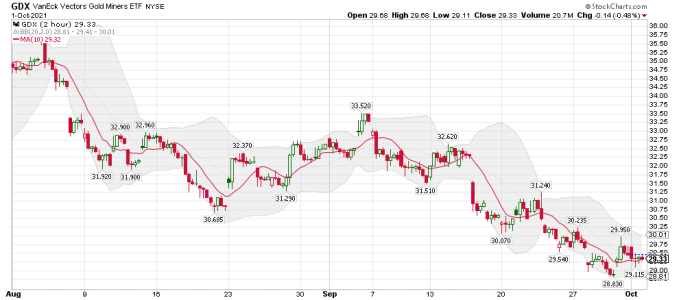
GDX/NUGT daily: Still waiting to buy some NUGT again after a ST trade last week. I use the GDX chart for trading NUGT.

Bottom Line: Trending below the 10 dma again and has failed to get back above the 50 dma twice.

GDX 2 hour: A few ST bounce, but the trend remains down as can be seen on the daily.

GDX weekly: Remains below the 10 wma and trending down! Waiting to see a CONFIRMED weekly cycle low. (ICL be coming and I wait). That doesn't mean I'm not ST trading this sector.
 

Attachments

  • a.jpg
    a.jpg
    193.9 KB · Views: 57
  • a.png
    a.png
    24.1 KB · Views: 52
  • a.png
    a.png
    71.2 KB · Views: 53
Hmmmmm.... Another call for a final melt-up. Maybe! We shall see..... I like his cycle work, but have my own system for making trades.

SPY daily: For now I will take it one day at a time. I want to see a confirmed move back above the 10 dma, before I say ALL CLEAR and buy VTI back!
VTI daily: I currently have NO position at Vanguard.

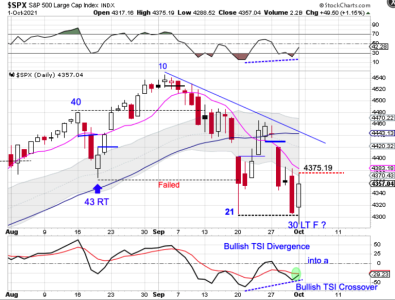
Stocks formed a bullish reversal on Friday.

Stocks broke below the day 21 low on Friday to extend their daily cycle decline. Friday was day 30, placing stocks in their timing band for a DCL. Friday’s bullish reversal eases the parameters for forming a swing low. A break above 4375.19 will form a swing low. Then a close above the 10 day MA will signal the new daily cycle. Stocks are in a daily downtrend. They will remain in their daily downtrend unless they can close back above the upper daily cycle band.

In the Weekend Report I discuss why I expect this to be not only a daily cycle low, but an intermediate cycle low as well. And what I am looking for to signal a final melt-up phase to this bull run.

https://likesmoneycycletrading.wordpress.com/2021/10/02/bullish-reversal-7/
 

Attachments

  • a.png
    a.png
    128.4 KB · Views: 61
  • a.png
    a.png
    30.4 KB · Views: 58
  • a.png
    a.png
    31.3 KB · Views: 60
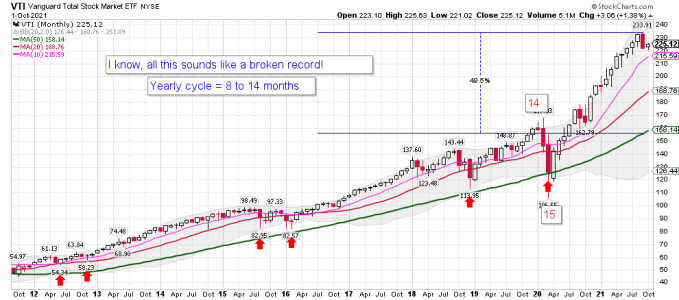
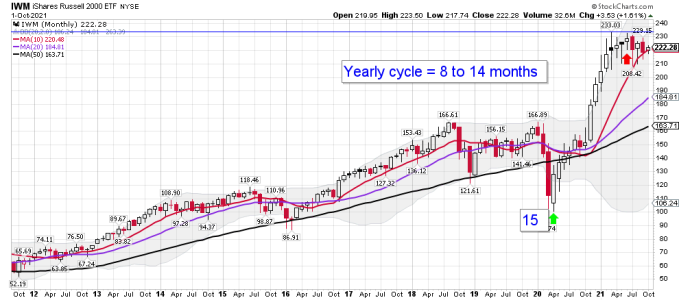
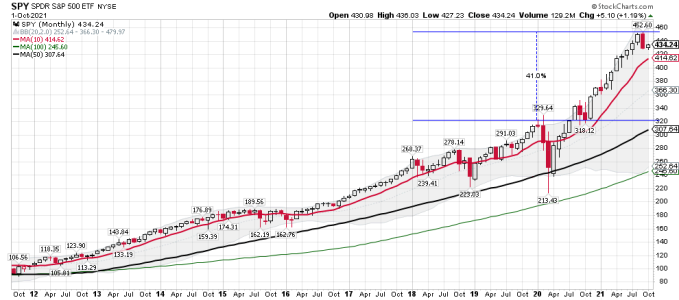
VTI, IWM and SPY monthly cycle data: Is the YCL in? It depends on whom you ask.....

Ok, it has been 18 months since the last YCL, and I get that the Fed is still in the game, so maybe the YCL is in. We shall see!

IWM monthly: Sideways for 7 months now from the so called leader.
SPY monthly: If the YCL is in it sure was a small pullback. Still, with all the BTDer's and the Fed in the game anything is possible. I remain flat VTI for now anyway.
 

Attachments

  • a.png
    a.png
    25.7 KB · Views: 52
  • a.png
    a.png
    27.7 KB · Views: 53
  • a.png
    a.png
    24.4 KB · Views: 54
LOL.... I use to watch seasonality, now I just BTD! Waiting for Tom to post the Oct chart.

Never forget seasonality
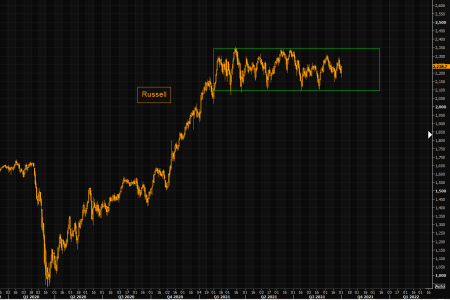
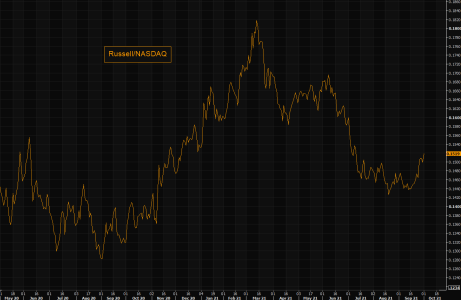
Just a reminder of that great seasonality chart. The only outlier would be the most recent move higher in Russell.

On the other hand, getting outright excited about Russell is pointless. Small caps are stuck in an impressive range.


https://themarketear.com/
 

Attachments

  • a.png
    a.png
    36.9 KB · Views: 55
  • a.png
    a.png
    35.7 KB · Views: 55
Last edited:
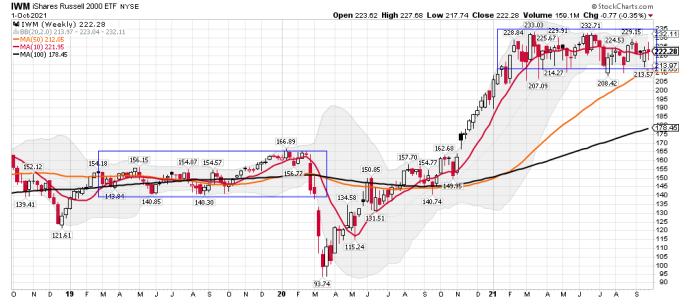
IWM weekly: Moving above and below the 10 wma and compressing for months. Last time we saw this pattern it didn't end well. We shall see how it plays out this time. I currently have NO POSITIONS in IWM.

Hmmmmm..... Where is the melt-up for small caps? Is it still coming? Isn't it suppose to lead? So, with all that said, I say it's time to pass the popcorn for this index.

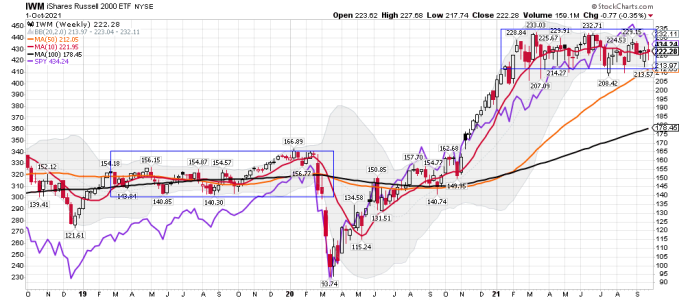
IWM/SPY chart: SPY is the purple thick line. IWM did top first on the weekly chart. I'm not saying the IWM run is over or what will happen next. I'm just pointing out the past patterns.

How will the first week of October play out this year? I did see the charts Tom posted..... The Best 6 months is now in play for those that use that for investing.
 

Attachments

  • a.png
    a.png
    30.1 KB · Views: 61
  • a.jpg
    a.jpg
    87.7 KB · Views: 67
  • a.png
    a.png
    37.1 KB · Views: 64
Last edited:
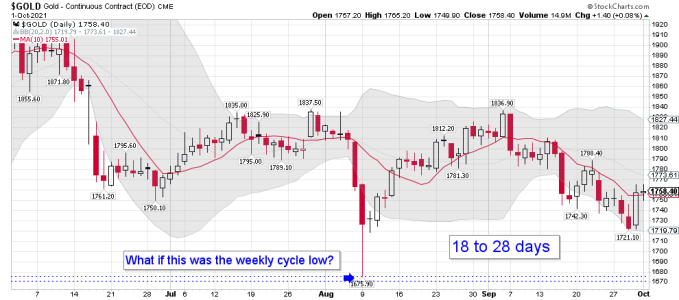
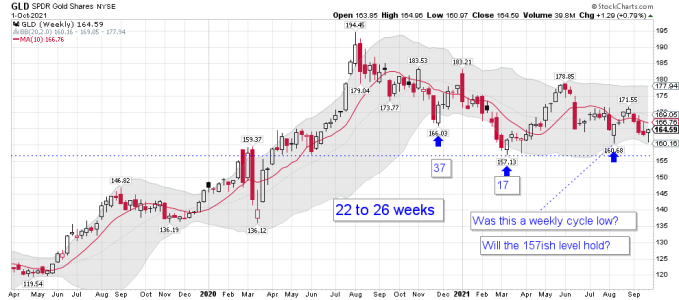
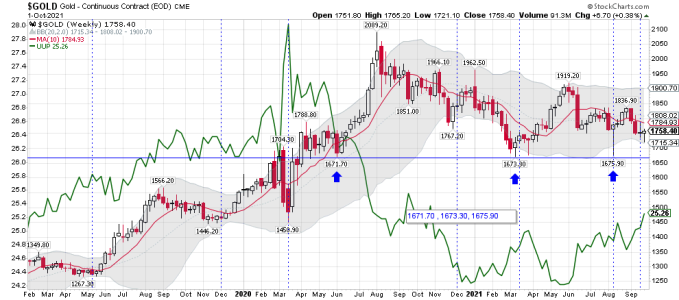
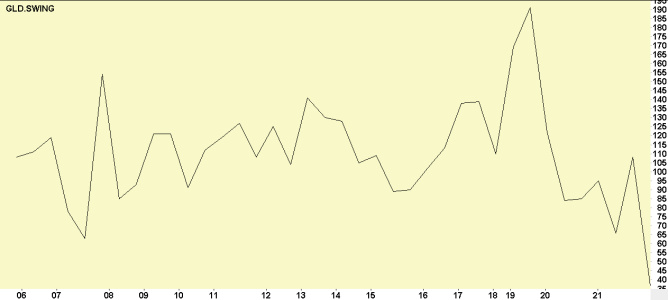
GLD Cycle Count

Here is my GLD DCL chart from my cycle program (you may have to save the image to see the entire eighteen years with an image editor). Anyone see any errors in my cycle low dates?

gld.jpg

Here is the cycle days graph. We are too early for a DCL.

swing.png

Once I get the DCL's right then I will start working on left/right translation, rise/fall days and percentages plus other interesting stats.
 
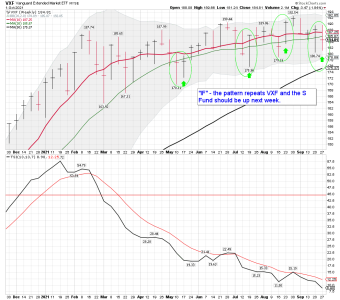
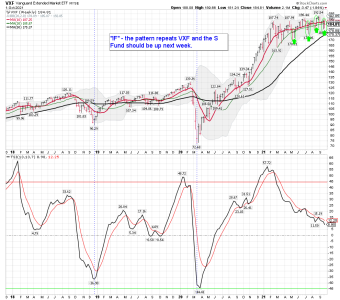
VXF weekly: VXF is very close to the S Fund. I use to trade if often at Vanguard, but I'm currently trading VTI.

Since the May low any move down that closed on Friday below the 10 and 20 wma has resulted in a bounce in the weeks ahead. We shall see if the BTDer's and the Fed can keep that going.

Bottom Line: VXF remains below it's 10 and 20 wma. Most GURU's I looked over this weekend think we will bounce next week. We shall see how it plays out.

I have NO POSITION in VXF.

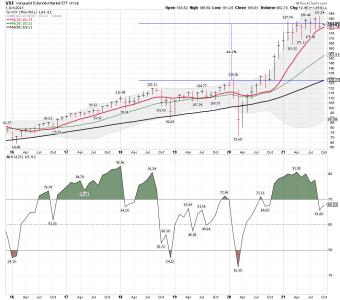
For LT investors: If you are a LT investor, and use the monthly data, VXF remains above the 10 ma. I will be trading the 2 hour and daily data next week. However, LT investors using the monthly data have done very well since the March 2020 low.
 

Attachments

  • a.png
    a.png
    46 KB · Views: 78
  • a.png
    a.png
    56.2 KB · Views: 75
  • a.png
    a.png
    41.6 KB · Views: 73
SLV daily and weekly: I'm still holding some SLV. Note the word "POTENTIALLY" on the video title below. We shall see how it plays out!

SLV daily: Closed above the 10 dma on Friday, but that is only one day above the 10 dma, and that doesn't get me to excited. However, I made some beer money on this trade and will add if the market tells me to.

SLV weekly: This is week 16 SLV has been below it's 10 wma. That is why I'm only ST trading. Plenty of work needs to get done on this index before I will go long with a MT position. My MT positions are "NOT" more then 10% for any index/trade. I also might be ST trading the same index with leverage. I took a AGQ trade last week when the $20.00ish area was tagged. This sector metals/miners is not easy to trade.

Silver update: Potentially bullish setup
 

Attachments

  • a.png
    a.png
    36.1 KB · Views: 75
  • a.png
    a.png
    44 KB · Views: 75
Bull/Bear daily tracking pattern: Making a few small ST trades this morning, but mainly just watching the show. The SPY remains under the 10 and 20 wma's. Waiting for a confirmed weekly buy signal before I take any MT positions. i don't like to jump the gun with MT positions as they are larger then my ST trades. I still NEVER go higher then 10% on any index after I buy all my tranches. That's a 10% total position max and I NEVER buy all at once. Something you just can't do at TSP.

Still trading SLV and a few other indexes this morning.
https://stockcharts.com/h-sc/ui?s=SLV&p=10&yr=0&mn=0&dy=5&id=p12516873028&a=1037190353

SLV daily: Remains above the 10 dma..... We shall see if buyers continue to come in. SLV is getting some help from the dollar today.
 

Attachments

  • a.jpg
    a.jpg
    153.8 KB · Views: 77
  • a.png
    a.png
    26.7 KB · Views: 74
  • a.png
    a.png
    37.7 KB · Views: 75
  • a.png
    a.png
    35.6 KB · Views: 73
Something to think about before the year ends.

One of the most underappreciated features of the tax code in the U.S. and Canada is the ability to put money into accounts which grow tax-free for life and where you generally don't have to pay any tax upon withdrawal. In the United States these mostly include Roth IRA, Roth 401(k), Roth 403(b), Roth individual (solo) 401(k), and similar accounts. For more than two decades I have been concentrating on moving the assets of myself, my Dad, and my clients into these kinds of accounts. Recent and likely upcoming legislation has made these accounts even more favorable than they had been relative to other kinds of accounts. I will discuss the main purpose of these accounts and how to get as much money as you can into them over the long run.

Roth accounts have numerous additional advantages.


Unlike traditional retirement accounts, Roth accounts have no required minimum distributions. You can contribute to them at any age. They can also be easily inherited, usually without increasing the tax burden of the heir. Roth accounts are often protected from creditors. Even minors can establish Roth accounts with an adult custodian which I usually highly recommend. Roth income of all kinds is not taxed in any U.S. state or locality. There are penalties for withdrawal prior to age 59-1/2 but there are many legal exceptions which allow you to avoid this penalty.

Money in non-Roth retirement accounts can be converted into Roth accounts with no limits.

In case you have money in non-Roth retirement accounts then you can convert that money into Roth accounts with no annual limit. Unfortunately you can't undo these conversions once they are done which used to be permitted under a method known as recharacterizations. I will explain the details of such conversions in part two.

https://truecontrarian-sjk.blogspot.com/
 
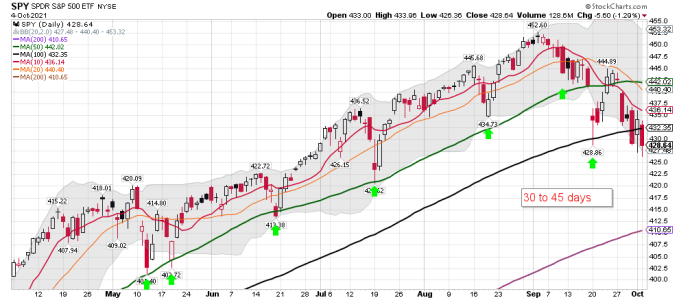
SPY daily: Probably a few folks that BTD are a tad worried this morning. Another tag and a move below the 100 dma. Normally this is just another chance to BTD. We shall see how this week plays out.

SPY daily: Under the 100 dma again. One one think buyers will come in before the close...... We shall see how it plays out.
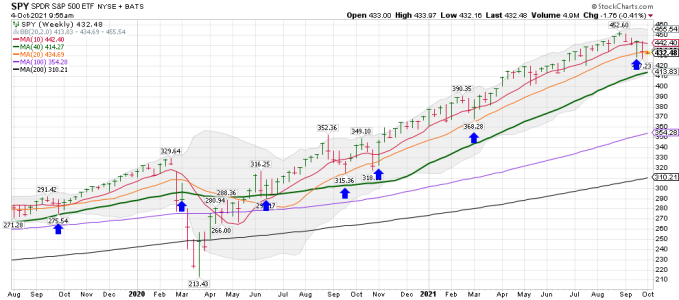
SPY weekly: Under the 10 and 20 wma's.....
 

Attachments

  • a.png
    a.png
    34.8 KB · Views: 67
  • a.png
    a.png
    26.6 KB · Views: 69
That would be me, over here in the corner with a heavy blanket over my head.


Scott Harrison
Senatobia, MS

Ignore the first chart for the SPY. You can't see the entire chart. Use the VTI and SPY daily below for my comments.

The logic and the odds for a winner trade, based on the patterns I have been using for the last 12 month, was above average for a winning trade today/this week. I didn't ST trade it or go long because I'm waiting on a weekly buy signal, and only ST trade when the indexes are trending below the 10 dma. This is day 5 for the current trend. Going long when the trend is below the 10 dma is counter-trend trading and one should keep it very small. I'm usually short, but shorting this market has been tough. I'm sure you know all this, but I'm just explaining it now now for others that read over my comments.

So, it's early in the week, and it sucks to be down on "EASY MONEY MONDAY". I'm sure lots of folks are with you and probably the PROS are at work here. However, sometimes it just doesn't work out. This trade was like you going double down when you have 11 playing Blackjack, and the dealer has a 3 showing. We shall see if buyers come in later today...... Not sure how much you went long, but for me, and as a general rule I never place a bet over 10%. However, using the TSP for trading can NOT be done very well. It's excellent for MT positions.

Bottom Line: SPY remains below the 10 dma and is still trending down. This could just be the final move down before the next big move up. However, I only trade what is happening and not what I think will happen.

I wait and good luck on your trade Brother!

I will be going long VTI at Vanguard once I like the set-up. The limited moves and having to decided early in the day sucks for sure. It looks like a few buyers are starting to come in. We shall see how we close and maybe we will get Turn around Tuesday. I will continue to only ST trade until I start seeing bigger changes on the 2 hour charts.

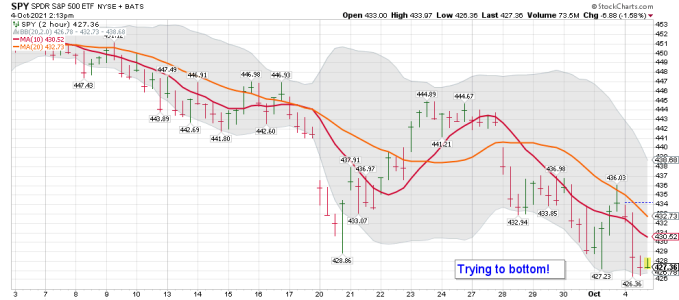
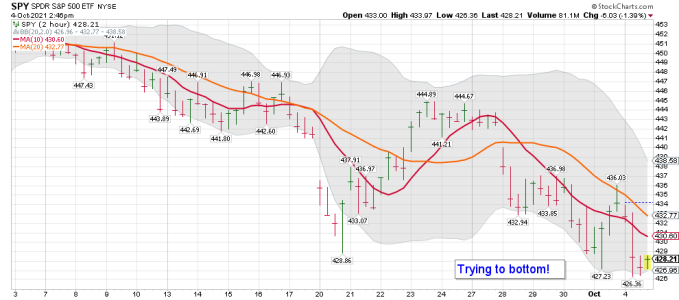
Looking for ST bottom or turn.
 

Attachments

  • a.png
    a.png
    35 KB · Views: 83
  • a.png
    a.png
    30.9 KB · Views: 85
  • a.png
    a.png
    27.6 KB · Views: 85
  • a.png
    a.png
    25.9 KB · Views: 84
  • a.png
    a.png
    25.5 KB · Views: 85
Last edited:
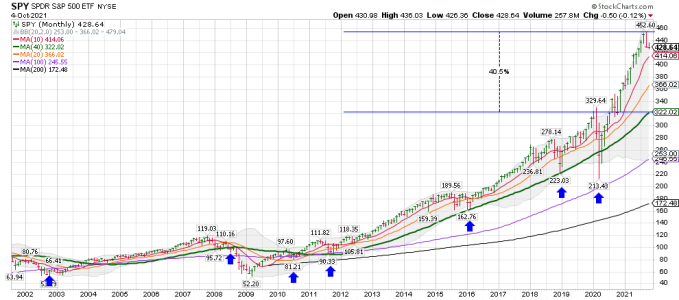
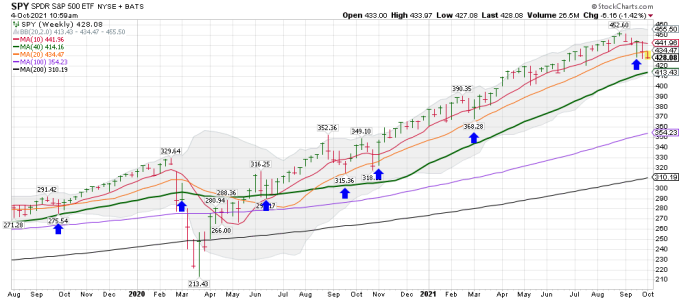
SPY monthly and the mean: In the old days the monthly mean for the SPY was the 40 mma. It rarely got to far stretched above it and would come back down and tag it on occasion. I can tell you it will again someday. When? I will leave the guessing to others, but some think before Joe leaves office. Futures are about flat for those that are holding this tag of the 100 dma. The cycle guys might have to go back to the drawing board if this is a LT daily cycle. We shall see how it plays out.
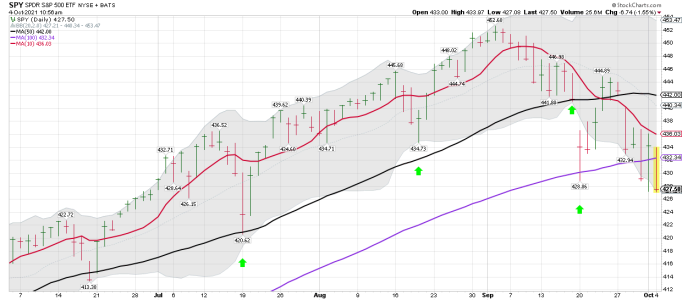
LT = Left Translated Cycles – peak prior the center of a cycle. Since the cycle peaks prior the midway point its spends the most amount of its time in descent and the least amount of its time in ascent. Therefore left translated cycles are associated with a downtrend, printing lower highs and lower lows.

SPY daily: Day 5 since moving below the 10 dma.
 

Attachments

  • a.png
    a.png
    24.3 KB · Views: 81
  • a.png
    a.png
    32.5 KB · Views: 81
Back
Top