-
The Forum works well on MOBILE devices without an app: Just go to: https://forum.tsptalk.com
-
Please read our AutoTracker policy on the IFT deadline and remaining active. Thanks!
-
$ - Premium Service Content (Info) | AutoTracker Monthly Winners | Is Gmail et al, Blocking Our emails?
Find us on: Facebook & X | Posting Copyrighted Material
-
Join the TSP Talk AutoTracker: How to Get Started | Login | Main AutoTracker Page
You are using an out of date browser. It may not display this or other websites correctly.
You should upgrade or use an alternative browser.
You should upgrade or use an alternative browser.
Bear Cave 2 (Bull Allowed)
- Thread starter robo
- Start date
robo
TSP Legend
- Reaction score
- 471
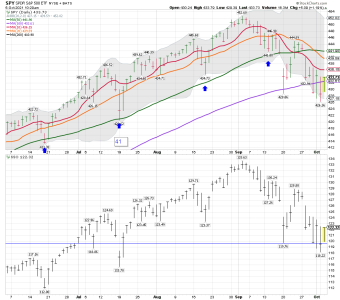
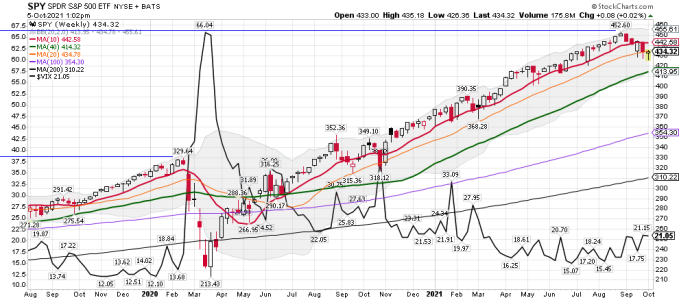
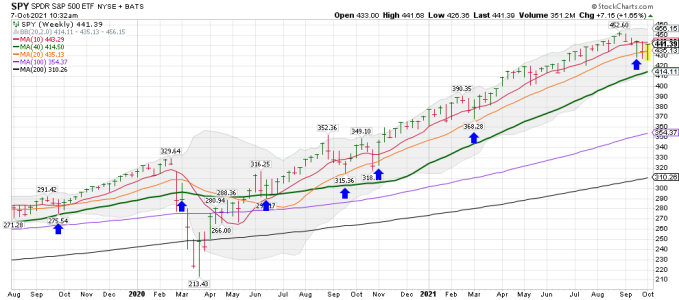
SPY weekly: The Bulls want the SPY back above the 10 wma ASAP...... Watching. Hmmmmm..... I want to see how the sentiment chart plays out that Tom Posted. (See chart below)
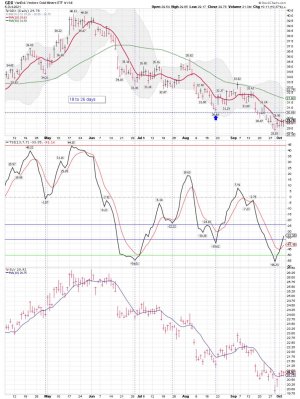
Long SSO, SLV and ( NUGT - VST trade)
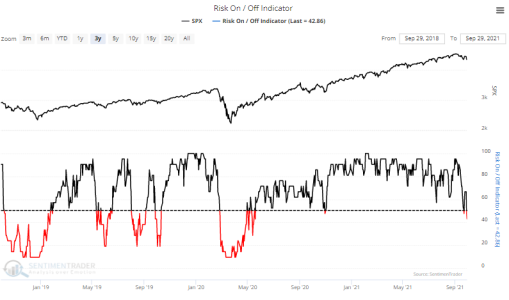
After 17 Months of Speculation, Investors Are in Risk-Off Mode
Jason Goepfert
Jason Goepfert
Published: 2021-10-05 at 07:35:00 CDT
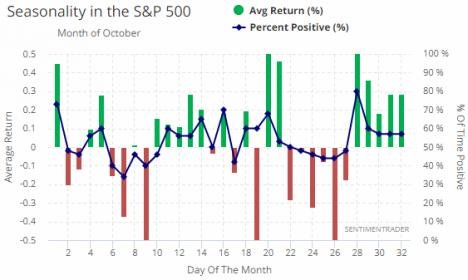
For the first time in over a year, investors have a risk-off mentality and are showing signs of widespread pessimism.
It's not extreme in most cases, and Friday's rebound puts a dent in the argument, but last week showed the first real signs of concern since the spring of 2020.
The Risk-On / Risk-Off Indicator looks at more than 20 indicators and calculates the percentage that are displaying risk-on or risk-off behaivor. You can see them individually by going to Spotlights > Spotlight on Sentiment. The two other times that the indicator tipped into risk-off territory over the past year, buying pressure came in immediately. Last week was the first time that didn't happen.
https://www.sentimentrader.com/blog...l&utm_term=0_1c93760246-e378627ad9-1271291994
Attachments
Last edited:
robo
TSP Legend
- Reaction score
- 471
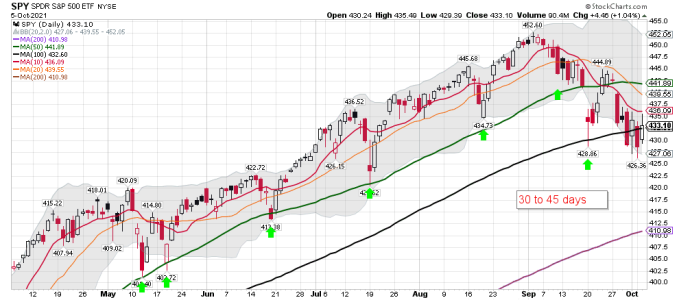
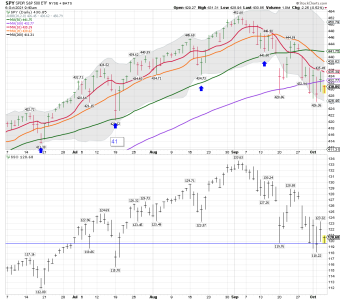
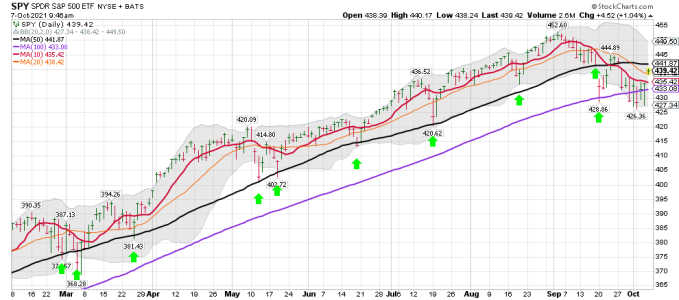
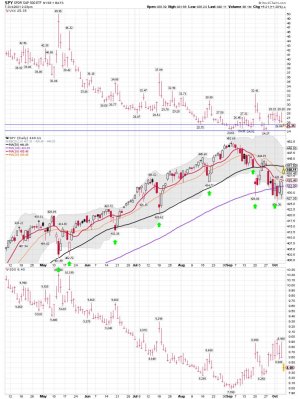
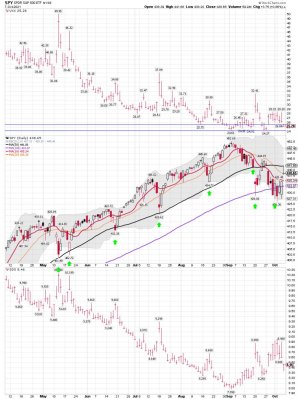
SPY daily: Ok, we can now make it day 6 below the 10 dma......
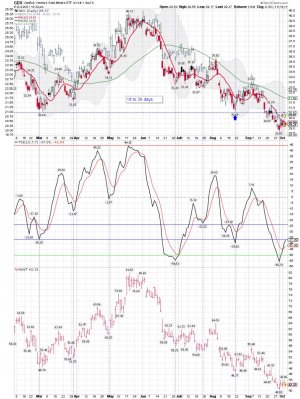
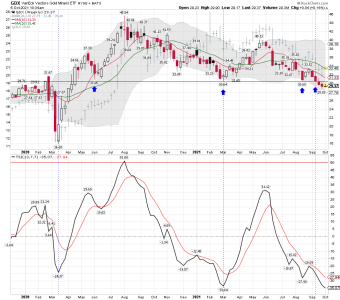
GDX and SLV: Both above the 10 dma..... We shall see if buyers keep coming in..... After washing out anyone with a stop around $20.00ish for SLV it continues to move slowly higher. Another move below $20.00ish wouldn't surprise me in this sector. I'm not calling for that, but this sector has some crazy moves in the pre-market to run stops.
SLV: Day 3 for the move above the 10 dma. It continues to crawl sideways for now. Waiting to see what the dollar does next. LOL.... Let me know "IF" you know for sure
Attachments
Last edited:
robo
TSP Legend
- Reaction score
- 471
SPY daily: Day 7 of the move below the 10 dma. Buyers coming in after the early gap down.....
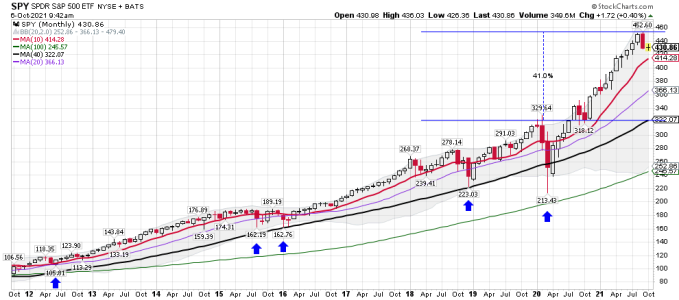
SPY monthly: We could be moving down into the YCL = September was month 18 for the yearly equity cycle, placing stocks late in their timing band for a yearly cycle decline. A YCL will probably get us much closer to the 40 mma. We shall see if the 20 mma holds. As you can see on the monthly chart below the SPY is extremely stretched above the 40 mma. A move down to the 20 mma would just get us back closer to the mean. At some point the rubber band will snap back. When is STBD!
SPY monthly: We could be moving down into the YCL = September was month 18 for the yearly equity cycle, placing stocks late in their timing band for a yearly cycle decline. A YCL will probably get us much closer to the 40 mma. We shall see if the 20 mma holds. As you can see on the monthly chart below the SPY is extremely stretched above the 40 mma. A move down to the 20 mma would just get us back closer to the mean. At some point the rubber band will snap back. When is STBD!
Attachments
Last edited:
robo
TSP Legend
- Reaction score
- 471
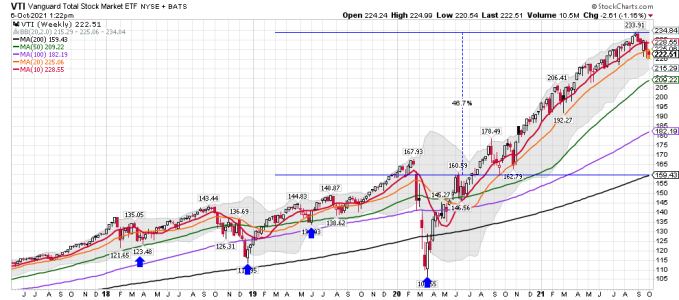
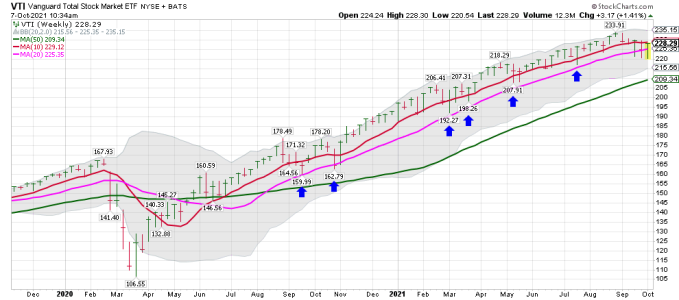
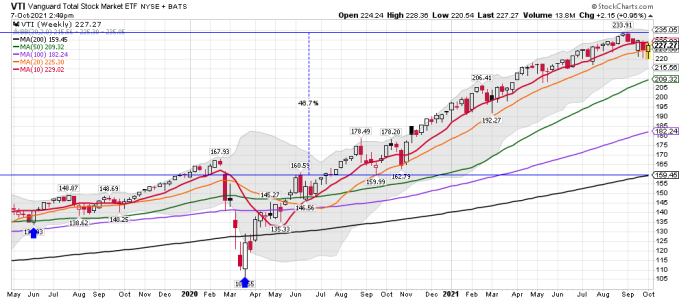
VTI weekly and the ICL/YCL. The odds are increasing that we could see a YCL in the weeks ahead. Will that happen? I don't know, but we are in month 18 since the last YCL and extremely stretched above the 40 wma. A tag of the 40 wma would just be normal for a YCL...... We shall see how it plays out, but one should stay nimble when BTD until we get a confirmed signal that the YCL is in.
The VTI weekly remains below the 20 wma, but buyers are coming in. You can see what is normal based on the chart below. When the index moves this far above the 40 wma one has to question how much longer can this go on. LOL..... It has went much longer then I thought it would, but the Fed has supported this since the 2020 March lows, and then we have all the new BTDer's trading this market mainly from the long-side using leverage.
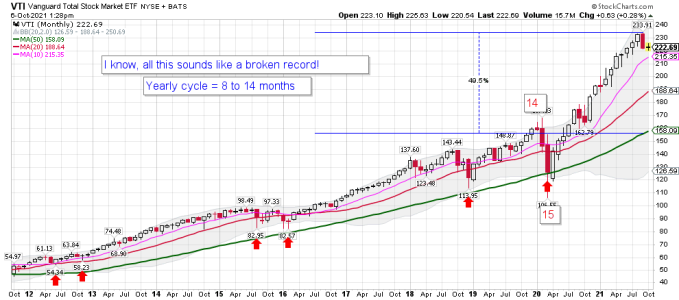
VTI monthly cycle data chart: I use cycles and ma's for trading. I just trade what is happening and not what I think will happen. Once we move below the 10 dma on the daily chart I'm either in cash or shorting. If I do ST trade based on oversold conditions that is ST counter-trend trading and I mainly day-trade. As for MT stock index trades at Vanguard. I wait to buy back VTI and I currently have NO position using VTI.
For the record: I DO NOT USE the data or Link below for trading.
StockMarket Cycles
https://www.youtube.com/watch?v=bSlkt_SBnN8&t=805s
Attachments
Last edited:
robo
TSP Legend
- Reaction score
- 471
Possible! As I always say - We shall see. My magic 8 ball is broken..... (Note the word Potential)
Bottoming pattern
A potential bottoming pattern is in play for stocks. Once this ICL is finished get prepared for a monster rally. More in the nightly reports for subs.
https://blog.smartmoneytrackerpremium.com/2021/10/bottoming-pattern.html
Question for the 8 ball: Is a monster rally coming? LOL..... Just how much is a monster rally?
I do agree that if we get a YCL during this time of the year we should get a very nice rally. First, we need to get back above the 10 dma, and we are seeing a nice move back up today...
VTI daily closeup:
Attachments
Last edited:
robo
TSP Legend
- Reaction score
- 471
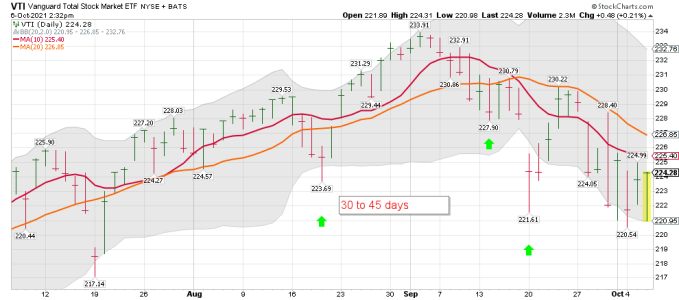
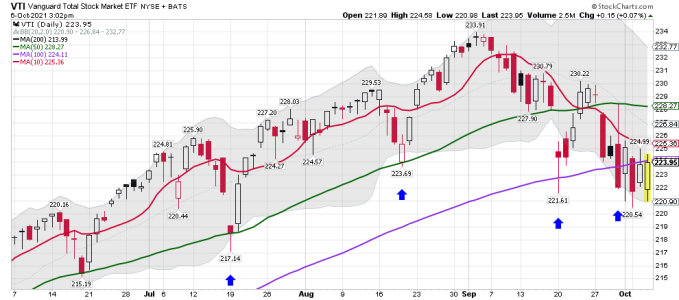
VTI daily: Still having trouble at the 100 dma.... This is the type of market you need to trade small and stay nimble until the next ICL/YCL is confirmed.
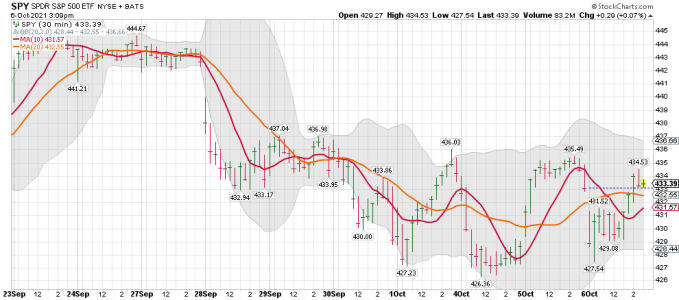
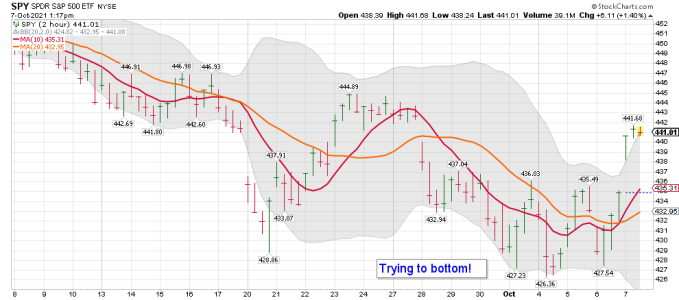
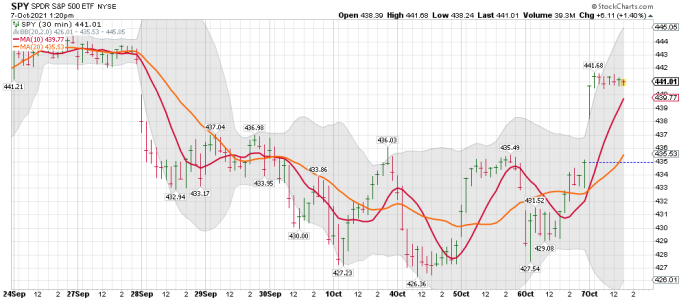
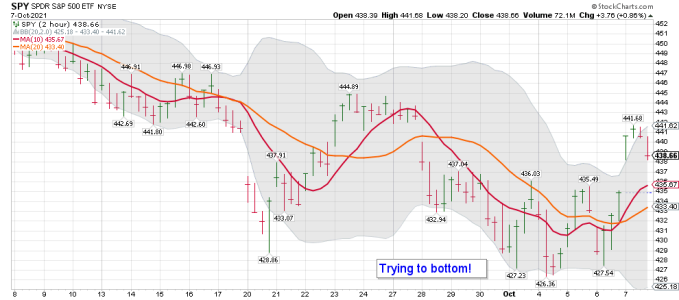
VTI = The Total Stock Market and I be waiting to buy! One would think the Bulls will move the market higher into the close. All I care about is the current price, the ma's, and the price action on the daily. I sometimes post TSI and RSI's, but they don't give me signals so I don't post them much. I use the 30 minute and 2 hour charts to try and trade ST trend changes. I made several trades today. The 2 hour SPY chart be looking ok, and the 30 minute data indicates we are trying to bottom.
We shall see how it plays out, but I sure wouldn't be betting the farm just yet! Wait for a confirmed ICL/YCL. Well, that is what I will be doing with my MT funds at Vanguard.
https://stockcharts.com/h-sc/ui?s=SPY&p=30&yr=0&mn=0&dy=10&id=p07706730632&a=1038673832
Attachments
rangerray
TSP Pro
- Reaction score
- 209
I love reading your commentary and looking at your charts, especially concerning SPY and VTI, but I get lost trying to keep up with acronyms or abbreviations. I don't know what ICL/YCL means, though from the rest of your post, I sort of know it has something to do with a yearly cycle. It makes it hard sometimes to follow your posts because I'm a dummy and often have to stop and figure out what the abbreviations mean. Is there a list somewhere that I should familiarize myself with?
robo
TSP Legend
- Reaction score
- 471
I love reading your commentary and looking at your charts, especially concerning SPY and VTI, but I get lost trying to keep up with acronyms or abbreviations. I don't know what ICL/YCL means, though from the rest of your post, I sort of know it has something to do with a yearly cycle. It makes it hard sometimes to follow your posts because I'm a dummy and often have to stop and figure out what the abbreviations mean. Is there a list somewhere that I should familiarize myself with?
First, thanks for looking over my work. I will stop using those abbreviations in the future. I will post some of the terms and a few comments about using cycle data. Not a problem Brother.
Take Care!
robo
TSP Legend
- Reaction score
- 471
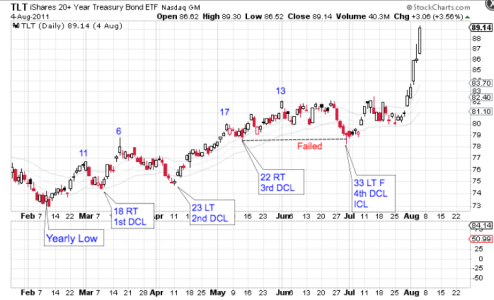
Cycles - A place to start - The most important point is this - "Cycle analysis helps us to determine where we are in the current cycle to help steer us towards a higher probability set-up that matches our risk tolerance."
The comment above is why I track cycles. I trade using the ma's and some other tools. ( I'm a trend trader)
Cycle Trading Guidelines
Cycle analysis helps us to determine where we are in the current cycle to help steer us towards a higher probability set-up that matches our risk tolerance.
The ideal time to buy is at a cycle low.
* There are 4 cycle lows that we look for:
– The daily cycle low = (DCL)
– The intermediate (weekly) cycle low= (ICL)
– The yearly cycle low (YCL)
– the multi-year cycle low
– The status of the yearly & multi-year cycles are the back drop as we monitor the interaction of the daily cycle with the intermediate cycle.
* Generally a swing low in the cycle’s timing band for a low has good odds of spotting the cycle low.
* Place Stop below the cycle low.
* Further confirmation arrives with a break of the declining trend line.
* The yearly cycle low provides the best opportunity of the year for gains.
* Next the intermediate lows (2 or 3 times per year) provide the next best opportunity for gains.
* Followed by the daily cycle low (2 to 4 per weekly cycle).
https://lmtoolbox.wordpress.com/
Daily, Intermediate, Yearly Cycles
A cycle is a series of prices that have a definable peak surrounded by a low point on both ends. The three cycles that we discuss are the Daily, Intermediate (weekly) & Yearly Cycles
A series of daily cycles comprise an intermediate cycle. A series of intermediate cycles comprise a yearly cycle. Cycles are measured from cycle low to cycle low.
The Daily Cycle
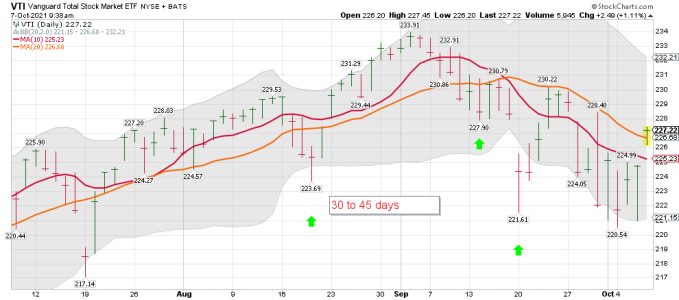
The smallest cycle that we discuss is the daily cycle. The daily cycle averages about 20 – 25 days for the dollar, gold, the Miners, the CRB and bonds. The equities daily cycle runs about 30 – 45 days. Three to five daily cycles tend to comprise an intermediate cycle.
Attachments
Last edited:
robo
TSP Legend
- Reaction score
- 471
You can try his service for 6 weeks and during that time learn about cycles. Ensure you cancel before the 6 week period before it renews if you understand the basic concept of how to use cycles, and would like to go it by yourself. I think it's about $100.00 for 6 months. Like I said, I don't use cycles for trading, but find them very useful for helping with setups/odds of making trades.
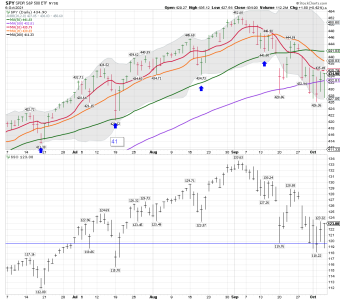
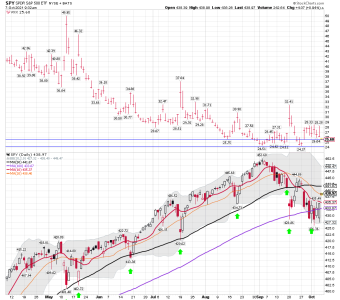
As you can see by his post below, going long after the Bullish Reversal was a tad early. However, I find cycle data very useful as part of my Risk/Reward trading data. You can now see why I point out the daily cycle days in my comments and on my charts. I'm not a cycle expert, and I will leave the cycle counting to the cycle dudes. I posted my SPY cycle chart below. What Tom and other's here do at TSPtalk is pretty darn good for investing in TSP in my opinion.
Hope this helps.
Take Care!
Bullish Reversal
Posted on October 2, 2021
Stocks formed a bullish reversal on Friday.
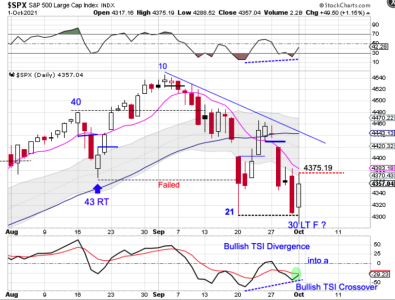
Stocks broke below the day 21 low on Friday to extend their daily cycle decline. Friday was day 30, placing stocks in their timing band for a DCL. Friday’s bullish reversal eases the parameters for forming a swing low. A break above 4375.19 will form a swing low. Then a close above the 10 day MA will signal the new daily cycle. Stocks are in a daily downtrend. They will remain in their daily downtrend unless they can close back above the upper daily cycle band.
In the Weekend Report I discuss why I expect this to be not only a daily cycle low, but an intermediate cycle low as well. And what I am looking for to signal a final melt-up phase to this bull run.
This week I am offering a special 6 Week Trial Subscription offer for $15. Your 6 week trial subscription you will give you full access to the premium site which includes:
1) The Weekend Report, which is posted usually Saturday mornings. It discusses Dollar, Stocks, Gold, Miners, Oil, & Bonds in terms of daily, weekly and yearly cycles – Which includes the Likesmoney Cycle Tracker.
2) The Mid-Week Update. Posted on Wednesday’s is a review of the daily charts for the above mentioned asset classes.
3) The Weekend Updates take a look of the daily & weekly charts of GBTC, DAX, GYX, NATGAS & XLE.
4) Weekly Update of the Bullish Percentile Bingo
5) Frequent updates of my proprietary FAS Buy/Sell Indicator
The goal of the Weekend Report is to develop an on-going framework of expectations using cycle analysis.
Attachments
robo
TSP Legend
- Reaction score
- 471
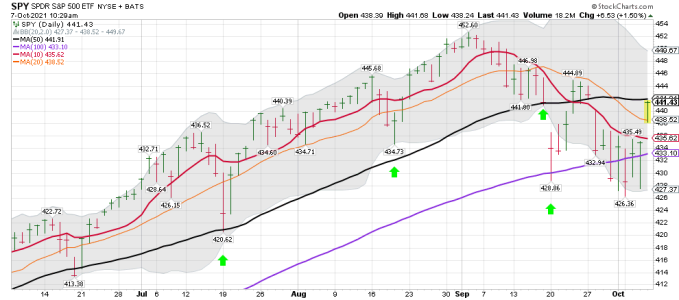
SPY daily: A nice gap up above the 10 dma and tagging the 20 dma this morning. Closing back above the 50 dma this week would be a big win for the Bulls, and maybe a signal the ICL is in! I'm doing some short-term trading this morning until this all plays out.
A move back above the 50 dma should also help all the folks that BTD a tag early and get back to even. If the 50 dma now acts like resistance that would not be good for the rest of this week. But, we will just have to wait and see if buyers show up and move the SPY back above the 50 dma on a closing price.
https://stockcharts.com/h-sc/ui?s=SPY&p=D&yr=0&mn=6&dy=0&id=p24321302056&a=1033706605
https://stockcharts.com/h-sc/ui?s=VTI&p=D&yr=0&mn=3&dy=0&id=p99095353336&a=1026100062
Attachments
Last edited:
rangerray
TSP Pro
- Reaction score
- 209
You can try his service for 6 weeks and during that time learn about cycles. Ensure you cancel before the 6 week period before it renews if you understand the basic concept of how to use cycles, and would like to go it by yourself. I think it's about $100.00 for 6 months. Like I said, I don't use cycles for trading, but find them very useful for helping with setups/odds of making trades.
As you can see by his post below, going long after the Bullish Reversal was a tad early. However, I find cycle data very useful as part of my Risk/Reward trading data. You can now see why I point out the daily cycle days in my comments and on my charts. I'm not a cycle expert, and I will leave the cycle counting to the cycle dudes. I posted my SPY cycle chart below. What Tom and other's here do at TSPtalk is pretty darn good for investing in TSP in my opinion.
Hope this helps.
Take Care!
Bullish Reversal
Posted on October 2, 2021
Stocks formed a bullish reversal on Friday.
Stocks broke below the day 21 low on Friday to extend their daily cycle decline. Friday was day 30, placing stocks in their timing band for a DCL. Friday’s bullish reversal eases the parameters for forming a swing low. A break above 4375.19 will form a swing low. Then a close above the 10 day MA will signal the new daily cycle. Stocks are in a daily downtrend. They will remain in their daily downtrend unless they can close back above the upper daily cycle band.
In the Weekend Report I discuss why I expect this to be not only a daily cycle low, but an intermediate cycle low as well. And what I am looking for to signal a final melt-up phase to this bull run.
This week I am offering a special 6 Week Trial Subscription offer for $15. Your 6 week trial subscription you will give you full access to the premium site which includes:
1) The Weekend Report, which is posted usually Saturday mornings. It discusses Dollar, Stocks, Gold, Miners, Oil, & Bonds in terms of daily, weekly and yearly cycles – Which includes the Likesmoney Cycle Tracker.
2) The Mid-Week Update. Posted on Wednesday’s is a review of the daily charts for the above mentioned asset classes.
3) The Weekend Updates take a look of the daily & weekly charts of GBTC, DAX, GYX, NATGAS & XLE.
4) Weekly Update of the Bullish Percentile Bingo
5) Frequent updates of my proprietary FAS Buy/Sell Indicator
The goal of the Weekend Report is to develop an on-going framework of expectations using cycle analysis.
Absolutely, this stuff helps out a mere park ranger :smile:
robo
TSP Legend
- Reaction score
- 471
Ray,
Glad that it helps. Cycle data is an important tool in my risk management tool box! LOL.... Like the Kenny Roger's song.
Kenny Rogers - The Gambler
https://www.youtube.com/watch?v=7hx4gdlfamo
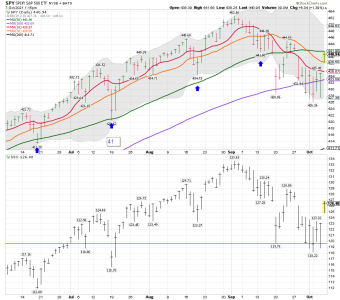
SPY daily: Pushing up on the 50 dma..... Time to start watching the weekly charts again.
SPY weekly: The 10 wma be up next.....
VTI weekly: Buyers are coming in.......
Attachments
robo
TSP Legend
- Reaction score
- 471
SPY daily and the 50 dma: First try remains resistance..... We shall see how we close. One would expect another go at it before the close..... Selling my SSO and looking at a SDS Beer Money Trade!
https://stockcharts.com/h-sc/ui?s=SPY&p=D&yr=0&mn=4&dy=0&id=p94369522392&a=1025684225
SPY 2 hour and the 30 minute charts: Watching for signs of another big move up or down.
https://stockcharts.com/h-sc/ui?s=SPY&p=D&yr=0&mn=4&dy=0&id=p94369522392&a=1025684225
SPY 2 hour and the 30 minute charts: Watching for signs of another big move up or down.
Attachments
robo
TSP Legend
- Reaction score
- 471
SPY daily: I'm still short-term trading and one would think we will see a push back up to test / try another break-out above the 50 dma before the close..... The move back above the 10 dma is a buy signal for some systems as it is for mine. However, I use the closing price, but so far so good. The gap remains a concern in the short-term. This market stay has plenty to be concerned about.
Bottom Line for me: I'm not going to bet the farm on this move back above the 10 dma. I still remain flat at Vanguard, but made some nice money trading SSO and a few other indexes.
Bottom Line for me: I'm not going to bet the farm on this move back above the 10 dma. I still remain flat at Vanguard, but made some nice money trading SSO and a few other indexes.
Attachments
robo
TSP Legend
- Reaction score
- 471
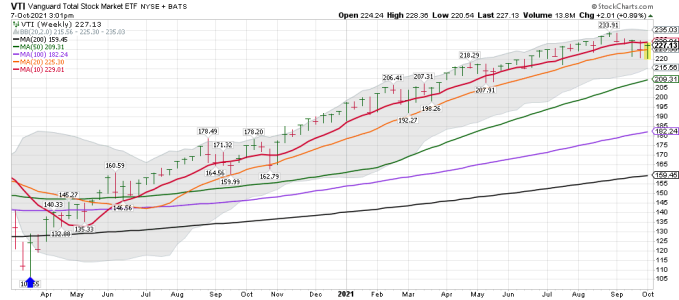
VTI weekly: Time to start tracking the weekly data more.
VTI remains below the 10 wma, so still no MT buy signal. That doesn't mean I'm not trading from the long-side in other accounts. The point is try to wait for a confirmed signal, and YES YOU WILL GET WHIPSAWED sometimes. However, I just take the signals based on the cycle data and the current trend based on the moving averages. Others have different systems that also work well for them. I use the KISS system and keep it much smaller these days based on my age and that I'm retired now.
I will continue to post more weekly data as we all try and spot the next ICL. It sure doesn't feel like one yet, but the cycles dudes are leaning that way. This is a stock market of extremes so trying to use the mean hasn't helped much.
VTI weekly: A closer look. Since the March 2020 low the weekly trend hasn't tagged the 20 wma very much. This has been a very powerful move as the BTDer's and the FED have pored so much money into stocks.
Bottom Line: You can see how the weekly closing prices remained above the 10 wma for months. Only small pullbacks that even tagged the 20 wma. We shall see how this move plays out after we move back above the 10 wma. I will be using the VTI index for my buy signals. I prefer the Total Stock Market for our Vanguard accounts.
Attachments
robo
TSP Legend
- Reaction score
- 471
SPY daily after the close: It looks like we might have some tough resistance at the 50 sma...... We shall see if they can get another gap up tomorrow morning to test the 50 sma again. Thought it was best to start putting sma instead of dma. 50 sma = (50 day simple moving average is the black line on this chart). The 10 sma is the red line and the 20 sma is the orange line. That way it matches the data on the upper left corner of my charts.
Attachments
Bullitt
Market Veteran
- Reaction score
- 75
Despite the cycle low being put in, I'm thinking the market is still broken until it can get above 4450. That level would negate another move down. Today's gap is already pulling prices back towards the 10 DMA.
A move to 4100-4200 is looking very likely here. Head and shoulder patterns all over the place too.
A move to 4100-4200 is looking very likely here. Head and shoulder patterns all over the place too.
Last edited:
robo
TSP Legend
- Reaction score
- 471
Despite the cycle low being put in, I'm thinking the market is still broken until it can get above 4450. That level would negate another move down. Today's gap is already pulling prices back towards the 10 DMA.
A move to 4100-4200 is looking very likely here. Head and shoulder patterns all over the place too.
Plenty of damage done to the BTDer's daily pattern. I think some are selling rips now! We shall if the gap fills tomorrow or maybe another push towards the 50 sma..... I went flat and will look things over in early trading
SPY 2 hour chart:

