Bear Cave 2 (Bull Allowed)

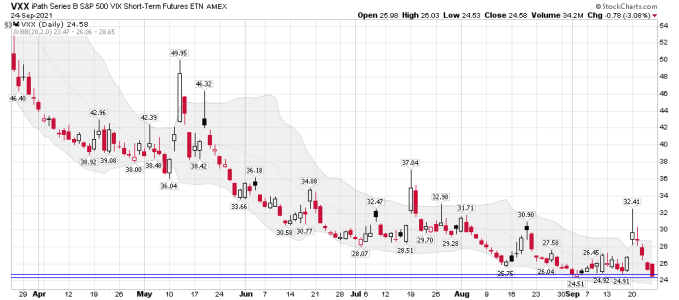
Yes Sir: It has been pretty wild trading VXX...... Not recommend for most traders. Not the first time I have posted an article about the VIX.

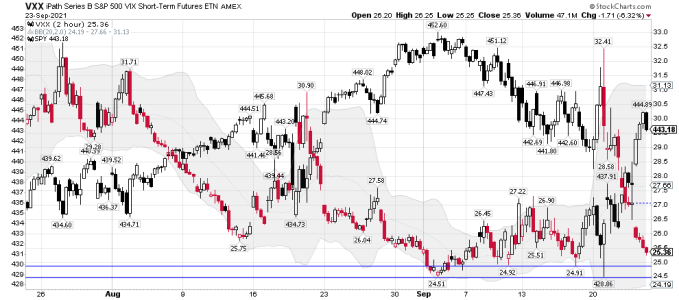
VXX/SPY 2 hour trading chart: It's been wild ST trading these two this week.... VXX looks to be moving back down under $25.00ish

(Chart 2)

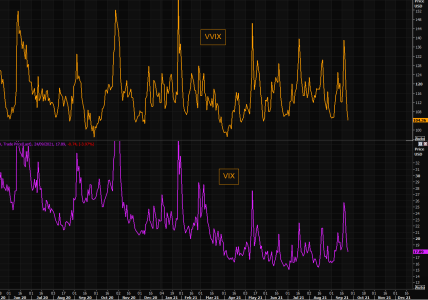
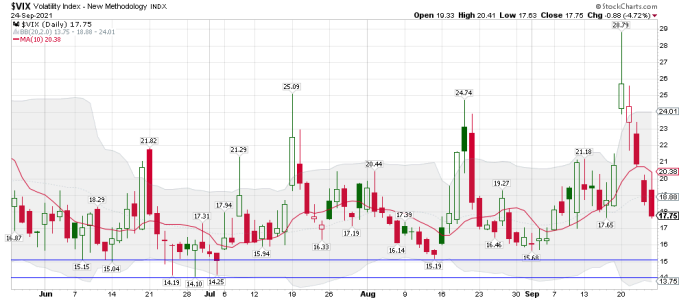
VIX - the master of frustration
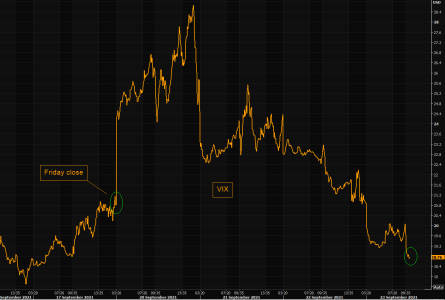
The VIX round trip Evergrande move has now been completed.

VIX is trading well below Friday's close at the moment, currently printing 18.77!

Needless to say, this has produced huge p/l pain, as the crowd managed loading up on protection at too elevated levels once again and are now puking all those hedges...

We stick with our general logic on protection:

Buy protection when you can, not when you must.
 

Attachments

  • a.png
    a.png
    29.7 KB · Views: 70
  • a.png
    a.png
    27.5 KB · Views: 68
LOL..... Yes Sir!

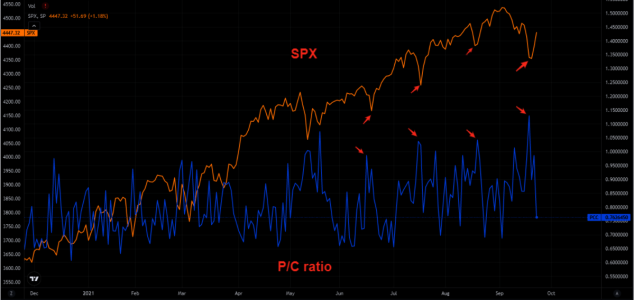
The crowd continues to love puts at local market lows
Max hedge frustration continues. The crowd continues to load up on puts at local market lows. Nothing new, but the feedback loop of "hedges only cost money" is getting reinforced by every time the same frustration occurs.

Earlier conversation with a PM today can basically be concluded with him asking "..why even buy hedges".
https://themarketear.com/
 

Attachments

  • a.png
    a.png
    174 KB · Views: 69
Volume

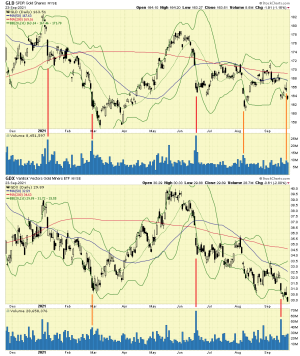
Where is the capitulation volume for GLD (while GDX volume doesn't seem to mean much).

volume.png

Consistent capitulation volume on SPX. Maybe I should quit wasting my time with the metals.

volume 2.png
 
Re: Volume

"Consistent capitulation volume on SPX. Maybe I should quit wasting my time with the metals."

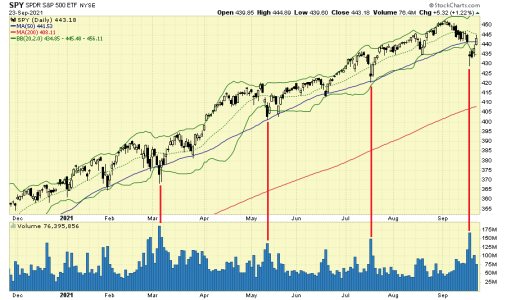
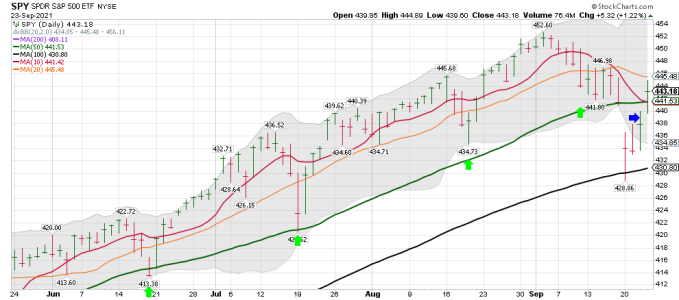
I still like to trade the metals/miners, but keep it much smaller these days. For the last year it has been much easier to trend trade the stock indexes. After a nice bounce for the SPY the last few days I'm waiting to see if we pullback some and maybe BT the 50 dma or fill the gap. Probably many will add if that happens based on the cycle data.

(Chart 1)

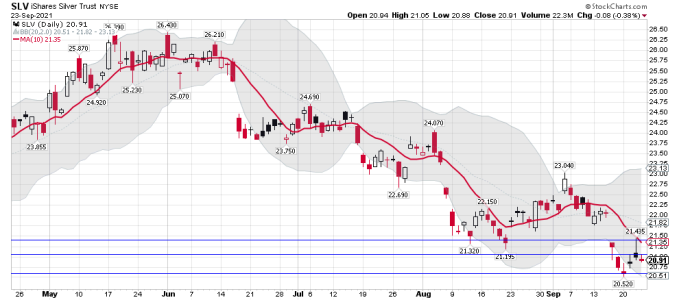
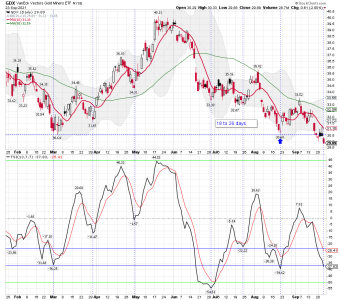
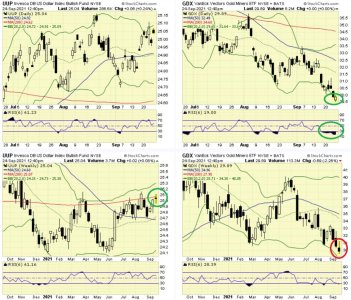
I'm still long some SLV and bought a small tranche of GDX back yesterday.

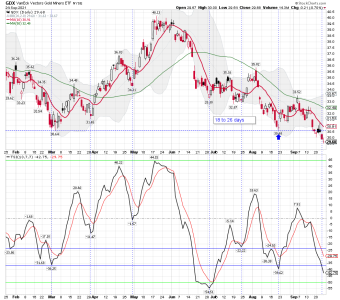
Chart 2 and 3)

I'm still ST trading GDX (Buying and selling quickly) after the lower BB tag. I still think we will see a move back up to the upper BB soon..... LOL.... That is just a guess, and when ST trading anything can happen. That's what stops are for. So, I'm back to my pair trade again.

Also, please help support this site by clicking on some of the ads you see.
 

Attachments

  • a.png
    a.png
    28 KB · Views: 69
  • a.png
    a.png
    26.2 KB · Views: 70
  • a.png
    a.png
    63.7 KB · Views: 69
Last edited:
Re: Volume

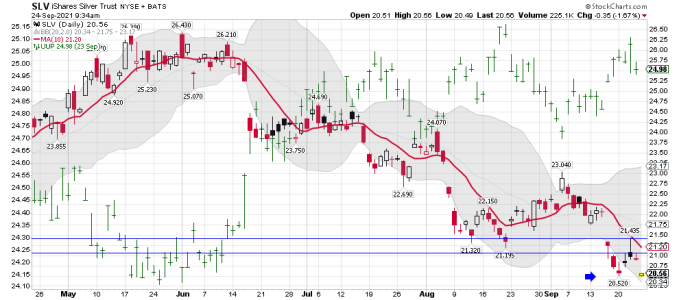
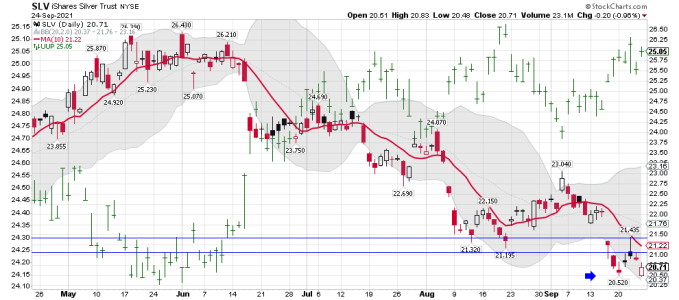
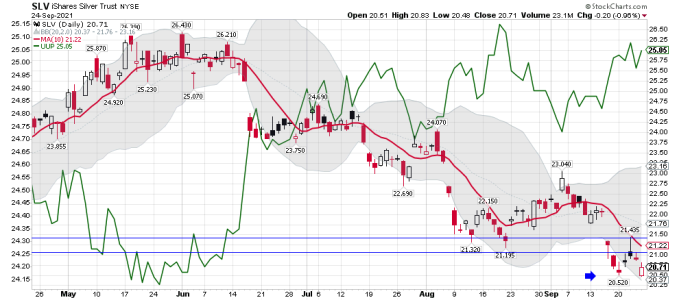
SLV/UUP daily: UUP on the move and smacking down my SLV ST trade. I have a stop @ $20.25, and it looks like we will test the the $20.52 marker this morning. We shall see if buyers come in.... Keep in mind it's Free Lunch Friday so the dippers should be buying stocks this morning.

Added a tranche of AGQ for a day trade after SLV undercut the $20.52 marker.... We shall see how it plays out, but I will not be holding the AGQ position over the weekend.

https://stockcharts.com/h-sc/ui?s=SLV&p=D&yr=0&mn=5&dy=0&id=p84227766910&a=1027369394
 

Attachments

  • a.png
    a.png
    29.2 KB · Views: 62
Last edited:
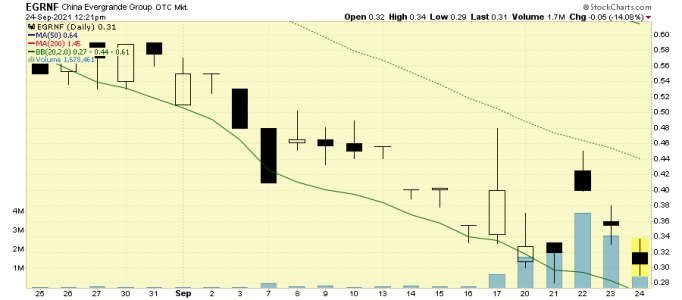
Evergrande

China Evergrande Group missed the deadline to pay its $83.5 million in coupon payment on dollar bonds with a face value of $2.03 billion to global investors, the Wall Street Journal reported on Friday. However, the report noted that the bondholders didn't receive any money and now a 30-day grace period is in effect, with Evergrande still being able to deliver on its payments, after which bondholders can call a default.

https://www.teletrader.com/news/details/56422947?internal=1&ts=1632501168732

evergrande.png

I bought GDX this morning because the chart looks close to making a low and sold it for a small profit because of the ugly weekly candle. Also dollar stuck at the 200 WMA. Gold will get smoked if it breaks through.

chart.jpg

I wish we could get the uncertainty (Evergrande bankruptcy, .gov shutdown, tapering, etc.) over with so I can buy and hold something.
 
Last edited:
Re: Evergrande

Time for bargain hunting protection - VIX guy just called us

Our biggest contra indicator when it comes to volatility is the "VIX guy". So far he has had a 100% rock solid track record, the inverted way.

Latest reasoning is that Evergrande isn't a problem anymore, Fed uncertainty is gone and corona isn't an issue anymore. He basically explained that the vol event of this week was a one off and that vols and VIX should drift lower for longer from here.

Needless to say, given his 100% inverted track record, the long vol play is suddenly becoming more interesting in our view.

We have been hoping for VIX to come down and we set this Friday as the "hopefully" long VIX day earlier this week.

VIX is well below last Friday's close and has crashed since Monday's 28.79 intra day highs.

VIX is not dirt cheap, but given the sharp move lower, and the fact VVIX has come down quickly as well, we are eager to try some VIX longs going into the weekend.

VIX overreacted during the sell off but has been the relatively more exuberant during the bounce. Despite VIX at Thursday's lows, Spoos is still some 25-30 handles lower (chart 2).

Outright long VIX and/or use it to hedge longs makes a lot of short term sense here.

The entire China situation remains "fluid" and could provide more vol shocks, as well as there are other market risks to consider.

Third chart shows the VIX term structure on Monday and today. From panic buying short end of the curve to puking it. Why not play the contrarian view to finish off the week?

The VIX guy has spoken...
 

Attachments

  • a.png
    a.png
    43.2 KB · Views: 44
  • a.png
    a.png
    21.1 KB · Views: 43
  • a.png
    a.png
    21.9 KB · Views: 44
Re: Evergrande

I'm not sure everybody is the correct word, but we did get very oversold!

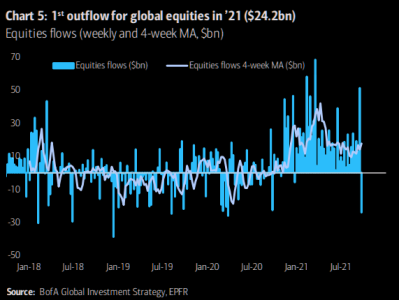
Everybody (panic) sold the dip
Equity flows went from monster inflow pre the Evergrande weekend, to the biggest outflow since March 2020.

Looks like nobody bought the dip, but sold it instead.

Has this market become extremely sensitive to any bigger moves to the downside?

Imagine if this managed testing recent lows...
 

Attachments

  • a.png
    a.png
    56.2 KB · Views: 46
Re: Evergrande

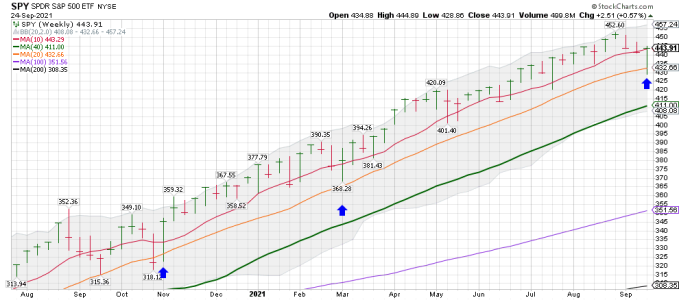
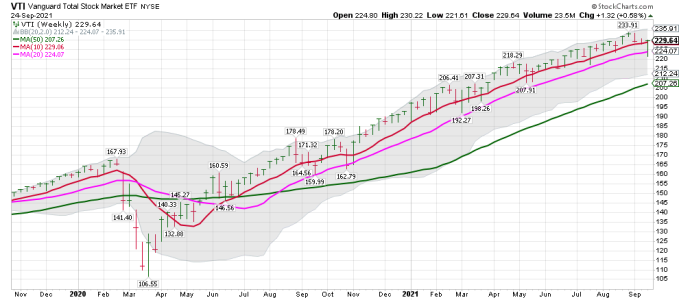
SPY weekly: Chart 1 - Back above the 10 wma....

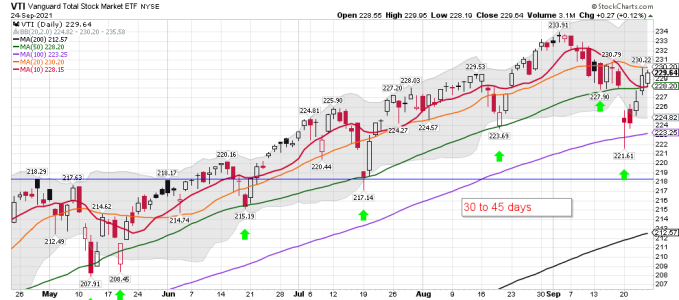
VTI weekly: Chart 2 - Same story..... back above the 10 wma..... Just BTD remains in play.....


VTI daily: Chart 3

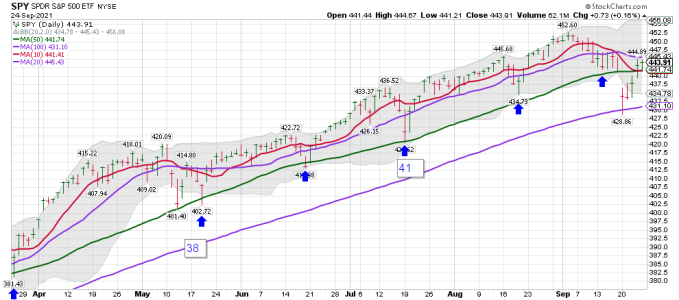
SPY daily: Chart 4 If you BTD at the 50 dma and held (Worried some probably) and then added as we tagged the 100 dma. You had a very nice week...
 

Attachments

  • a.png
    a.png
    25.4 KB · Views: 51
  • a.png
    a.png
    26.1 KB · Views: 52
  • a.png
    a.png
    31.1 KB · Views: 51
  • a.png
    a.png
    30.2 KB · Views: 52
Weekend Report

DCL in stocks and 200 is up. Another week or two of rising for USD and 200 is turning up. Gold DCL next month and 200 is down.

$cycles$.png

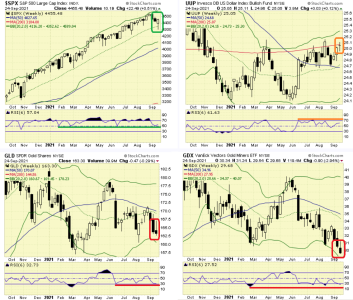
Great weekly SPX candle. USD stuck at 200 WMA. GLD and GDX candles look bad.

charts.png

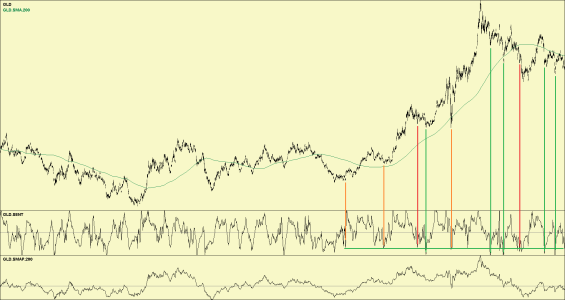
Gold sentiment at a level that sometimes marks a low. Zero sentiment always marks a low.

Markets.png

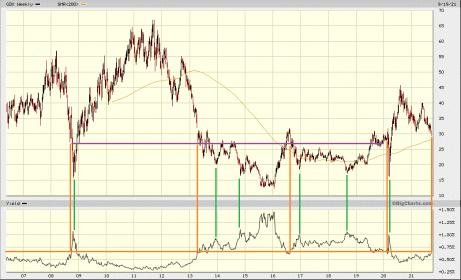
GDX yield not at levels that marked a low in the past.

yield.jpg

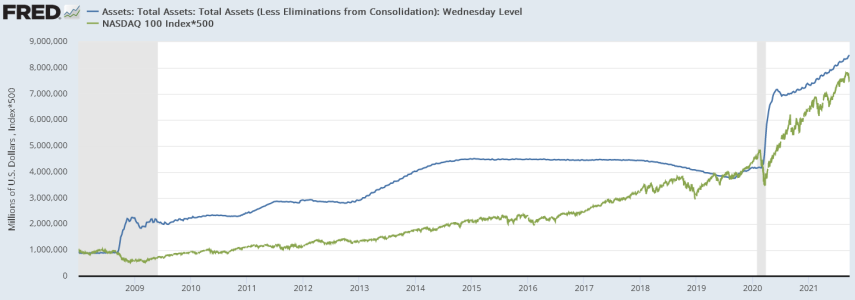
Fed balance continues to grow and stocks follow.

assets.PNG

 
Re: SMT

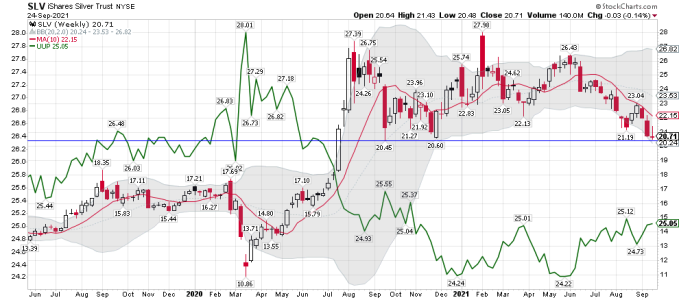
Gold and Silver charts. I remain long some SLV.

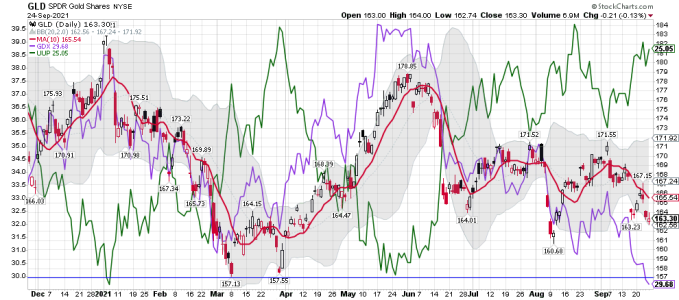
GLD/UUPdaily:
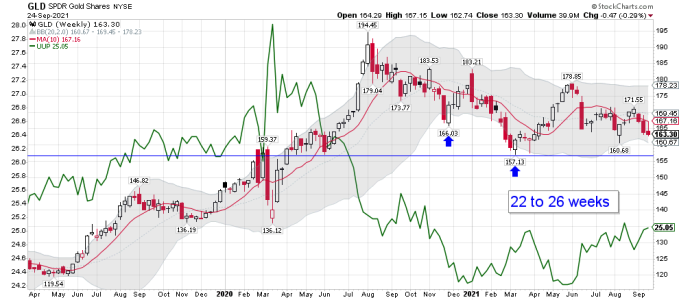
GLD/UUP weekly:
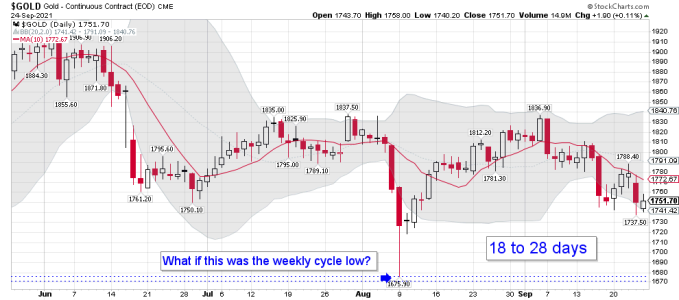
$GOLD daily:
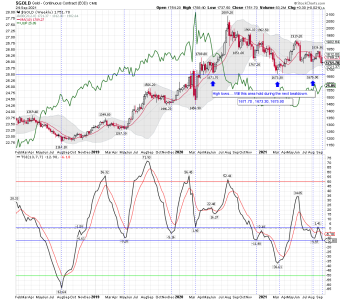
$GOLD/UUP weekly:
SLV/UUP daily:
SLV/UUP weekly:
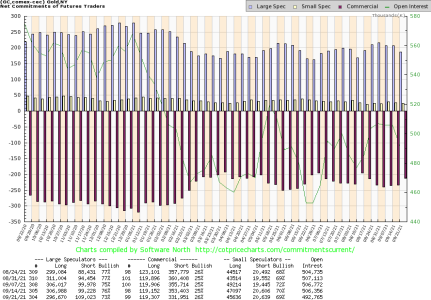
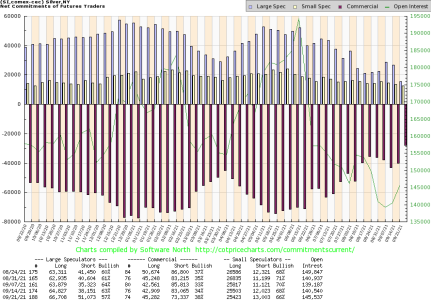
COT SLV and GOLD: Continues to improve. I only track some COT reports, and I don't use them taking/placing trading positions. However, It's nice to know what group of traders agrees with your current position.
 

Attachments

  • a.png
    a.png
    66.7 KB · Views: 64
  • a.png
    a.png
    36.1 KB · Views: 63
  • a.png
    a.png
    27.2 KB · Views: 64
  • a.png
    a.png
    64.8 KB · Views: 62
  • a.png
    a.png
    37.7 KB · Views: 62
  • a.png
    a.png
    37.6 KB · Views: 63
  • a.png
    a.png
    33.8 KB · Views: 61
  • a.png
    a.png
    35.7 KB · Views: 61
Last edited:
Re: SMT

For those that want to keep it simple or are just learning, FibTimer is an above average service to try.

For Sunday, September 26, 2021

This week:

There is a pattern in the SPX of declines seemingly every month that are followed by sharp rallies to new highs. This pattern can be seen in the below daily chart.

This current decline though is deeper and has broken below our rising trend support line.

In fact, it has triggered numerous sell signals throughout our strategies. We have had, this week, a substantial 140-point decline in the S&P 500 Index (SPX) on Monday followed by several rally days which have erased that one-day decline and closed the week for the SPX close to unchanged.

The question is, do we continue higher from here and was this just another short decline with new highs just ahead as has happened over and over in the previous months? Or was this decline the start of a true correction with lower lows still ahead.

The SPX broke down below significant support areas in the past week. However, as has been the case for several months, the bears have not been able to keep control even after a significant breakdown such as the one that just occurred.

At the Monday lows, the percent of SPX stocks above their 50-day moving average dropped to 31% which means that two-thirds of SPX stocks were in short-term downtrends. The percent of S&P 500 stocks above their 200-day moving average fell to 67% which was the lowest level since last October.

The answer will come next week. If we continue higher the strategies will quickly reenter bullish positions. If we turn lower, the strategies are in position to weather the selling.

Though anything can happen next week, it is important to remember that this selling was different than those in the prior months. The SPX broke below its rising trend support line and its 50-day average line. The SPX also broke below the lows of the August declines


Conclusion:

A steep selloff of over 3% on Monday appeared to point to a more severe decline ahead. Instead the SPX rallied on Wednesday through Friday erasing the early week decline.

The NY A-D Line is struggling. It has not made a new high since early July and has been trading mostly sideways since early June.

That puts this strategy in no-man's land. There is no reason the be bullish and no reason to be bearish. We will decide what to do when we see which way the market trades next week.

The SPX position in this strategy is BEARISH. Aggressive traders should be in CASH (money market funds)

S&P 500 Index (SPX) Daily Chart

The Full Free Report can be found at the link Below:

Current S&P 500 and Nasdaq 100 Positions and Analysis for 9/26/21
 

Attachments

  • a.png
    a.png
    14.3 KB · Views: 62
Bearish

https://www.sunshineprofits.com/gol...-bearish-outlook-everything-falls-into-place/

GDX closed at new 2021 lows, and it happened shortly after the ETF confirmed the breakdown below its March and August 2021 lows. That’s exactly what was likely to happen, and that’s exactly what one would expect as the first step of a bigger decline. My previous downside target of ~$28 for the GDX ETF remains up-to-date (in fact, GDX might bottom a bit below that). Naturally, that’s just a temporary downside target after which we might see a breather and then another, even bigger slide.

gdx.png

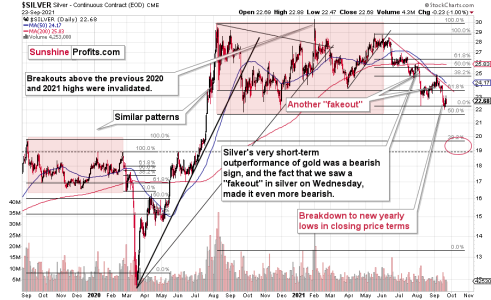
Silver didn’t decline to new yearly lows, but that’s not as important as the fact that it was unable to get back above the previous yearly lows. Consequently, the outlook for silver remains bearish even without considering all the other (non-silver-price-based) factors.

silver.png

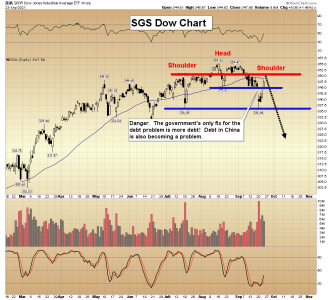
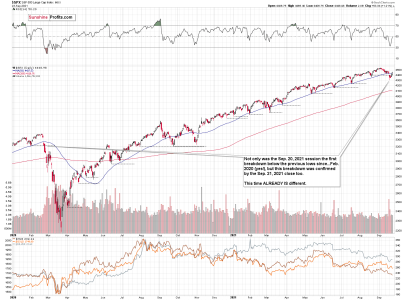
The stock market invalidated the breakdown below the previous lows, so the technical situation here improved. Nonetheless, due to two closes below the previous lows, the situation is already different than it was before. Perhaps stocks are forming a head and shoulders pattern here, but it’s too early to say so with certainty.

spx.png


P.S. Too bad Atlantis splintered. Not enough people at Atlantis 1.0, Atlantis 2.0 or here to create a real brain trust.
brain.jpg
 
Re: Bearish

"""Too bad Atlantis splintered. Not enough people at Atlantis 1.0, Atlantis 2.0 or here to create a real brain trust.""""

I still check in daily and sometimes find a nugget or two about gold. As for the stock indexes you know how I roll MT, and I'm mainly a trend trader. The stuff posted over there has no value to me. I was there because we had a bunch of folks trading the metals/miners, and it was fun. Those days are long gone and it became way to political for me. As for trading. My ST trading is a tad different. Most folks here are using TSP and are NOT ST traders like us. Therefore not much traffic in this tread. I like posting here because I don't have to put up with political crap. Even 321 gold has way to much political crap for me in some of its articles, so I read very few article over there now. The country is so divided right now, with many people HATING each other based if they voted Blue or Red. It's crazy! Morris at 321 gold keeps it on subject, and is a TA guy. I still like looking over that type of data. Tom does a nice free daily report. Also, Tom does NOT allow that kind of political stuff to go on here.
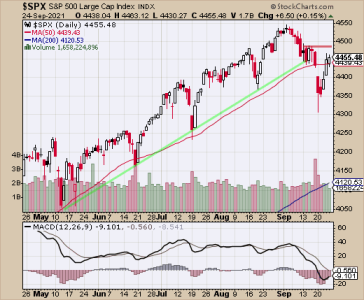
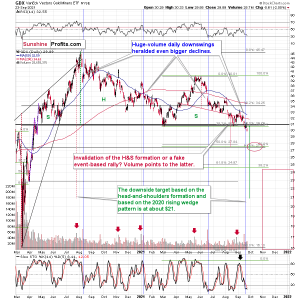
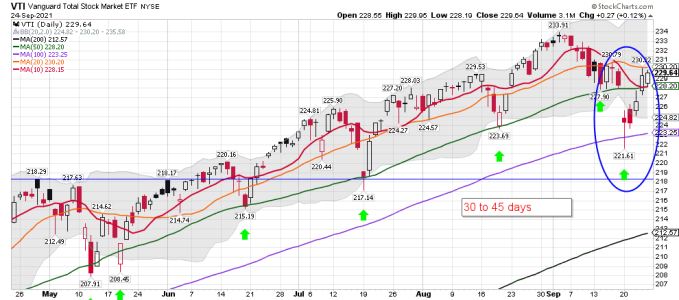
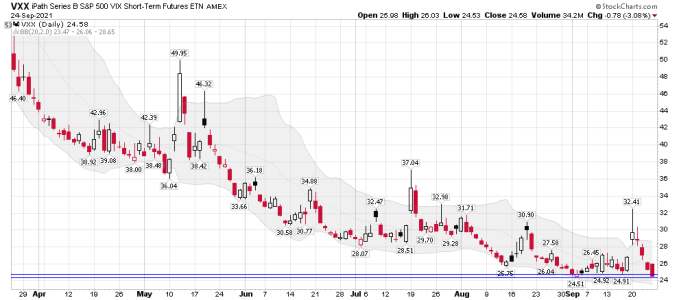
We shall see how next week plays out as we go into "Easy Money Monday" Lots of traders bought this last dip and so far it looks like a nice winner. The VIX was smashed back down..... LOL.... Why pay for protection? Just BTD! I do like to ST trade VXX when I like the setup.

VTI daily chart:
VXX daily chart:
 

Attachments

  • a.png
    a.png
    32.7 KB · Views: 65
  • a.png
    a.png
    21.1 KB · Views: 65
Last edited:
Back
Top