Bear Cave 2 (Bull Allowed)

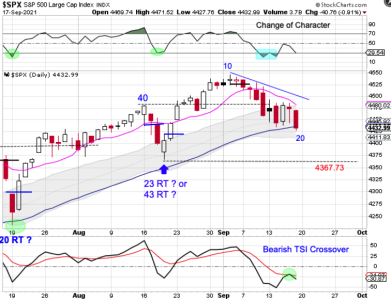
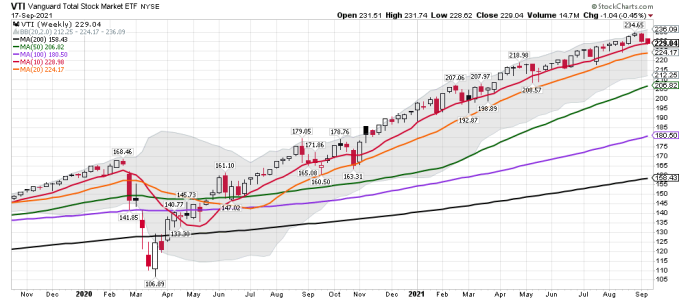
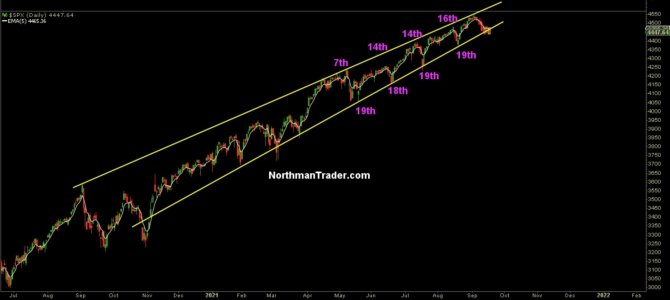
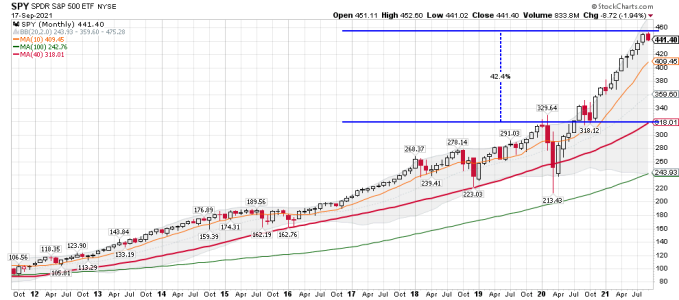
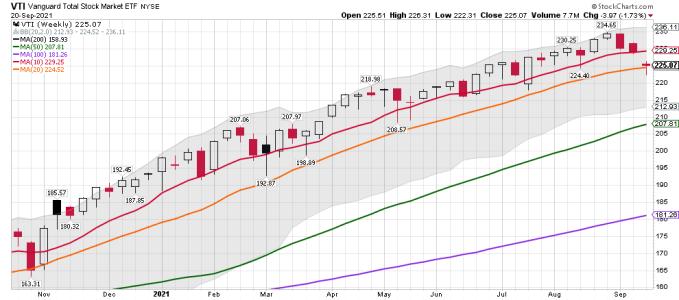
SPX cycle data: Is there a possible weekly cycle low coming? (See my VTI weekly chart below) We are sure do one....... LOL..... We shall see!

The 9/18/21 Weekend Report Preview

Stocks closed below the 50 day MA on Friday.

Closing below the 50 day MA signals the daily cycle decline. The peak on day 10 sets stocks up for a left translated daily cycle formation. A break below the previous DCL of 4367.73 will from a failed daily cycle to confirm the intermediate cycle decline. Stocks are currently in a daily uptrend. But a close below the lower daily cycle band will end the daily uptrend and being a daily downtrend.
 

Attachments

  • a.png
    a.png
    125.2 KB · Views: 59
  • a.png
    a.png
    28.3 KB · Views: 57
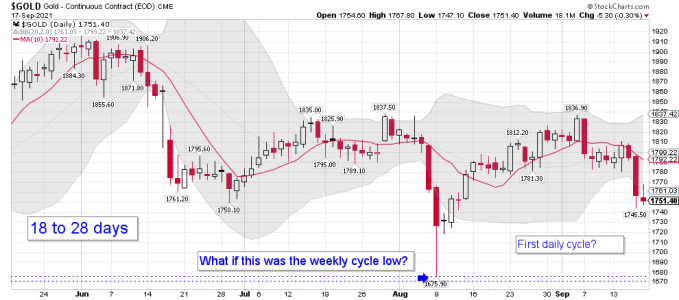
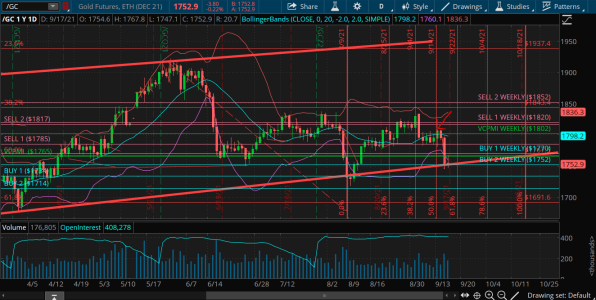
Gold Daily:
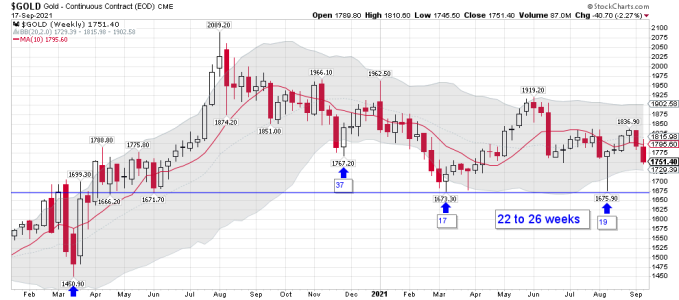
Gold weekly:

Bottom line: Depending on whom you ask, it's looking Bullish to some and Bearish to others!

We all wait for the FOMC meeting next week.... Will it be Dovish or Hawkish news. Bullish or Bearish...... We shall see..... Waiting on the swing low is the best option and gold "COULD" still move down to BT the $1675ish level..... Anything is possible in this sector. That is why I keep it small when ST trading, and when fully long keep it around 10% of my Vanguard trading account.
 

Attachments

  • a.png
    a.png
    28.8 KB · Views: 56
  • a.png
    a.png
    25.9 KB · Views: 56
Last edited:
Charts

Time for the monthly rebound.

Dips.jpg

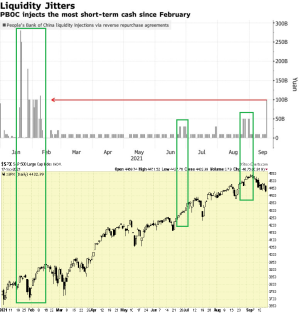
PBOC pumped in 100 billion yuan (14 billion USD) this weekend. Kinda helped stocks in the past with a lag.

pboc.png

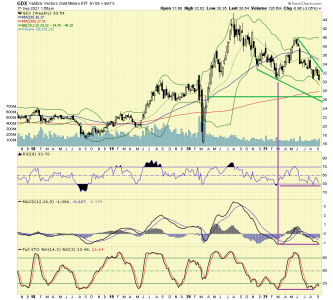
GDX has the 200 DMA, 26-ish gap and trend line below.

gdxw.png

GDX is also moving back into an old trading range with volume support at 27.

Volume.PNG

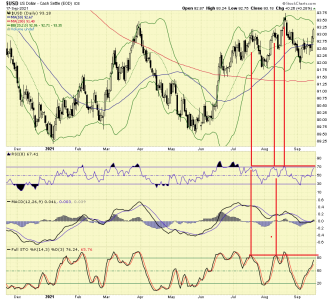
USD nearing a peak so hopefully the metal pain ends on FOMC Wednesday.

usd.png
 
Re: Charts

With the FOMC meeting next week we could get some very good ST trading, and maybe some ICL's. Probably a smack down for gold Sunday Night..... I have a small position that I held over the weekend. LOL.... Will we ever get another YCL for stocks.

Bottom Line: We remain in a downtrend for metals/miners on the weekly charts. I wait to take MT positions.
 

Attachments

  • a.png
    a.png
    24 KB · Views: 60
Re: Charts

Watching.....

Gold: A 20% Price Gain From The Current Seasonal Lows Possible Into Early 2022
Sep. 17, 2021 7:31 PM

On September 14, gold hit $1810 and entered a strong area of resistance according to the VC PMI. There is a strong likelihood that sellers will come into the market at that level. Then it closed below $1810 and activated a bearish signal on the 15th. It came down to complete the extreme below the mean on the daily and to test the Buy 2 level of support. If we get a confirmation of a buy signal on a close above $1752, it will activate a buy trigger, which it just did. We are buying gold at this level. There is a 95% chance of a reversion back up from this level. It is not 100%, but it is highly likely. The initial target is $1770.
https://seekingalpha.com/article/44...asonal-lows-possible-into-early-2022#comments
 

Attachments

  • a.png
    a.png
    63.2 KB · Views: 61
Re: SMT likes silver more than miners

Me too..... However, I’m going to trade the gold miners, and SLV due to all the printing the Fed has done. I normally trade GDXJ and SILJ, but went with SLV this time. I don’t stack the metals anymore, and I sold all the silver I had years ago close to $40.00 an ounce. I’m Not ruling out buying a few bars and putting them in the safe. I have some low interest CD’s coming do and might buy some bars of silver. What’s the best place to buy silver online? I haven’t checked locally yet, but I want to be able to compare the two prices. I’m thinking 10 ounce bars so they are easier to sell or give away as gifts.
 
Re: SMT likes silver more than miners

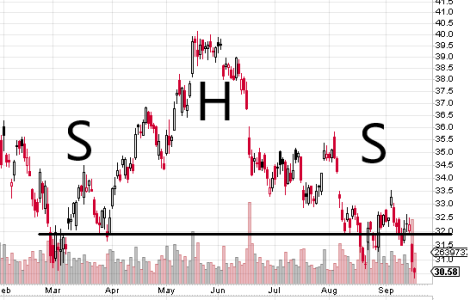
Miners looking very bearish here and a market downdraft will take them down with it. (GDX chart below, neckline could also be 31.) The long term prospects for gold still look bullish with the bull flag and eight+ year cup and handle.

Two gold bugs I used to work with told me it's best to keep the silver and gold to small shillings, that way it's easier to be used during the apocalypse. They bought from various places including local pawn shops and brick brokers. I don't remember who they bought from online. I do remember them being fans of the offerings from the US mint. One thing is there's always a bid/ask and spot doesn't mean much.

gdxhs.png
 
Re: SMT likes silver more than miners

I Bonds:

How To Invest Your Money If You Plan To Spend It in 5 Years
If you need access to your funds in five years, you shouldn’t take too much risk with your investment, said Steven Jon Kaplan, CEO at True Contrarian Investments LLC. He recommends purchasing I bonds.

“If you are going to keep money for five years, especially with today’s dangerous overvaluations, it is essential to have it be safe and guaranteed, and yield more than nearly all other competing safe investments,” he said. “I bonds are guaranteed by the U.S. government and are currently yielding 3.54% compounded semiannually. This will yield a total of just about exactly 19% after five years. As long as you hold them for at least five years, you will get 100% of the interest with no penalty, and if after five years it turns out you don’t need the money, then you can continue to hold them for up to 30 years.”

To purchase an I bond, you can set up an account at TreasuryDirect.gov and link it to any bank or brokerage account.
https://www.gobankingrates.com/inve...-you-plan-to-spend-it-in-5-10-15-or-20-years/

Summary
Even at a zero fixed rate, I Bonds with a return equal to the inflation rate as measured by the Urban Consumer Price Index beat all safe short-term alternatives.
The flexibility of I Bonds is that you can exit anytime after a year (sacrificing 3 months yield for the first five years) or hold for a 30-year inflation hedge.
For I Bonds bought by October 31, the one year yield will likely be 4.8%. You can buy $10,000 electronically at TreasuryDirect and another $5000 with your tax refund.
You can buy as many TIPS as you want, but they come without deflation protection or a tax deferral option, have a lower fixed rate, and come with taxes on phantom income.
A possible strategy would be to max out on I Bonds and add TIPS if you need more inflation protection. The yield disadvantage of TIPS is lower for 20 and 30 year maturities.

https://seekingalpha.com/article/44...ent-4-8-percent-yield-30-year-inflation-hedge
 
Re: SMT likes silver more than miners

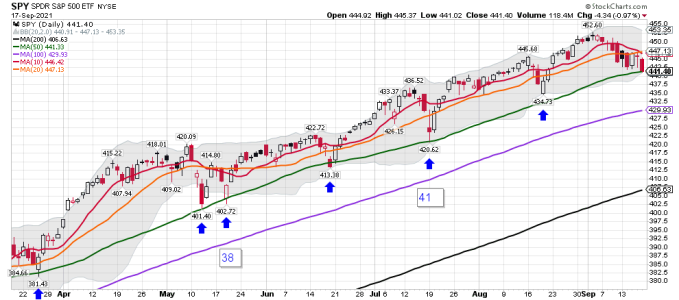
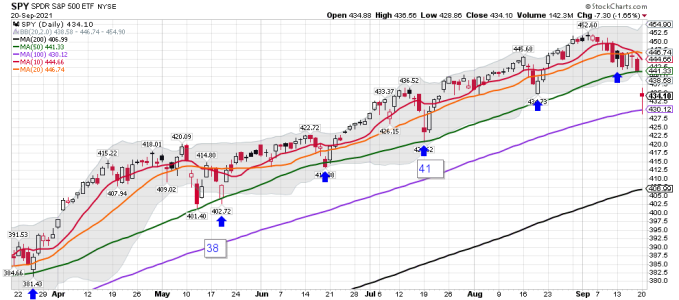
SPY daily: A move down under the 50 dma and getting close to the 100 dma this morning. It doesn't look like a normal "EASY MONEY MONDAY"..... We shall see if buyers come in and we get a DCL today.... This looks more like an ICL is happening, and if so how low do we go. Maybe it wasn't close enough to start buying. We shall see in the days ahead. The 50 dma tag (BTD) pattern sure indicated it was time to buy. My pair trade is still doing ok this morning. (GDX and SLV) LOL.....I sold my SDS after the 50 dma tag, so I think I will just watch today and wait for a signal to buy SSO. Looks like we might get some good ST trading this week.


LOL..... He is talking about guys like me, but I'm flat or shorting once we move under the 10 dma if we are deep into a daily cycle.

thomas
@VolumeDynamics
·
12m
What do the DMA guys use after we plunge under the 200 DMA? 500? 1000? 10000? asking for a friend


thomas
@VolumeDynamics

16m
We're setting up the 2nd Leg of the Corona Crash.
https://twitter.com/VolumeDynamics
 

Attachments

  • a.png
    a.png
    31 KB · Views: 73
Last edited:
A classic bearish day when just about everything is down but bonds and gold. The good old days when things made sense. :)
 
"A classic bearish day when just about everything is down but bonds and gold. The good old days when things made sense."

Now we have to wait and see when to BTD! It looks like some did today when we tagged the 100 dma....... A nice bounce after the tag. I'm going to wait and see how the next few days plays out first.
 

Attachments

  • a.png
    a.png
    31.5 KB · Views: 74
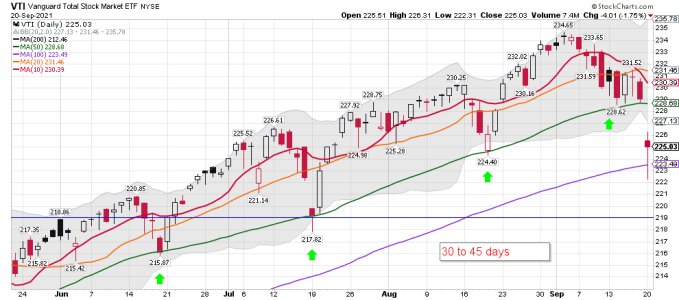
I will be buying VTI when I get my next buy signal. SSO in my trading accounts....
 

Attachments

  • a.png
    a.png
    29.1 KB · Views: 77
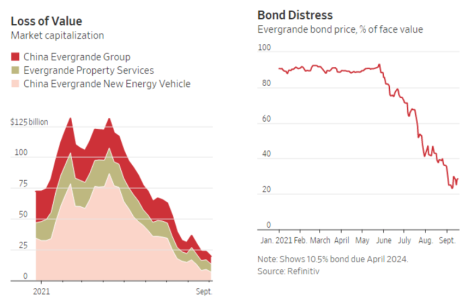
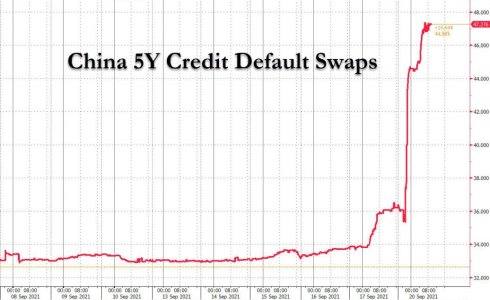
Fraud

I am shocked, shocked, that fraud took place in China.

evergrande.PNG

swaps.jpg

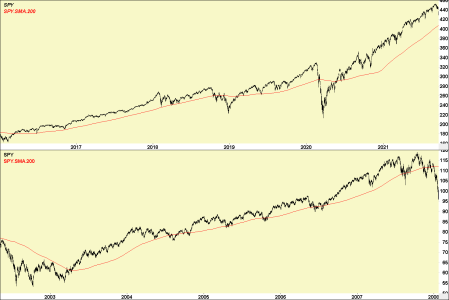
It looks like it would take six months to repeat 2008 (a couple large drops would be needed to turn the 200 DMA down).

spy.png

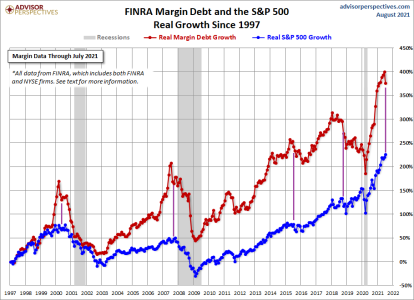
margin.png

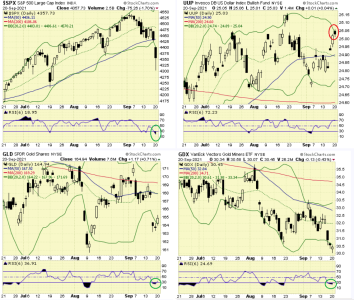
SPY, GLD and GDX are oversold. UUP is overbought.

charts.png

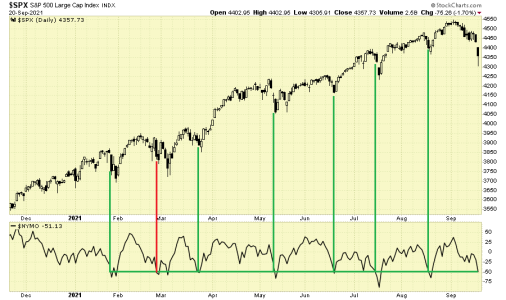
$NYMO reaching a good point for a turn. Now it's up to the Fed. Will they intervene after selling their personal stocks?

nymo.png

I added more GDX and SILJ today. Save me JPow, you're my only hope!

jpow.jpg
 
Last edited:
VTI weekly chart: So that's it? We shall see......

Intermediate Cycle Low

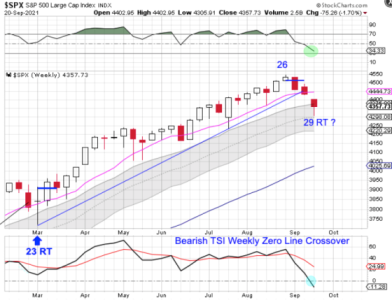
Stocks broke below the previous daily cycle low on Monday. Breaking below the previous daily cycle low forms a failed daily cycle and confirms the intermediate cycle decline.
Stocks are on week 29 for the intermediate cycle. This places them very deep in their timing band for an intermediate cycle low. The odds are very good that once a daily cycle low forms, that it will also mark the intermediate cycle low as well.

Stocks are currently in a weekly uptrend and are already in the process of forming a bullish weekly reversal. If stocks form a weekly swing low above the lower weekly cycle band then they will remain in their weekly uptrend and trigger a weekly cycle band buy signal.

https://likesmoneycycletrading.wordpress.com/2021/09/20/intermediate-cycle-low-3/
 

Attachments

  • a.png
    a.png
    119.4 KB · Views: 82
  • a.png
    a.png
    25 KB · Views: 82
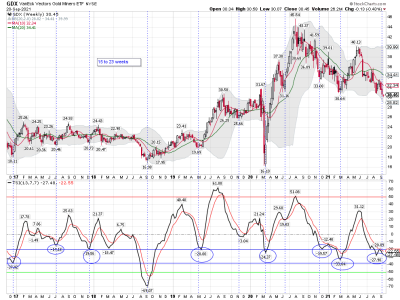
GDX weekly: Week 15 below the 10 wma. It be in the blue zone so it's possible we could bounce for a few weeks.
 

Attachments

  • a.png
    a.png
    54.7 KB · Views: 79
Last edited:
Re: Bubble

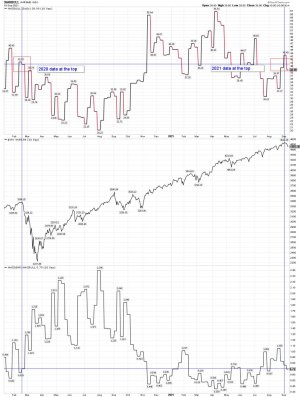
The Bullish/Bearish guessers chart: The current numbers are close to the March 2020 top. I'm not saying it will be a repeat, but those that reference this data should know the numbers are currently about the same as they were during the last 40% correction.

Bottom Line: These numbers can't be used alone to defend a Bullish position in my opinion. One must be using other tools along with these numbers. As you can see that in March of 2020 these numbers DID NOT turn out to be market positive. We had a 40% correction. However, the Fed did start its massive printing program and low rates. Are they about to reduce it some? We shall see how the cycle data, and a few other indicators plays out, and what the Fed has planned in the next few months.

For the record: I have posted this chart before and is one one my Sentiment tracking charts.

https://ycharts.com/indicators/us_investor_sentiment_bearish
 

Attachments

  • a.jpg
    a.jpg
    142.8 KB · Views: 76
Last edited:
Back
Top