Bear Cave 2 (Bull Allowed)

Re: GDX Breakdown

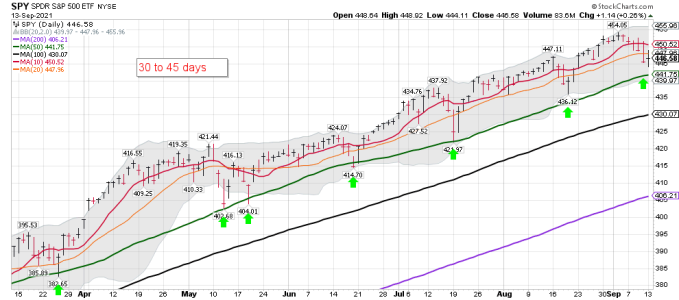
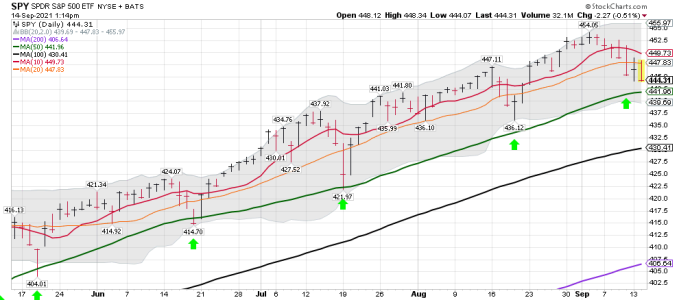
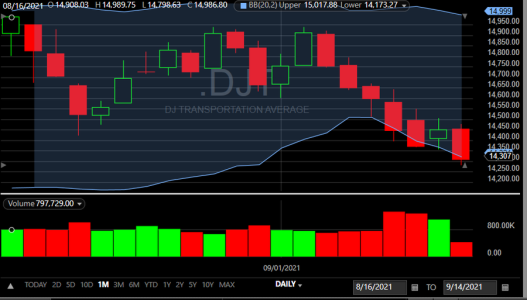
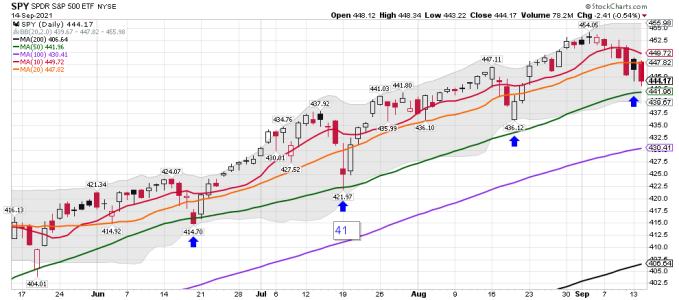
SPY daily after the close:( Chart 1) The Bulls did manage to close the SPY in the green, but far from my next buy signal. If you bought the low today it could turn out your going to be one happy camper in the days ahead.

Bottom Line: The SPY remains below its 10 and 20 dma's.....

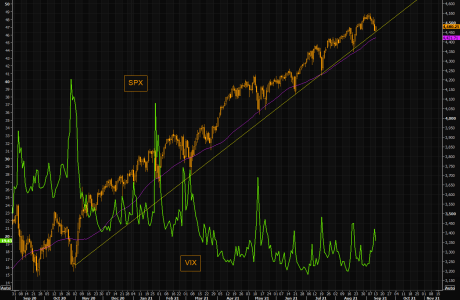
Chart 2
Who will not buy the next dip?
The way this is trading, it seems everybody will want to buy the next dip...

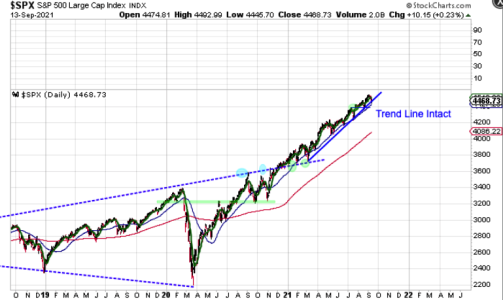
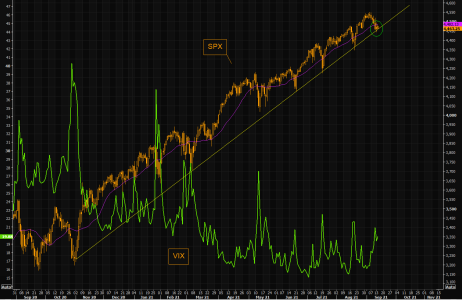
Spoos bouncing on the longer term trend line again, and the dips are becoming shorter and shorter.

Complex psychology becoming even more extreme.

Note the move in VIX, down 7.5% on a Monday just shows you how big the move was late last week. As we explained over the weekend; "...since SKEW remains steep even relatively small moves in Spoos will "translate" into spiky VIX moves".

Let's see how this plays out going forward, but the Pavlovian investor is getting increasingly confident...
https://themarketear.com/

(Chart 3)

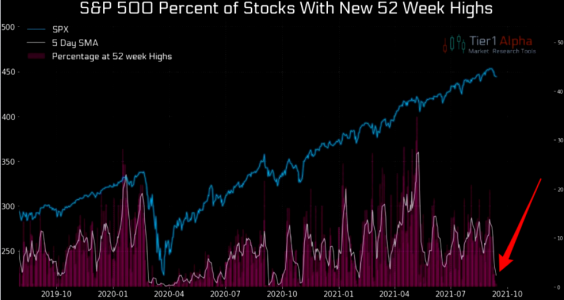
Shitty breadth (I)
Not many 52 week highs in this market. It is actually less than 1% of companies in the S&P 500 that trade at 52 week highs. The 5 day average is at lowest since Feb this year.


(Chart 4)

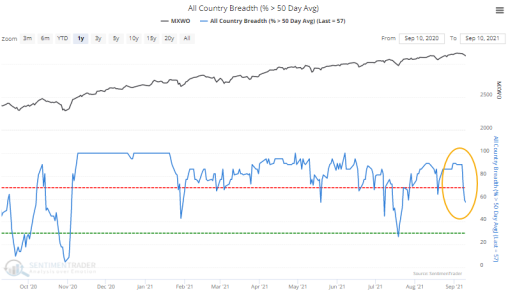
A Plunge in Global Stock Market Trends

Jason Goepfert
Published: 2021-09-13 at 07:35:00 CDT
Fewer countries are in medium-term uptrends, and that's a warning shot for stocks.

The percentage of country equity indexes trading above their 50-day moving average registered a sharp reversal lower over only a couple of sessions late last week. According to our calculations, positive trends plunged from 90% to below 60%.
Over the past 30+ years, there have been 17 other times when the percentage of countries trading above their 50-day average goes from >= 90% to <=60% in two days or less.

For the MSCI ACWI World Index ex USA index, future returns were weak on a short to intermediate-term basis, especially over the next 1-2 weeks.
https://www.sentimentrader.com/blog...l&utm_term=0_1c93760246-40961a97de-1271291994
 

Attachments

  • a.png
    a.png
    30.3 KB · Views: 70
  • a.png
    a.png
    57.8 KB · Views: 68
  • a.png
    a.png
    205.9 KB · Views: 70
  • a.png
    a.png
    53.2 KB · Views: 70
Last edited:
Re: GDX Breakdown

It sure looks like a half cycle low, but needs to get back above the 10 dma....

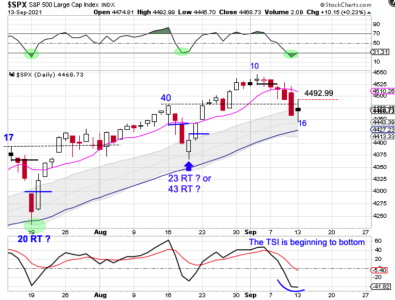
Half Cycle Low
Stocks rallied on Monday. If stocks form a swing low above the lower daily cycle band then stocks will remain in their daily uptrend and trigger a cycle band buy signal. And we would label day 16 as a half cycle low.

https://likesmoneycycletrading.wordpress.com/2021/09/13/half-cycle-low-2/
 

Attachments

  • a.png
    a.png
    117.8 KB · Views: 70
  • a.png
    a.png
    90.1 KB · Views: 69
SPY daily: Day 7 since the move down started. Getting closer the the 50 dma, and I agree we "SHOULD BOUNCE" very soon. Selling all my SDS today and waiting to see how this plays out. Will it be a DCL and then a (LT) failed daily cycle or are we headed to a weekly cycle low.


(Second Chart)
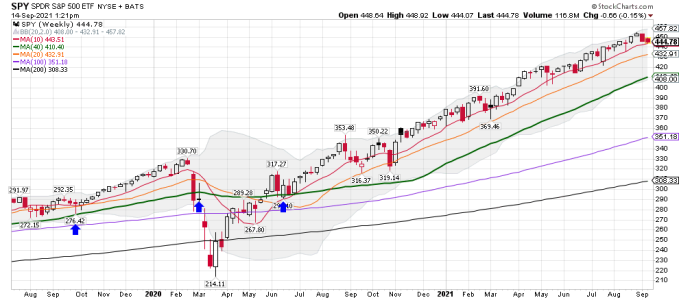
SPY weekly: You have to admit it sure has been a nice run!
Bottom Line: Still NO SELL signal on the weekly chart based on the system I use. However, this late in the cycle "IF" you are still long it should be a much smaller position in my opinion. Of course at almost 70 years old, my Risk Management rules are probably much different then younger folks.


Robert Burgess
@BobOnMarkets
1h
BREAKING: The Institute of International Finance says $4.8 TRILLION was added to the global mountain of debt in the second quarter, bringing the total to a record high $296 TRILLION

(3rd chart)
thomas
@VolumeDynamics
This is all fundamentals ...
What I do is technicals....

This Chart tells a story... a bearish story.
 

Attachments

  • a.png
    a.png
    26.8 KB · Views: 67
  • a.png
    a.png
    27 KB · Views: 68
  • a.png
    a.png
    148.5 KB · Views: 66
Last edited:
LOL......

I remember it well!

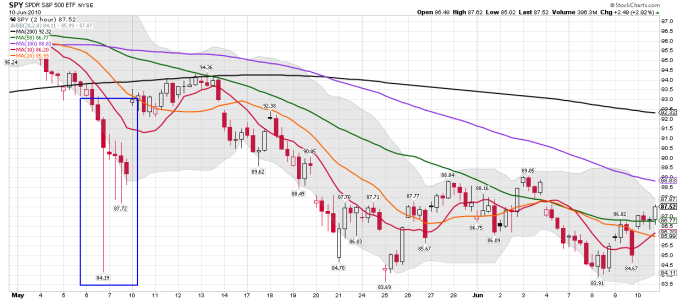
SPY 2 hour flash crash chart: Amazing.....

Daily flash crash: Closed well off the lows.... In the next 2 months it retested the lows twice.....

thomas
@VolumeDynamics

20m
you know what time of day it is?

it's the time of day of the flash crash 5/6/2010
https://www.youtube.com/watch?v=E1xqSZy9_4I
 

Attachments

  • a.png
    a.png
    40.2 KB · Views: 69
Last edited:
LOL..... We shall see! The 50 dma is up next "IF" we get there...... As usual the SPX futures are up.....

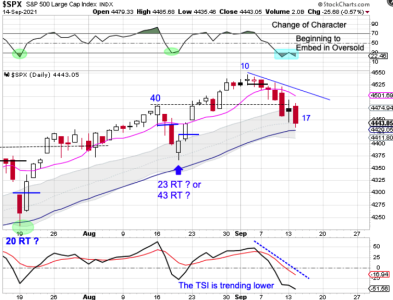
(Chart 1) SPX daily cycle data:

Change Of Character

The advancing phase of the intermediate cycle is characterized by RSI 05 embedding in overbought and delivering quick bullish reversals once oversold. Stocks on Tuesday are beginning to show a change of character.

Instead of a quick bullish reversal, RSI 05 once again became oversold and is beginning to embed there. The previous 2 times that stocks tested the 50 day MA, dip buyers were rewarded with a continued rally. Stocks are still in a daily uptrend. If stocks form a swing low above the lower daily cycle band then they will remain in their daily uptrend and trigger a cycle band buy signal. However, a close below the 50 day MA would be another change in character that would signal the daily and intermediate cycle decline.
https://likesmoneycycletrading.wordpress.com/2021/09/14/change-of-character-2/

(Chart 2)

SPX - what if this dip is not bouncing?

Spoos is still down less than 2% from the ATH close, but VIX refuses easing, trading just shy of 20 as of writing.


Looking at the micro picture, Spoos hasn't closed below the 21 day moving three days in a row since the mid May correction.

4450 is a huge level to watch. A close below and things could become "fluid" to the downside.

In case you missed it, we believe the Pavlovian BTD mentality is one of the bigger market risks going (here).
https://themarketear.com/
 

Attachments

  • a.png
    a.png
    122.9 KB · Views: 65
  • a.png
    a.png
    57.9 KB · Views: 62
Last edited:
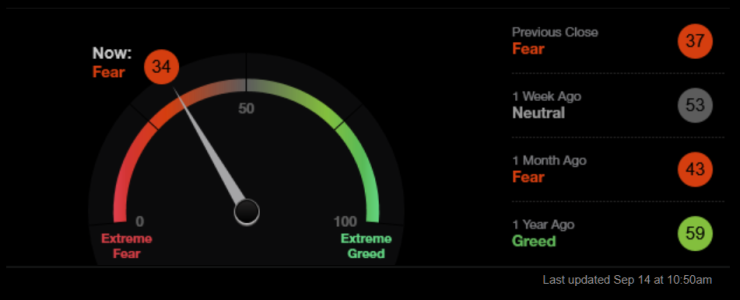
Fear Meter: It only took 7 down days to generate this much fear... The next ICL we will probably hit the teens and that will cause extra selling. These new traders using APP's on their phone have never seen a Bear Market and like to use leverage. Oh Boy!

SPY daily: Remains in a daily downtrend.

(Chart 2)

It's all about fear
Forget greed. After all we are just 2% below all time high.

This has to be the most fearful bull...
https://themarketear.com/
 

Attachments

  • a.png
    a.png
    63.2 KB · Views: 67
  • a.png
    a.png
    27.4 KB · Views: 64
Last edited:
LOL.... The Fed needs to do something about this!

The 4th Longest Momentum Streak Since 1928 Just Ended
It was quite a run, but the dip in stocks last week did a bit of damage.

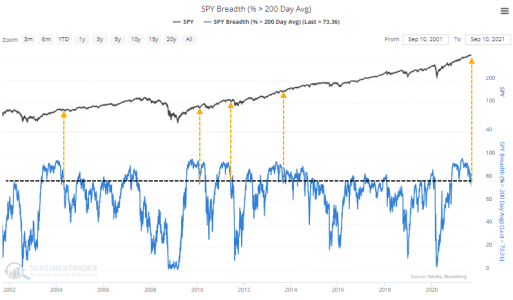
We've seen from multiple perspectives just how much of an outlier 2021 has been in terms of sentiment, breadth, and momentum. At various points since January, momentum ebbed, or negative breadth divergences triggered, then buyers came in immediately.

Yet, at no time did fewer than 75% of S&P stocks close below their long-term averages until the end of last week. For the first time in 10 months, fewer than 3 out of every 4 stocks in the S&P 500 closed above their 200-day moving averages.

That ends the 4th-longest streak since at least 1928.

In over 90 years of history, there have only been 5 other streaks of at least 200 consecutive days. Like we see with many momentum types of data, forward returns were good, even after the streaks ended. While it did precede a big dip in 1950, the others saw minimal losses or gains over the following months.
https://www.sentimentrader.com/blog...l&utm_term=0_1c93760246-205f8e84e4-1271291994
 

Attachments

  • a.png
    a.png
    64.1 KB · Views: 64
Evergrande: Should we be watching this?


EVERGRANDE - there I said it, nobody is talking about it... Bigger than Lehman Bros.

And it ain't going away.


thomas
@VolumeDynamics
·
40m
https://gnews.org/1531121/
Quote Tweet
thomas
@VolumeDynamics
· 41m
@Jkylebass, @RaoulGMI, @chigrl You may not have read these predictions from Miles Guo, shocking. Maybe you already know...

"With millions of people implicated in Evergrande and millions of families behind it, Evergrande will be the biggest economic collapse in history."

https://twitter.com/VolumeDynamics
Macro Matters
Goldman Sachs, JPMorgan warn of Evergrande's debt woes spillover risks
LONDON, Sept 15 (Reuters) - Evergrande Group's (3333.HK) debt crisis could pose spillover risks to the broader Chinese property sector, Goldman Sachs said in a note on Wednesday.

The developer, which has liabilities of nearly two trillion yuan ($305 billion), is trying to raise funds to pay lenders and suppliers as it teeters between a managed collapse and the more distant prospect of a bailout by Beijing. read more

"We believe that further disruptions to the company's property development operations can be very negative for sentiment amongst domestic property buyers and investors, and potentially spill over to the broader property sector," Goldman Sachs' Kenneth Ho and Chakki Ting wrote in the note.


https://www.reuters.com/business/ev...ks-chinas-property-sector-goldman-2021-09-15/
 
Last edited:
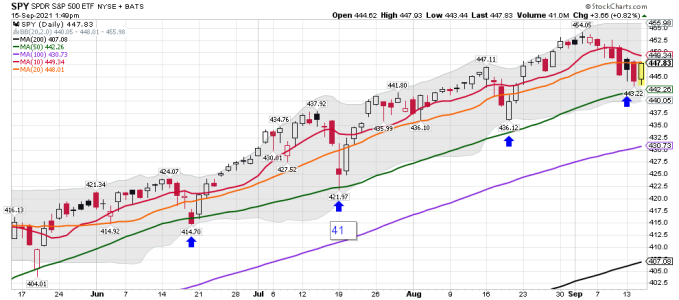
SPY daily: Trying to get back above the 20 dma..... We shall if the Bulls got this.... Day 6 below the 10 dma and a "POSSIBLE" DCL be very close.... Unless we are headed to a weekly cycle low/ICL! Flat while this plays out. ST trading a few positions....

thomas
@VolumeDynamics
·
32m
We are closer than ever

to one of these day trade shorts rolling into the next BEAR market
 

Attachments

  • a.png
    a.png
    27.5 KB · Views: 54
  • s.png
    s.png
    26.9 KB · Views: 54
Last edited:
Evergrande: Should we be watching this?

EVERGRANDE - there I said it, nobody is talking about it... Bigger than Lehman Bros.

And it ain't going away.

I wonder how many ghost cities they hold on their books? Remember these stories from 2008? They never stopped building. (FF to 4:20 in video)

 
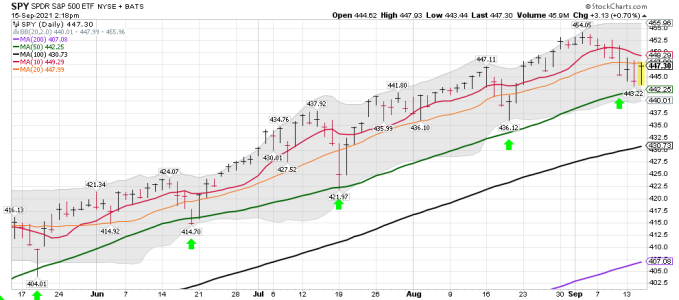
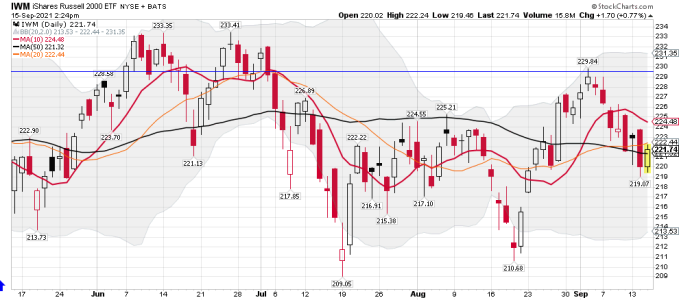
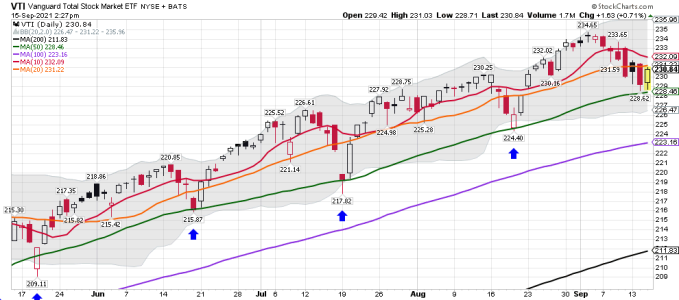
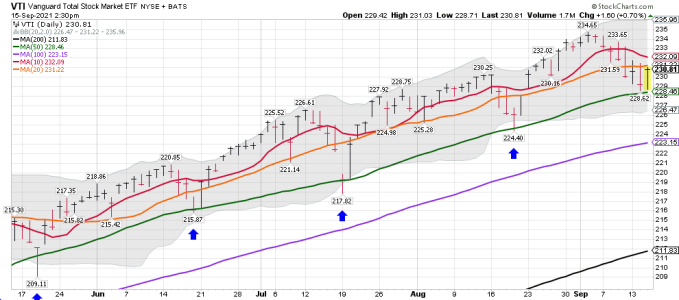
IWM and VTI daily charts: IWM back above the 50 dma, but still not enough buyers to get it back above the 20 and 10 dma. We shall see how it closes. Most are expecting a DCL here and then a move back to (ATH) new highs. We shall see..... Possible for VTI and SPY, but IWM remains weak. VTI still creeping higher..... A move above the 20 dma would be a win for the bulls today. VTI did come very close to the 50 dma and BT it today.... ( So Far Bullish this late in the daily cycle)

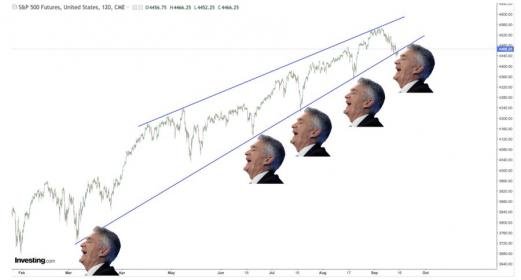
The FED chart: Time to buy stocks?

Sven Henrich
@NorthmanTrader

1h
One day he'll stop laughing.
 

Attachments

  • a.png
    a.png
    29.4 KB · Views: 53
  • a.png
    a.png
    28.1 KB · Views: 57
  • a.png
    a.png
    27.9 KB · Views: 53
  • E_VzwjDXIAEJkUK.jpg
    E_VzwjDXIAEJkUK.jpg
    14.3 KB · Views: 53
Last edited:
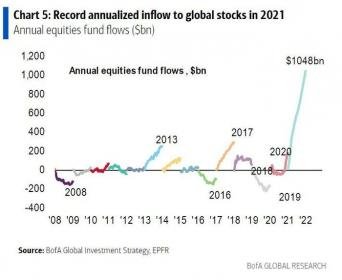
LOL.... Just BTD! Investors have piled more money into the stock market during the past 8-1/2 months than during the previous 20 years added together:

The total net inflow into equity funds in 2021, with the year less than 3/4 complete, has exceeded the entire previous twenty years combined and reached its most intense pace in seven months.


People have attributed the past year's historic surge for U.S. large-cap indices to the Fed, record-low commissions, a huge media blitz, Joe Biden, and just about any other reason you can invent. While those were contributing inducements, there is only one reason for U.S. stocks reaching by far their highest-ever overall levels relative to fair value, and it's investors piling more into the market during the past 8-1/2 months than during the previous 20 years added together:

Kaplan

https://www.marketwatch.com/story/t...r-than-the-last-20-years-combined-11631273525

(Chart 2)

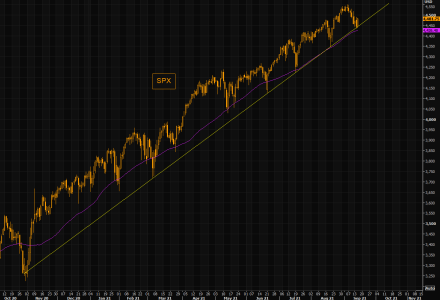
The one chart to rule them all
The great SPX buy the dip chart continues delivering the easiest trading set up.

Bullish trend perfection as the cork in water market can't get enough of upside.

It works until it doesn't...
https://themarketear.com/
 

Attachments

  • a.jpg
    a.jpg
    12.9 KB · Views: 52
  • a.png
    a.png
    40.7 KB · Views: 54
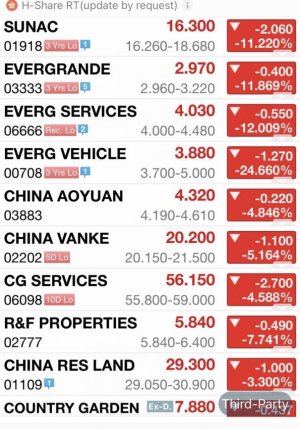
Evergrande

Chinese REIT's are plunging.

china reit.jpg

Evergrande fear porn from Stephen Van Metre (he might be right someday).


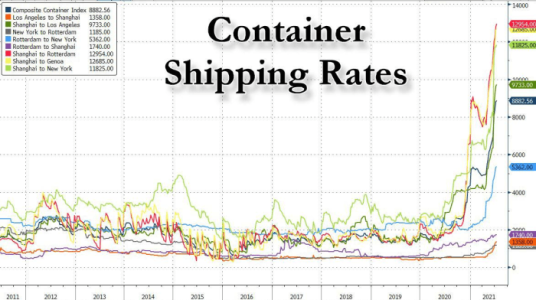
P.S. Shipping container rates are rising (esp. from Asia).

containers.png
 
Last edited:
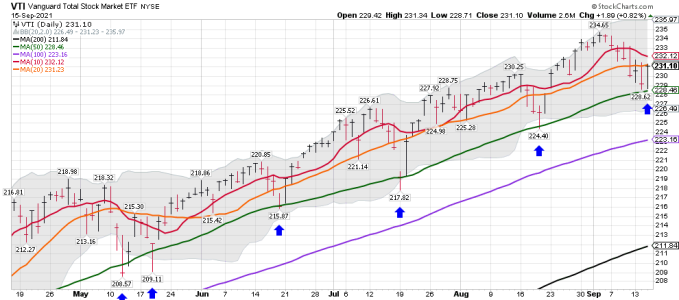
VTI daily: The pattern looks to repeat...... AGAIN! We shall see how it plays out.....

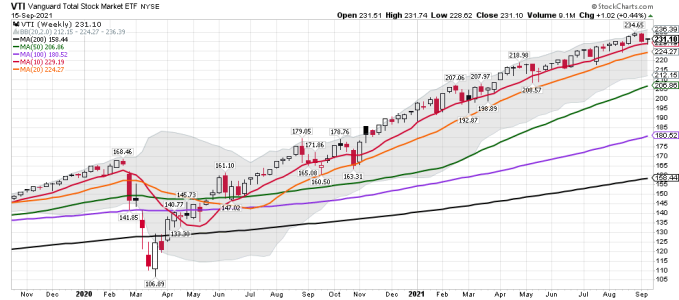
VTI weekly: The weekly trend remains up until it's NOT! Still trending above the 10 wma......
 

Attachments

  • a.png
    a.png
    29.1 KB · Views: 49
  • a.png
    a.png
    28.8 KB · Views: 48
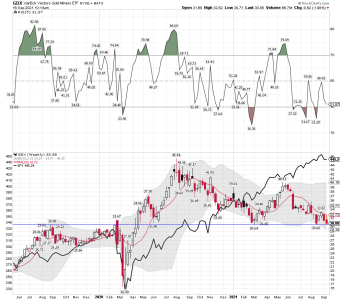
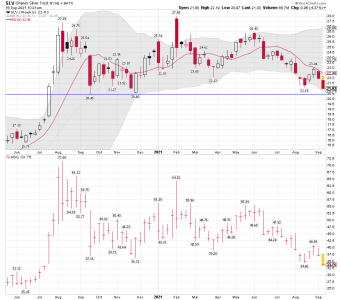
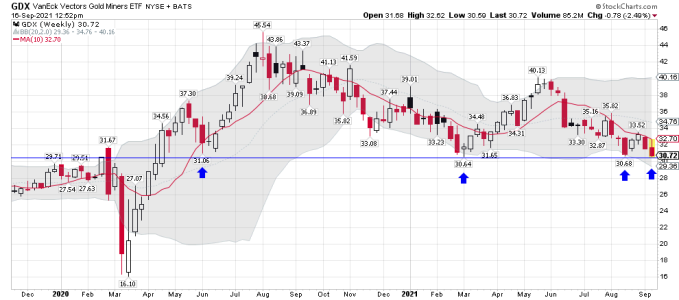
GDX weekly: Testing the $30.60ish support level. Will it hold? Some buyers did come in so we shall see how we close... The dollar be on the move! Flight to SAFETY? Maybe.....
SLV weekly:

Bottom Line: SLV and GDX remain under their 10wma and in a downtrend. These two are on my buy list... LOL.... Timing is everything in this sector.
 

Attachments

  • a.png
    a.png
    59.9 KB · Views: 49
  • a.png
    a.png
    34 KB · Views: 47
Last edited:
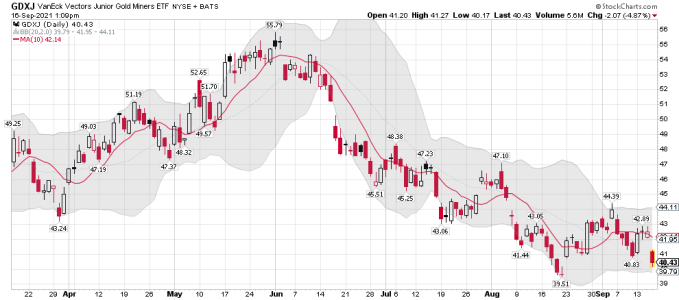
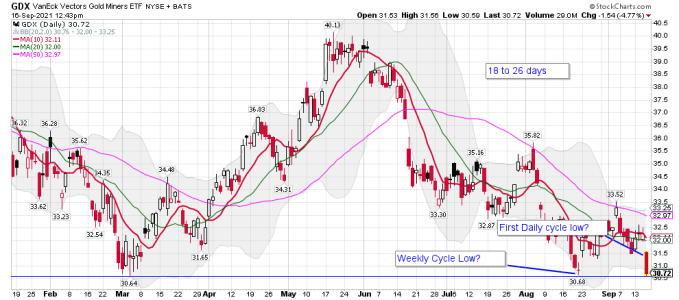
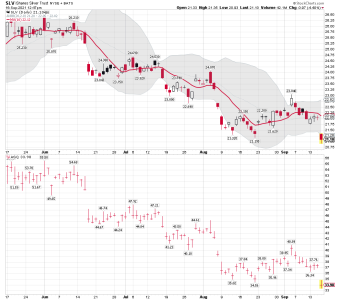
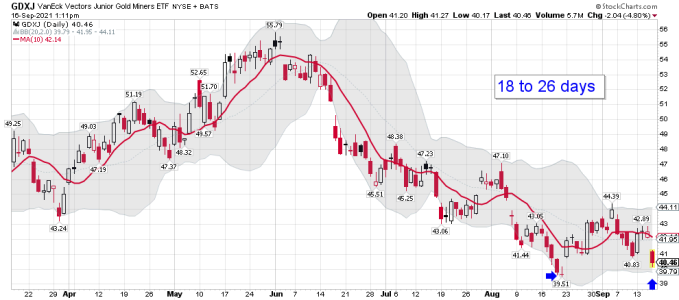
GDX and SLV daily charts: I bought some of both very close to the lows today. Comments on the GDX chart.....

DCL: Only possible for now, and I'm waiting on a weekly buy signal before putting my entire 10% position to work.

GDX stopped from moving above the 10 wma again..... Sorry, but my magic 8 ball is broke, so I will have to wait for a confirmed weekly buy signal.

Good trading if you are trading the metals/miners.....

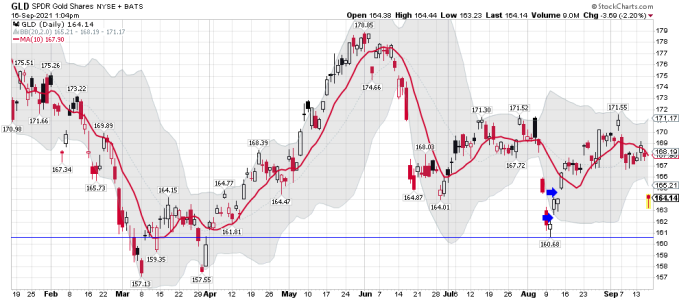
GLD daily: We shall see how it plays out..... No help from the 8 ball and the dollar be on the move!
 

Attachments

  • a.png
    a.png
    38.1 KB · Views: 45
  • a.png
    a.png
    35.1 KB · Views: 46
  • a.png
    a.png
    24.9 KB · Views: 47
  • magic8ball.jpg
    magic8ball.jpg
    82.7 KB · Views: 46
  • a.png
    a.png
    35.8 KB · Views: 45
  • a.png
    a.png
    28 KB · Views: 45
  • a.png
    a.png
    30.8 KB · Views: 45
Last edited:
Back
Top