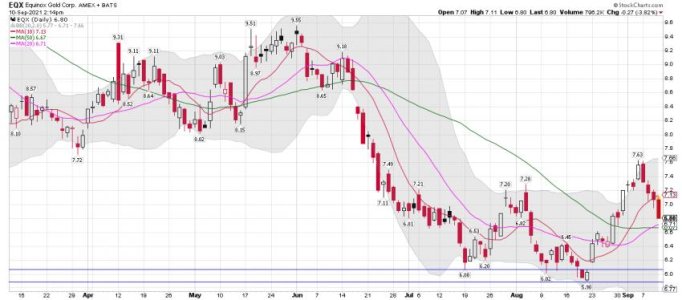
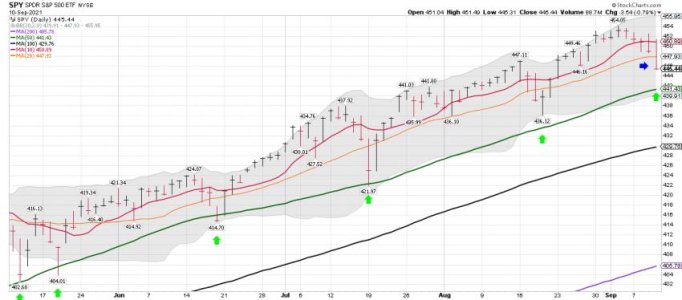
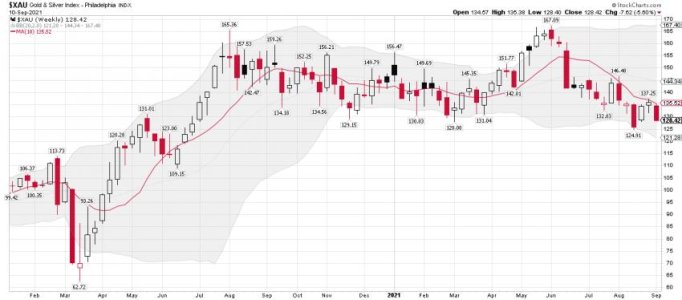
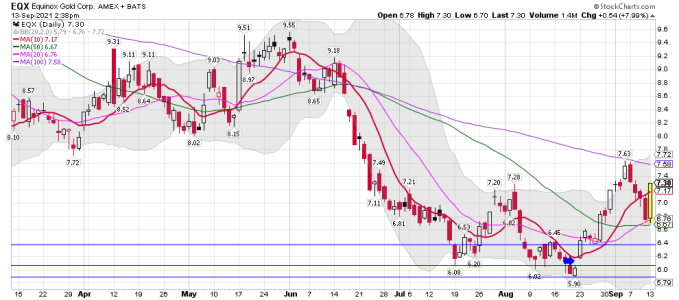
Maybe it's looking bullish on the daily chart to Morris, but I'm only trading the weekly data right now. Show me a confirmed weekly buy signal before I get to excited. I'm still ST trading the daily chart too, and bought some shares Friday for a trade only. I'm staying away from posting my daily trades here because I make so many. I will be keeping with the MT positions in this sector (metals/miners) when I post here at TSPTalk.
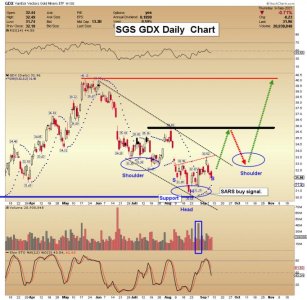
For the record: I take advice from "NONE" of these gold/miner guessers..... If the miners are below the 10 wma I'm normally flat. I have "NO FOR SURE" data that tells me what the miners will do next. I too can make a guess based on the chart and cycle data, but it would still be a guess. Charts to me are only for tracking the current trend and price action. That is why I just wait for confirmed signals and don't care about trying to pick bottoms in this sector based on a chart. Been there and done that. However, there are chart patterns I do ST trade, and some have a very high win rate. So those are high odd ST trades based on the patterns. Red points out some of these patterns above. I like this site because I don't have to put up with the gap guy and a few other folks from other sites talking about COVID shots, Masking etc.... Tom also has some very useful data here for the average trader/investor. So make your best guess on what the miners will do next, but I will be trading what I see happening in real-time and not what I think will happen. The trend is based on the price of buyers moving the sector higher. The reasons they are buying don't matter to me, and everything else is just noise.
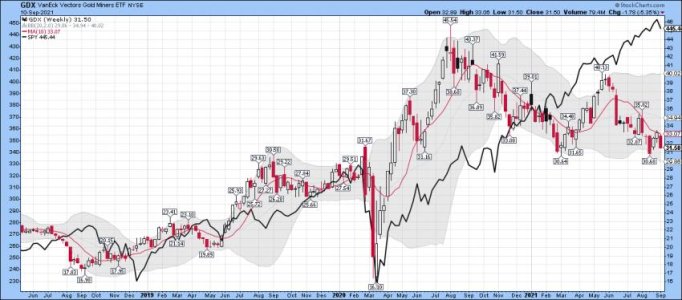
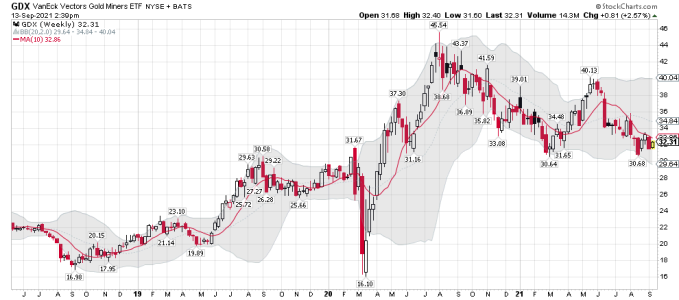
Bottom Line: The fact is, the miners remain in a weekly downtrend until they are not.
Lots of opinions at the link below if you care to read them over.
https://www.gold-eagle.com/article/gold-forecast-downward-implications-us-labor-day
Way to many political posts at 321 gold for me to read to much stuff on that site. I still follow a few folks that keep the post to the point. If I want to read political bullshit I can go to FOX or CNN and get lots of it. I will pass!
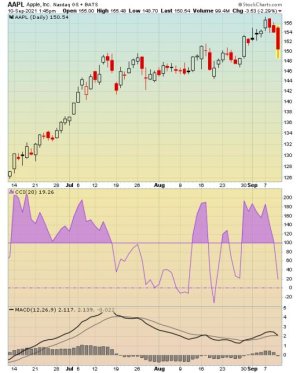
Morris: Gold Stocks: Bullish But No Breakouts Yet
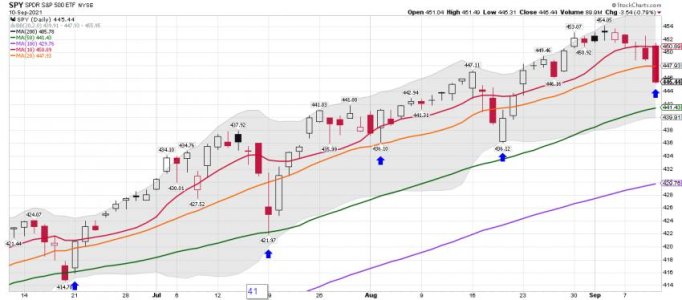
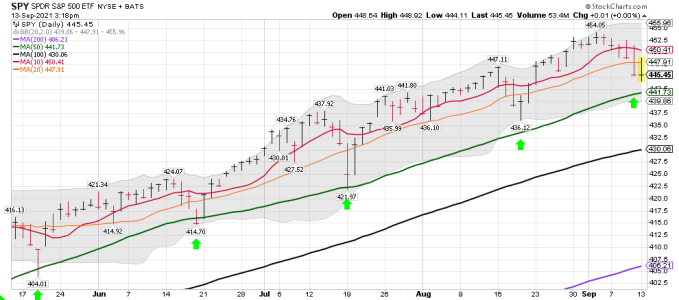
I agree with Bob that this is NOT a time to be 100% long..... I don't know or care when this move up will stop since I'm trading both ways all the time as I wait for the next confirmed ICL for stocks.
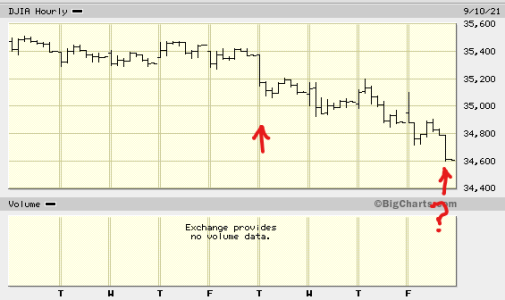
Dow 1929 Vs. Dow 2021?
Bob Moriarty
Archives
Sep 11, 2021
he DOW JONES Index peaked on September 3, 1929 at 381.17. It ran lower into October 24th, 1929 when the market plunged 11% on the open from the preceding day. We call that Black Thursday even though the market closed only slightly lower.
The crash continued Monday October 26th when the Dow tumbled 13% and another 12% on Black Tuesday October 27th. The Great Depression had begun. The crash didn’t stop until July 8th, 1932 with the Dow down to 41.22, an incredible 89.2% drop.
I think it is going to happen again.
Soon.
Very, very soon.
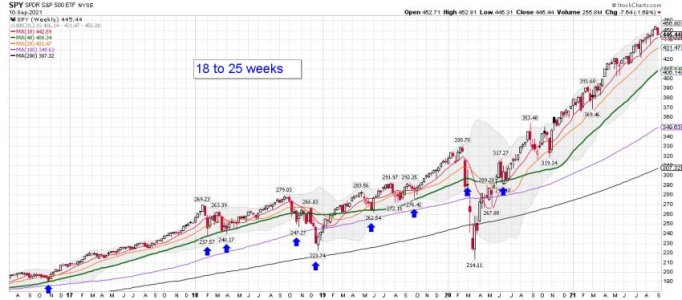
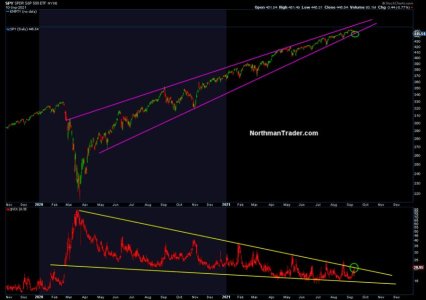
For months I have been suggesting that I believe the bubble is going to burst and we would have tops in the Indexes from mid-August into September before declining into a crash in late October.
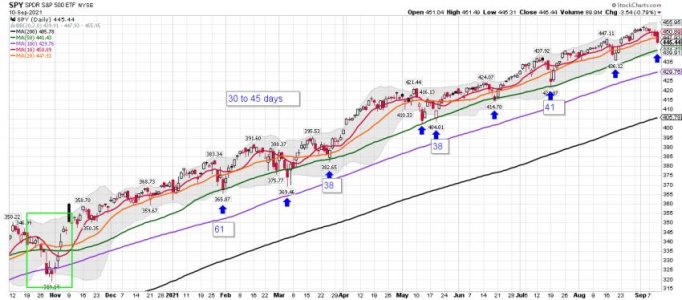
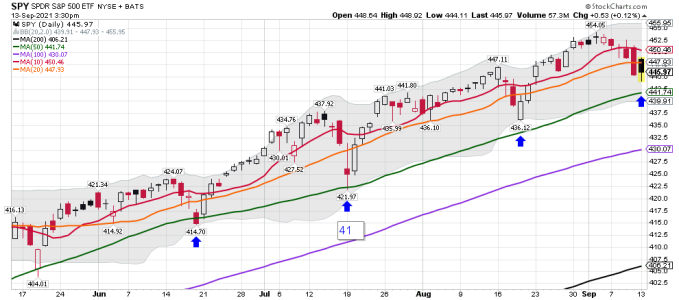
So far, so good. The S&P peaked at 4545.85 on September 2nd. The DJI topped on August 16th at 35631.19. The Nasdaq high point was on September 7th at 15,403.44.
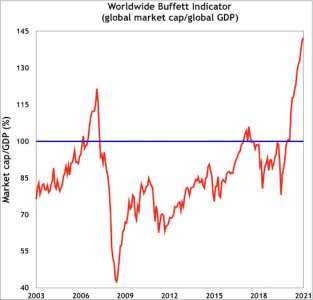
Most investors today have never been through a real market crash and have no idea of what is coming. You cannot have the extremes that we have today without a full reset back to the norm. Since the market is more out of balance than it was in 1929 and 2000 I would not be surprised to see a market crash of similar dimensions, that is to say a 89-92% decline.
Sep 11, 2021 Dow 1929 Vs. Dow 2021? Bob Moriarty 321gold
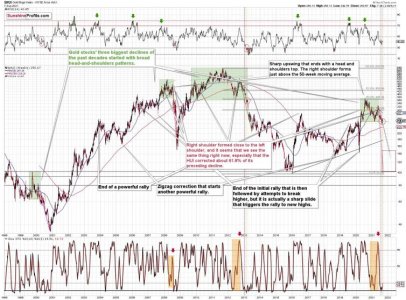
Second Chart:
https://www.gold-eagle.com/sites/default/files/images2020/rad090721-3_0.jpg
https://www.gold-eagle.com/article/gold-forecast-downward-implications-us-labor-day
Summary
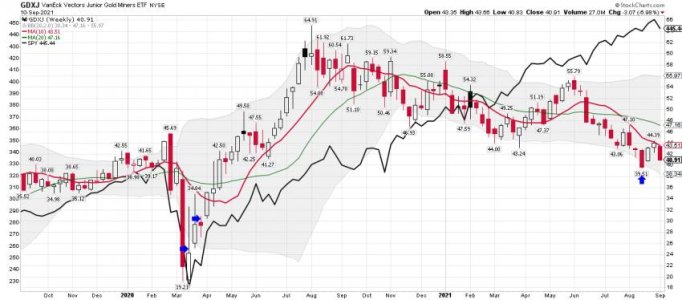
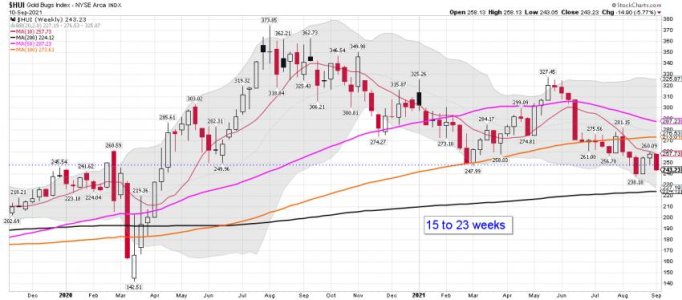
To summarize, even though we saw a sizable upswing on Friday, it doesn’t seem that it changes anything with regard to the bearish medium-term trend on the precious metals market. The key breakdowns / breakdowns were either not invalidated (euro, USD Index, silver, GDXJ) or were invalidated in a way that’s suspicious / in tune with what happened during the powerful 2013 slide (GDX, HUI Index).
And as silver often moves in close relation to the yellow metal, when gold falls, Silver is likely to decline as well – it has probably already started its slide. The times when gold is continuously trading well above the 2011 highs will come, but they are unlikely to be seen without being preceded by a sharp drop first.
Thank you for reading our free analysis today. Please note that it is just a small fraction of today’s all-encompassing Gold & Silver Trading Alert. The latter includes multiple premium details such as the outline of our trading strategy as gold moves lower.
Thank you.
Przemyslaw Radomski, CFA
Founder, Editor-in-chief