-
The Forum works well on MOBILE devices without an app: Just go to: https://forum.tsptalk.com
-
Please read our AutoTracker policy on the IFT deadline and remaining active. Thanks!
-
$ - Premium Service Content (Info) | AutoTracker Monthly Winners | Is Gmail et al, Blocking Our emails?
Find us on: Facebook & X | Posting Copyrighted Material
-
Join the TSP Talk AutoTracker: How to Get Started | Login | Main AutoTracker Page
You are using an out of date browser. It may not display this or other websites correctly.
You should upgrade or use an alternative browser.
You should upgrade or use an alternative browser.
Bear Cave 2 (Bull Allowed)
- Thread starter robo
- Start date
robo
TSP Legend
- Reaction score
- 471
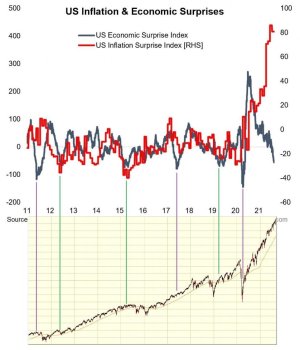
Hmmmm......
https://themarketear.com/
https://themarketear.com/
Attachments
robo
TSP Legend
- Reaction score
- 471
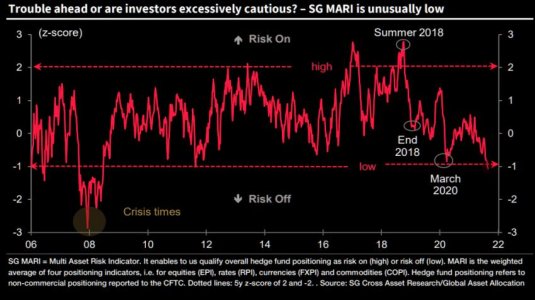
The market just doesn't care..... Well, for now that is!
4th Booster. New mutants...
Some recent relevant COVID headlines:
1. Virus czar calls to begin readying for eventual 4th vaccine dose (The Times of Israel)
2. New COVID variant detected in South Africa, most mutated variant so far (J-Post)
3. A number of mutations suggest that the Mu variant could resist immune defenses and possibly even have a faster transmission than other variants (WHO)
https://themarketear.com/
robo
TSP Legend
- Reaction score
- 471
LOL..... Trade with the money flow..... We want more JUICE!
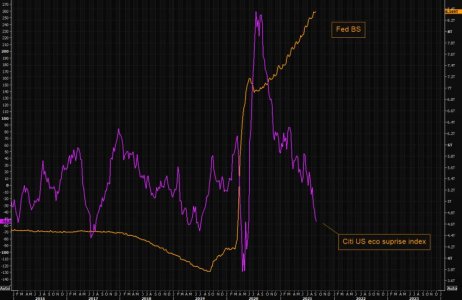
Depressed economic surprises need more "juice"?
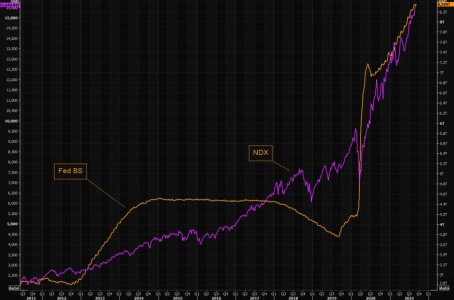
Citi's US economic surprise index "can't catch a bid", despite Fed's continued printing.
Will this gap ever shrink?
https://themarketear.com/
Depressed economic surprises need more "juice"?
Citi's US economic surprise index "can't catch a bid", despite Fed's continued printing.
Will this gap ever shrink?
https://themarketear.com/
Attachments
robo
TSP Legend
- Reaction score
- 471
Hmmmmm....
Risk Windows for the Labor Day Week
Started by Douglas , Yesterday, 04:48 AM
https://www.traders-talk.com/mb2/index.php?/topic/175750-risk-windows-for-the-labor-day-week/
Risk Windows for the Labor Day Week
Started by Douglas , Yesterday, 04:48 AM
https://www.traders-talk.com/mb2/index.php?/topic/175750-risk-windows-for-the-labor-day-week/
robo
TSP Legend
- Reaction score
- 471
STBD if this even matters.
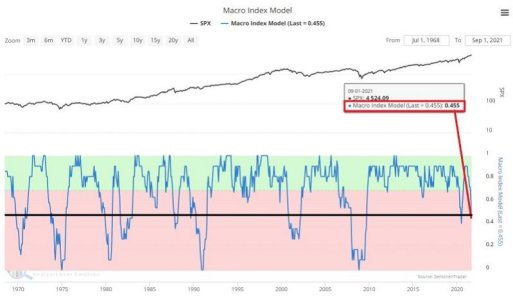
Macro Conditions Are Plunging
Jason Goepfert
Published: 2021-09-07 at 07:35:00 CDT
The fundamental outlook is deteriorating. We've seen that in a drumbeat of reports that have disappointed economists in recent weeks.
The SentimenTrader Macro Index Model is designed to track the ebb and flow of an economic expansion. To differentiate "temporary slowdowns" from real problems, we look for SIGNIFICANT macro deterioration. Our Macro Index combines 11 diverse economic indicators to determine the state of the U.S. economy right now.
New Home Sales
Housing Starts
Building Permits
Initial Claims
Continued Claims
Heavy Truck Sales
10 year - 3-month Treasury yield curve
S&P 500 vs. its 10-month moving average
ISM manufacturing PMI
Margin debt
Year-over-year headline inflation
At the end of August, Jay notes that the Macro Index Model dropped from .64 to 0.46.
https://www.sentimentrader.com/blog...l&utm_term=0_1c93760246-0ed6b1724b-1271291994
Attachments
robo
TSP Legend
- Reaction score
- 471
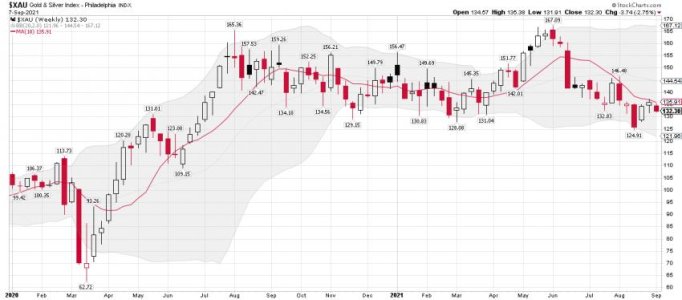
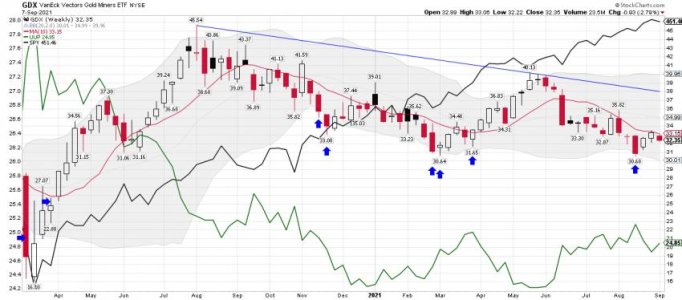
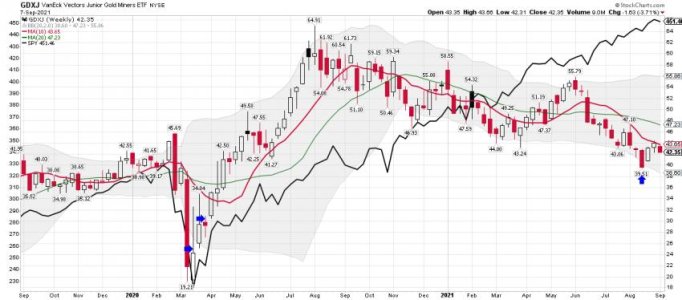
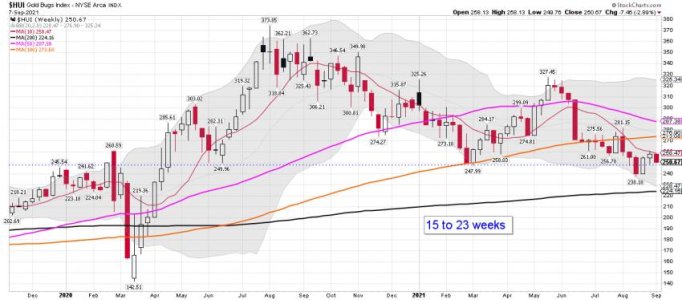
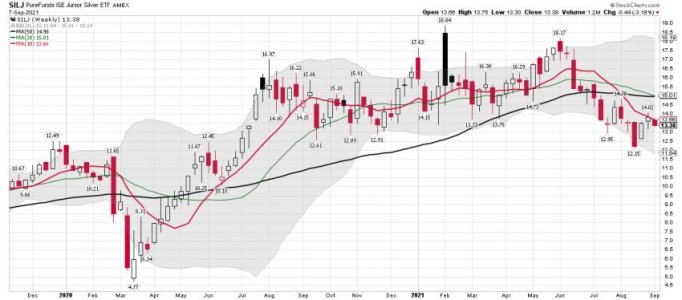
$XAU weekly: It has remained under the 10 wma for 12 weeks. Waiting on "MY" next weekly buy signal..... Others have already bought. I'm still ST trading the miners using the daily signals. The weekly signals are for MT trades and can last for months..... I be like a grasshopper in this sector. I have lost plenty buying to much, to early, and using leverage.
GDX: Trending down and under the 10 wma
GDXJ: "" "" ""
$HUI:
SILJ:
Bottom Line: I be waiting for "MY" next weekly buy signal and it does look like the weekly cycle low is in. However, I like to wait as see a confirmed trend happening above the 10 wma.
Risk Management!
GDX: Trending down and under the 10 wma
GDXJ: "" "" ""
$HUI:
SILJ:
Bottom Line: I be waiting for "MY" next weekly buy signal and it does look like the weekly cycle low is in. However, I like to wait as see a confirmed trend happening above the 10 wma.
Risk Management!
Attachments
robo
TSP Legend
- Reaction score
- 471
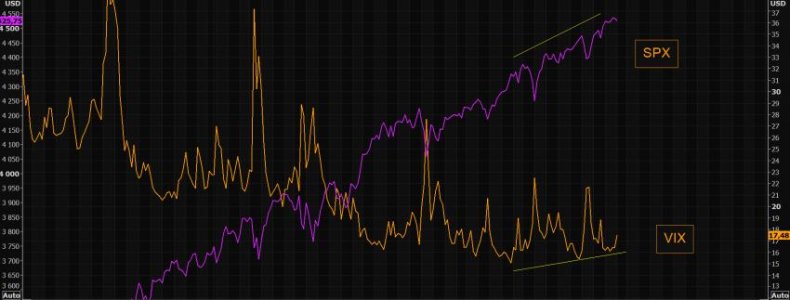
The constant bid in "fear"
Remember rising SPX and rising VIX?
Nothing huge (yet), but pay attention to when both are rising. Since the July "hiccup" both the SPX and the VIX have trended hither.
One "indicator" isn't enough to go bearish the market, but the constant bid in VIX continues to be very much alive.
https://themarketear.com/
Attachments
robo
TSP Legend
- Reaction score
- 471
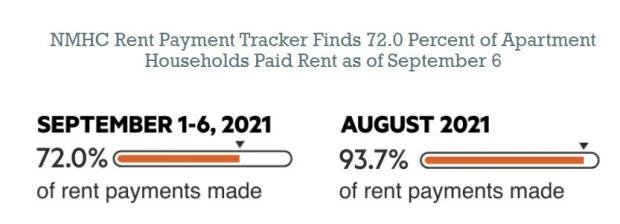
Jobs: Does anyone even track this stuff anymore? And if they do, it doesn't seem to matter. It looks like all they track is the SPY. Which many like to call the Stock Market.
What about the rent data?
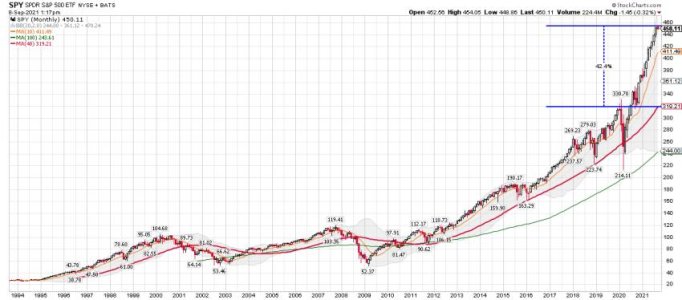
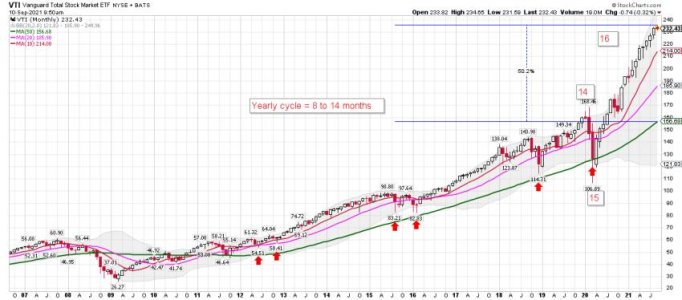
SPY monthly: Remains extremely stretched above the 40 month moving average.... LOL... who cares?
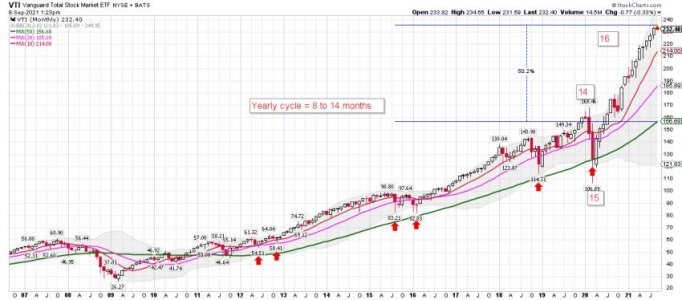
VTI monthly:
David Rosenberg
@EconguyRosie
41m
So if the job openings data from the JOLTS survey is so reliable (massive duplication) in depicting acute labor demand, why did it show a 105k surge in layoffs in July?
https://twitter.com/EconguyRosie?lang=en
thomas
@VolumeDynamics
2h
Unemployment benefits ran out...
Quote Tweet
https://twitter.com/spomboy/status/1435618197265211394/photo/1
Attachments
Last edited:
robo
TSP Legend
- Reaction score
- 471
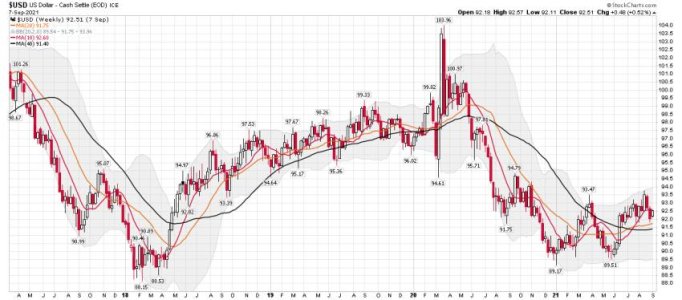
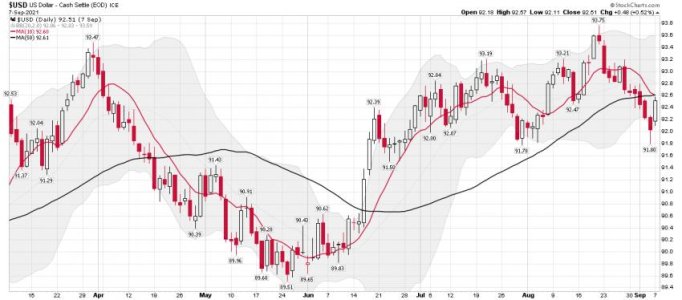
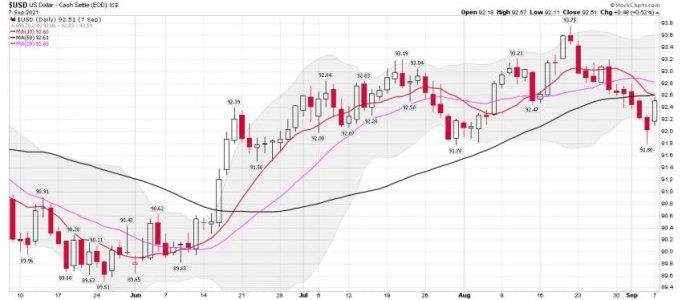
$USD weekly: It is below the 10 wma, but has held above the 20 and 40 wma. Still making higher lows from the $89.17 marker..... We shall see! As for the dollar rising..... Let us not forget a fight to safety trade is also possible this month "IF" stocks pullback some.
$US dollar daily: For those trading the daily cycles: Day 11 since the sell signal, and it has been giving the miners a bid..... The move remains below the 10, 20 and 50 dma.... Cycle low soon or something bigger going on!
A Dollar Trend to Watch
Jason Goepfert
Published: 2021-09-08 at 07:35:00 CDT
When it comes to the U.S. dollar, too often, the "cycle" goes something like this:
Step #1. In the financial news, the conflicting stories typically fall into one of two categories:
Those that argue that inflation and debt mean the dollar is doomed to decline
Those that argue that the Fed will ultimately have to raise interest rates and that higher rates will make the U.S. dollar more attractive relative to other currencies, thus the dollar is destined to rise
Step #2. The average investor weighs these two conflicting theories and decides which they feel is the better argument.
For better or worse, I prefer to look at things I can quantify.
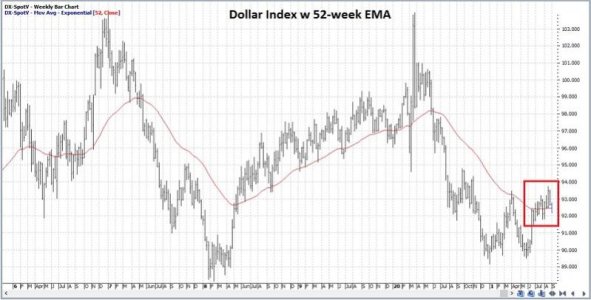
The chart below (courtesy of ProfitSource) displays the U.S. Dollar Index along with its 52-week exponential moving average.
(Click on the link below to read the rest of the report) Is the dollar's next big move down? Based on the cycle data, some think so.... You can see my weekly chart below.
https://www.sentimentrader.com/blog...l&utm_term=0_1c93760246-9471cd2f2e-1271291994
Attachments
Last edited:
redbrian
Investor
- Reaction score
- 3
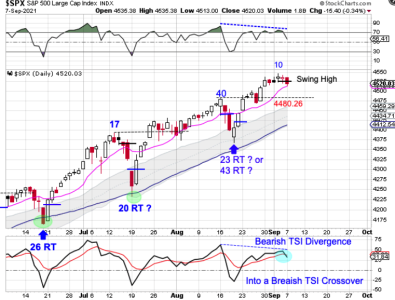
Stocks are now 27 weeks into the current intermediate cycle. That places them deep in their timing band for an intermediate cycle decline. There are bearish divergences developing on the oscillators and the True Strength Indicator has formed a bearish crossover. With a peak on day 10, if stocks deliver bearish follow through to close below the 10 day MA that would set stocks up for a left translated daily cycle formation. Then a break below the previous daily cycle high of 4480.26 can be used as a hard stop to to avoid a potential ICL decline.
https://likesmoneycycletrading.wordpress.com/2021/09/07/stocks-form-weekly-swing-high/
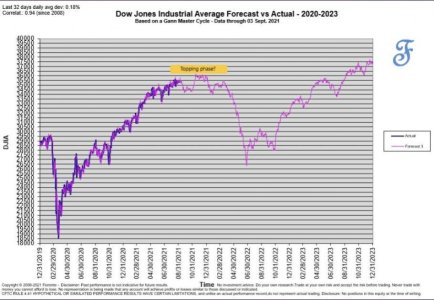
Saw an interesting Gann chart today. Seems too good to be true.
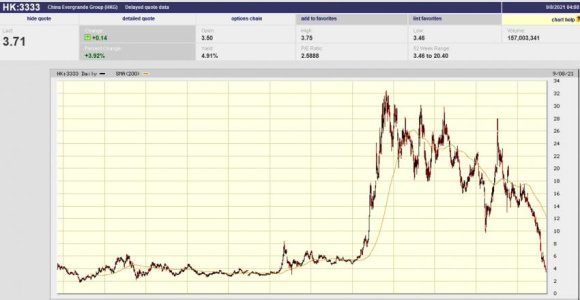
Evergrande is the second largest property developer in China with 500 billion in sales and 300 billion in debt. Several rating agencies downgraded their debt to junk this week. They have supposedly suspended interest payments and payments due to their wealth management products. Will China blink and bail them out?
https://www.asiafinancial.com/fitch-says-evergrande-default-probable-downgrades-developer
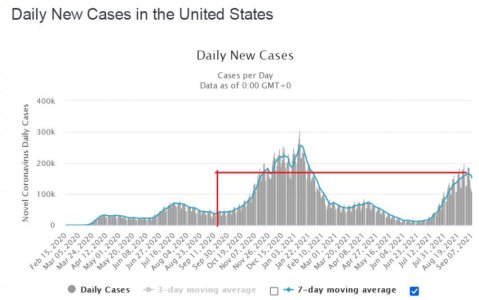
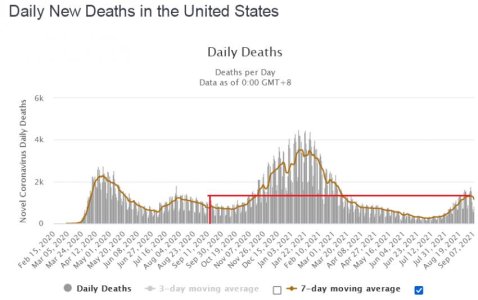
171 million people in the United States have been fully vaccinated against COVID-19. More cases and deaths than a year ago. Winning?
Time to make some of this and watch the show.

https://likesmoneycycletrading.wordpress.com/2021/09/07/stocks-form-weekly-swing-high/

Saw an interesting Gann chart today. Seems too good to be true.

Evergrande is the second largest property developer in China with 500 billion in sales and 300 billion in debt. Several rating agencies downgraded their debt to junk this week. They have supposedly suspended interest payments and payments due to their wealth management products. Will China blink and bail them out?
https://www.asiafinancial.com/fitch-says-evergrande-default-probable-downgrades-developer

171 million people in the United States have been fully vaccinated against COVID-19. More cases and deaths than a year ago. Winning?


Time to make some of this and watch the show.

Last edited:
robo
TSP Legend
- Reaction score
- 471
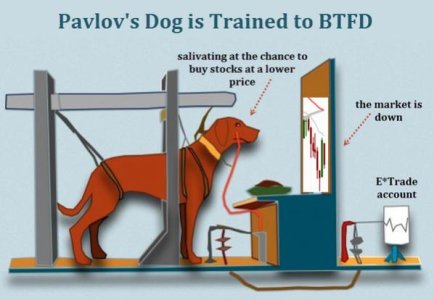
LOL..... Just BTD! One of my favorite pictures.....
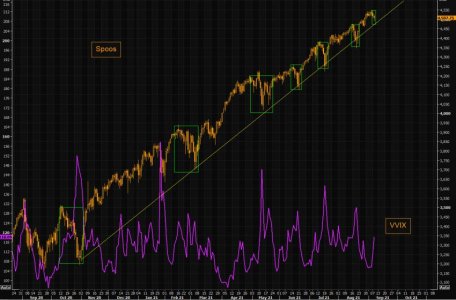
SPX - already time to buy the dip?
The duration and the magnitude of the dips over the past year have been diminishing. Dips last for shorter amount of time and the moves lower are getting smaller and smaller.
Fed has created this Pavlovian investor psychology.
While dips are smaller and actually diminishing, the VVIX has continued to trade with that solid constant bid.
If this continues, the next dip will be a move higher...or?
https://themarketear.com/
Attachments
robo
TSP Legend
- Reaction score
- 471
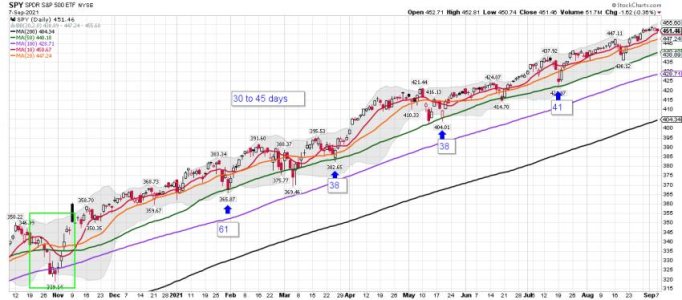
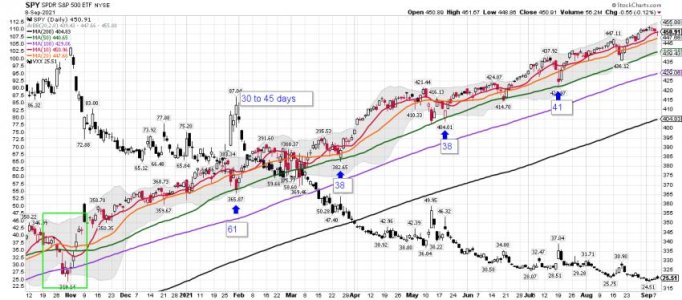
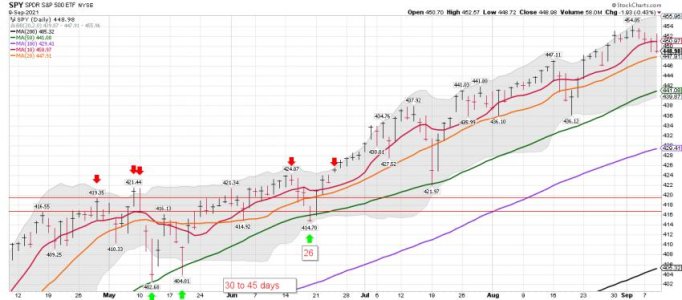
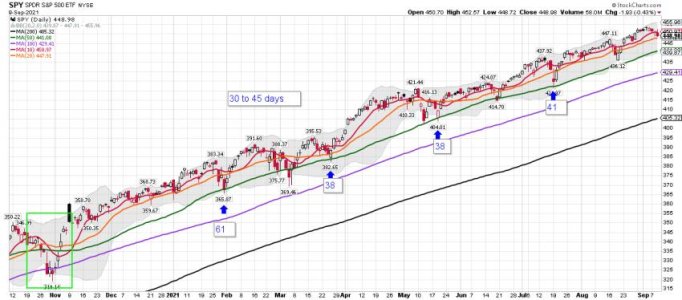
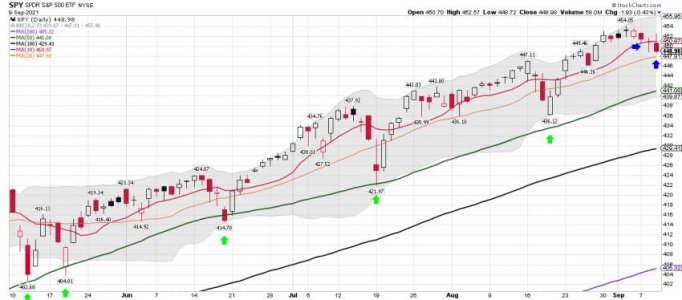
SPY daily: So the trade has been to buy Thursday's close and move into "Easy Money Monday"...... Will this pattern continue to in September? I can ensure you, lots of traders will play this move with leverage. We shall see how it plays out.
The SPY daily is now below the 10 dma, but the buyers should push it back above tomorrow if the pattern holds.... Day 4 of this move down.... LOL... Is that it?
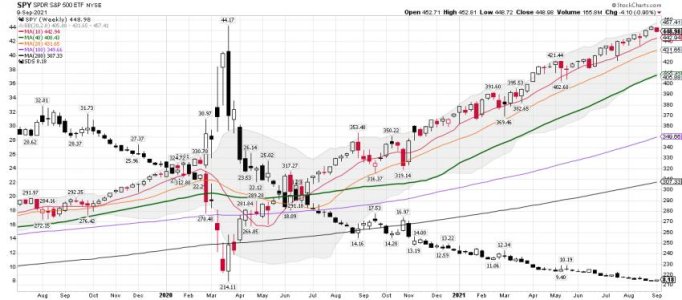
SPY weekly: If we have printed the weekly high we should expect the SPY to test the 10 wma (442ish or lower).... Well, that is what the pattern indicates and is a normal ICL. LOL.... But in this market who knows!
A test of the 50 dma would get us around 440ish..... That has been the 2021 pattern as buyers come in and BTD! Some will be early, but they have NO FEAR since we remain in a Bull Market. LOL...... one day the 50 DMA will fail and we will move down to test the 100 dma. (Around 430ish) But who can say when that will happen.
Attachments
Last edited:
robo
TSP Legend
- Reaction score
- 471
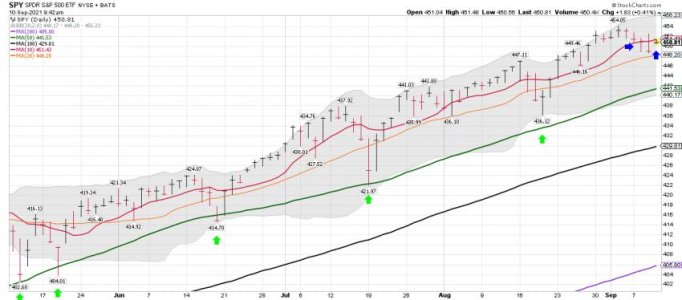
SPY daily: So we start out "Free Lunch Friday" with a gap up. The goal will be to get the SPY back above the 10 dma before the close, and bring in more buyers for "Easy Money Monday." A closer look on this chart.....
Keep in mind, "Free Lunch Friday" and "Easy Money Monday" are just patterns we have being seeing since the last ICL. They are high odds bets if trading, but are not always a 100% winners. We shall see how Friday and Monday play out. As noted we start out with a gap up, and a move back above the 10 dma.
Keep in mind, "Free Lunch Friday" and "Easy Money Monday" are just patterns we have being seeing since the last ICL. They are high odds bets if trading, but are not always a 100% winners. We shall see how Friday and Monday play out. As noted we start out with a gap up, and a move back above the 10 dma.
Attachments
Last edited:
robo
TSP Legend
- Reaction score
- 471
LOL..... Ok! I sure agree..... We shall see, as timing is everything when you are trading.
VTI monthly: The move up continues.....
The Probability of a New Bear Market is Rising
Jason Goepfert
Jason Goepfert
Published: 2021-09-10 at 07:30:00 CDT
Even as the major equity indexes vacillate near record highs, macro conditions are deteriorating and the probability of trouble is rising.
Economic reports have been coming in below economists' expectations, both domestically and globally. As another reflection of those weak reports, our Macro Index Model has been deteriorating.
The U.S. stock market and U.S. economy move in the same direction in the long term. Macro deteriorates from time to time, which is normal during the ebb and flow of an economic expansion. To differentiate temporary slowdowns from real problems, we look for significant macro deterioration. The Macro Index Model combines 11 diverse indicators to determine the state of the U.S. economy.
https://www.sentimentrader.com/blog...l&utm_term=0_1c93760246-bc85b013f7-1271291994
Once the final reports were in for August, the model plunged below 46%, the 2nd-lowest reading of the past decade.
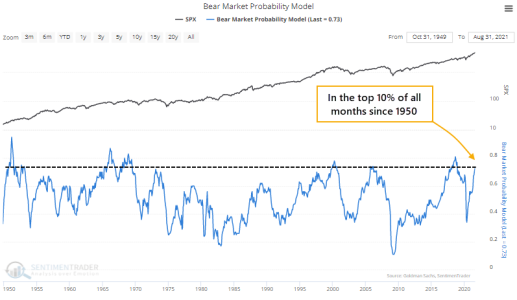
At the same time, the Bear Market Probability Model has jumped again. This is a model outlined by Goldman Sachs using five fundamental inputs. Each month's reading is ranked versus all other historical readings and assigned a score. The higher the score, the higher the probability of a bear market in the months ahead.
Last May, the model was in the bottom 10% of all months since 1950. This month, it jumped into the top 10% of all months.
Attachments
Last edited:

