Bear Cave 2 (Bull Allowed)

"It’s difficult to see where Jerome Powell’s incentive is to – paraphrasing William McChesney Martin Jr – remove the punchbowl as the party is getting started. It's very easy, in contrast, to see his incentive to add an extra kick to it." -Dylan Grice, Skin In The Game: FOMC Style
 

Attachments

  • a.png
    a.png
    108.4 KB · Views: 60
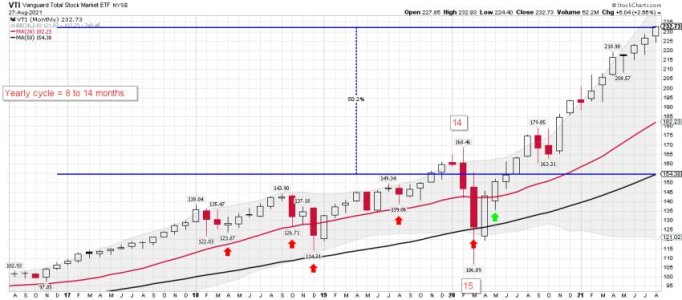
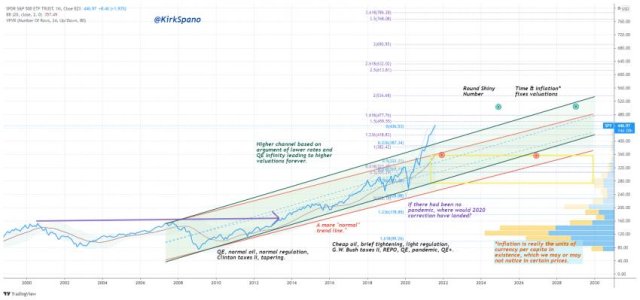
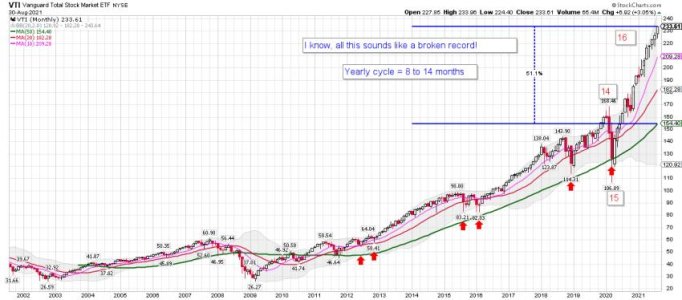
VTI monthly: The Fed gave a big boost to stocks after the COVID smash down in 2020.

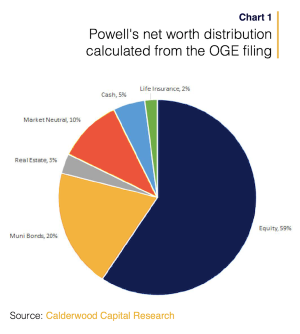
Fed Decries a Wealth Gap It Helps Perpetuate
The longer the central bank continues ultra-easy monetary conditions, the more the richest families benefit disproportionately.
Federal Reserve officials often decry the unprecedented disparity between the wealthy and poor. But they usually avoid mentioning the direct role they have played in widening these financial disparities over the past few decades.

https://www.bloomberg.com/opinion/a...=qpbhckVU&mc_cid=f89e2d6a75&mc_eid=5b348a9ca0
Expect this week’s Jackson Hole symposium to be a prime example of this dual reality, especially because its stated topic is “Macroeconomic Policy in an Uneven Economy.” The goal sounds good and noble, and without a doubt Fed officials are arguably talking more than ever before about inequalities of all kinds in the U.S. economy. But the problem is, the longer they continue ultra-easy monetary conditions, the more the richest families benefit disproportionately. And without different fiscal policies from Washington, the poorest families largely miss out directly.


In other words, all things being equal, the Fed is actively making the wealth gap more pronounced.

https://www.bloomberg.com/opinion/a...=qpbhckVU&mc_cid=f89e2d6a75&mc_eid=5b348a9ca0
 

Attachments

  • a.jpg
    a.jpg
    57.2 KB · Views: 52
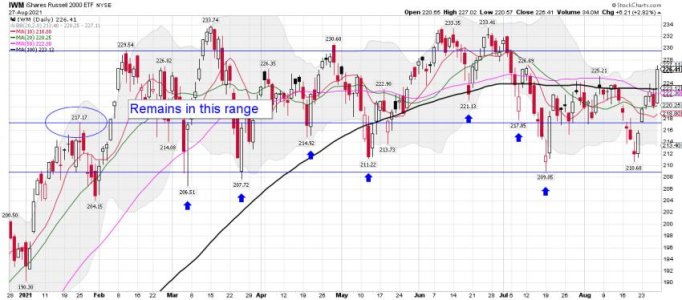
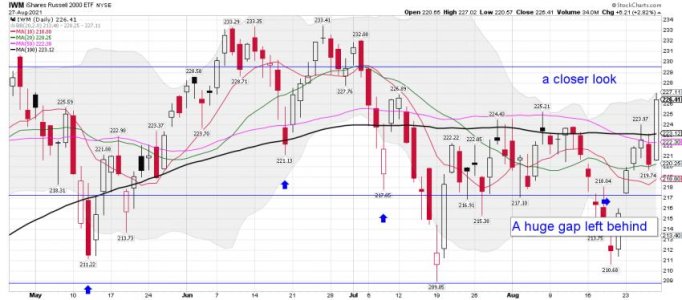
IWM daily: IWM is back on a buy signal for a few days now based on my trend trading system. The cycle data supports it too.... I would bet many paid service are long too. It moved back above, the 10, 20, 50, and 100 dma's very quickly, after being smahed down under the lower BB. I like to take the lower BB crash tags and go long a Beer Money trade. However, it remains in its trading range and tagged the upper BB again. You can see on the chart that a upper BB tag pattern has resulted in a pullback. We shall see how it plays out next week.

Bottom Line: IWM is back on a buy signal and moving higher....
 

Attachments

  • a.jpg
    a.jpg
    62.9 KB · Views: 56
  • a.jpg
    a.jpg
    60.6 KB · Views: 54
Gold Bugs Haven't Liked This Trend

When gold tries to change its long-term trend, it usually struggle. Its sensitivity to economic surprises and interest rates also hasn't helped the outlook over the past few months.

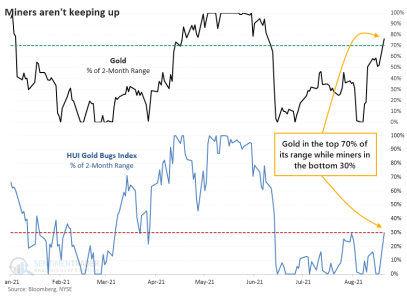
After a June plunge, though, gold has been treading water until recently. After a good week, gold is now trading in the upper end of its 2-month range. Gold mining stocks, however, are struggling.

When mining stocks were in a downtrend at the time, this was not a good sign. After similar divergences between gold and mining stocks, both gold and miners struggled in the weeks and months ahead.

Weakness over the past few weeks, in particular, has meant that some of the breadth metrics among mining stocks that we calculate are starting to reach oversold levels. For example, last week, more than a third of mining stocks fell to a 52-week low, the most in 3 years. That's a high number for a medium-term washout but is well under the 50% or higher figure we see during long-term panics.


Looking at each of them relative to their ranges of the past 2 months, we can see how stark this divergence is.
https://www.sentimentrader.com/blog...l&utm_term=0_1c93760246-58bcdc9028-1271291994
 

Attachments

  • a.png
    a.png
    75 KB · Views: 53
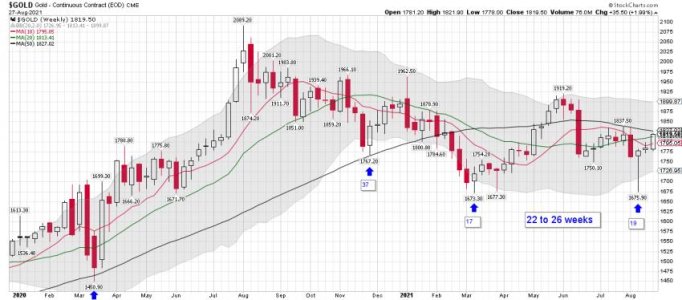
The 22nd was a full moon and that may have marked a new cycle low. The last one was July 23rd (Friday) but the cycle low came a Monday. This time the cycle low looks to have arrived on Friday with the full moon on Monday.
 
The 22nd was a full moon and that may have marked a new cycle low. The last one was July 23rd (Friday) but the cycle low came a Monday. This time the cycle low looks to have arrived on Friday with the full moon on Monday.

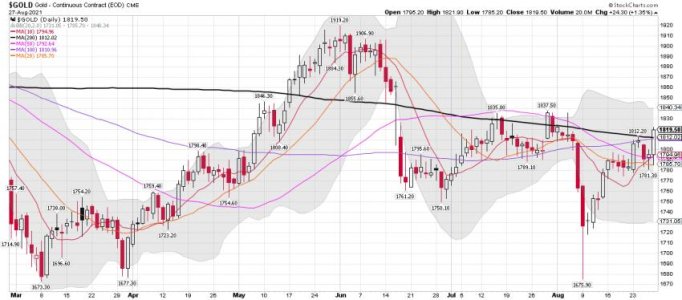
Waiting to see how the cycle count plays out..... Gold has now moved back above the 10 and 20 week ma's (WMA). A buy signal for many is the 10wma. I currently continue to trade this sector from the long side. You never know what will happen on a Sunday Night as this sector can catch you off guard. The world is in big trouble and the stock market doesn't seem to care. When will that change? I be staying nimble for sure!

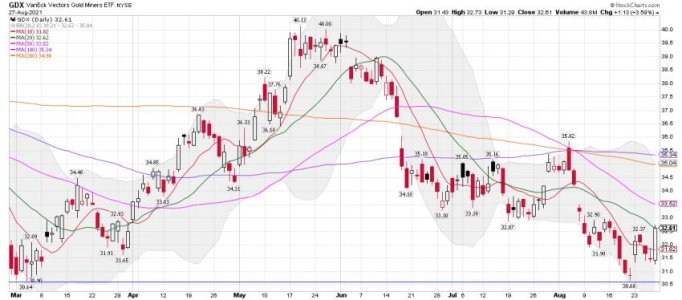
I made some nice money trading the miners last week. I didn't want to give it back. My system remains on a buy signal for gold, and I will buy again this week if the action continues.

Gold weekly: This could be week 3 of a new IC or week 22 of the current one. We should know soon....

Gold daily: A nice move up from the lows. It sure looks like a new daily cycle low and a breakout doesn't it? The 200 dma and the upper BB has capped the last two moves up. (See the daily chart) We shall see if we get a bigger move this time. If we do the ICL was in.....

GDX daily: The 20 dma be up next.
 

Attachments

  • a.jpg
    a.jpg
    61.2 KB · Views: 51
  • a.jpg
    a.jpg
    57.1 KB · Views: 51
  • a.jpg
    a.jpg
    55.1 KB · Views: 51
Last edited:
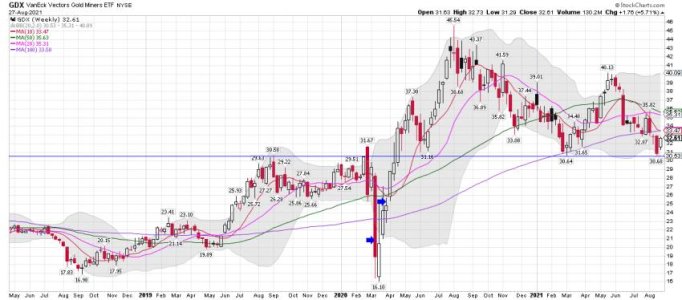
A chart guy I track. To much end of the world **** being posted on 321 gold these days, but this guy sticks with the charts. I'm still looking to go long SLV/AGQ. Nothing I can do about the end of the world stuff. I stick with just world news these days and the Beat on MSNBC. That be enough of the daily news cycle for me. I will be watching the current storm hitting the coast and hope there isn't any loss of life. As big as that storm is that might not be possible. I'm sure some are going to ride it out.

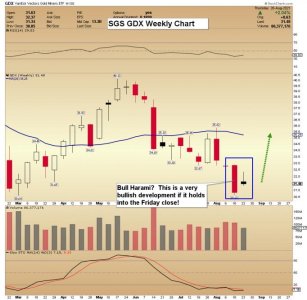
GDX: A Weekly Chart Bull Harami?
Morris Hubbartt

Aug 27, 2021 GDX: A Weekly Chart Bull Harami? Morris Hubbartt 321gold ...inc ...s
 

Attachments

  • a.jpg
    a.jpg
    64 KB · Views: 50
  • a.jpg
    a.jpg
    58.8 KB · Views: 50
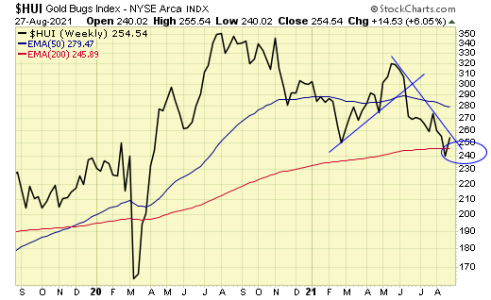
Another guy I track:

Gold Price Exclusive Update
Jack Chan
Technical Analyst & Editor
August 28, 2021
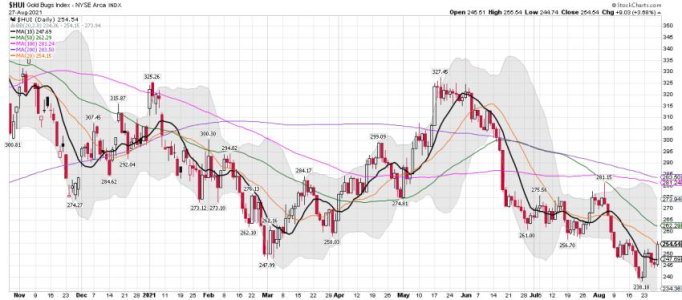
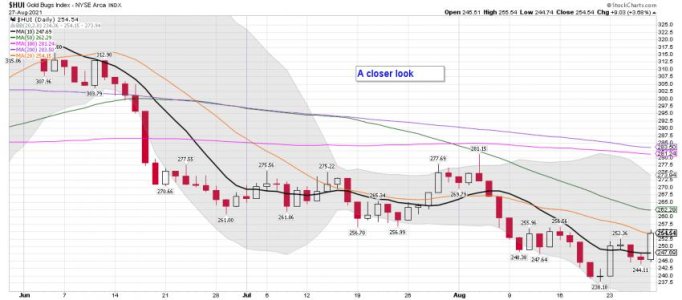
Major support for $HUI now.

Summary

Long term – on major SELL signal.

Short term – on buy signals.

Gold sector cycle is down.

$$$ We closed out all of our positions with good profits, and now waiting for new set ups.
 

Attachments

  • a.png
    a.png
    14.5 KB · Views: 56
  • a.jpg
    a.jpg
    60.2 KB · Views: 57
  • a.jpg
    a.jpg
    52.8 KB · Views: 58
The wall of worry remains in place:

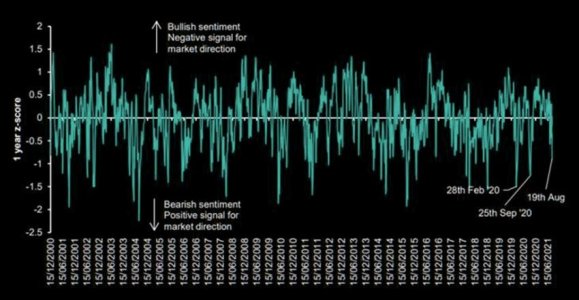
First Chart:

Sentiment: turning more bearish
Sentiment turned more bearish last week but not to an extreme level. Bearish sentiment was driven by derivatives positioning and volatility spread indicators. Flows remained stable and the indicator is not at a level extreme enough to give any directional market signal.

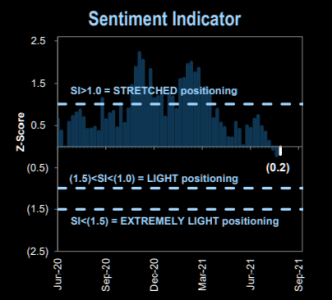
Second chart:
Sentiment: 3 weeks in negative territory
The GS Sentiment Indicator has now spent 3 weeks in "light positioning" territory. The indicator measures stock positioning across retail, institutional, and foreign investors versus the past 12 months. Readings below -1.0 or above +1.0 indicate extreme positions that are significant in predicting future returns


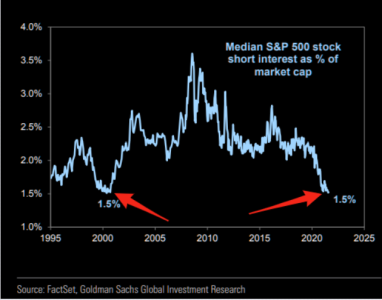
Third Chart:

Total short interest in U.S. securities has retested its previous all-time record low from the 1999-2000 bubble:
 

Attachments

  • a.jpg
    a.jpg
    54.7 KB · Views: 70
  • a.png
    a.png
    36.7 KB · Views: 69
  • a.png
    a.png
    79.8 KB · Views: 72
When It's Time to Switch to Precious Metals
Jason Goepfert


Published: 2021-08-30

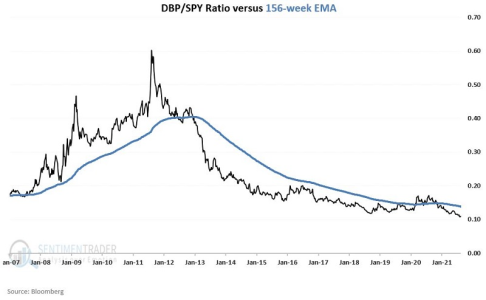
Except for several months in 2020, stocks have been outperforming previous metals for most of the last 5 years. There is a great deal of "back and forth" and a low degree of correlation between the two, which is one of the appeals of holding metals in a portfolio.

For those looking for a long-term way to allocate to precious metals, Jay suggested watching the ratio between DBP and SPY along with its 156-week (3-year) exponential moving average.

The black line ("Switch") in the chart below represents the hypothetical return achieved by holding DBP if the ratio is above its average and SPY if it's below its average. The blue line ("Buy/Hold/Rebalance") in the chart below represents the hypothetical return achieved by holding 50% in DBP, 50% in SPY, and rebalancing to a 50/50 split at the beginning of each new year.
https://www.sentimentrader.com/blog...l&utm_term=0_1c93760246-6bc55a1fa5-1271291994
 

Attachments

  • a.png
    a.png
    140.1 KB · Views: 71
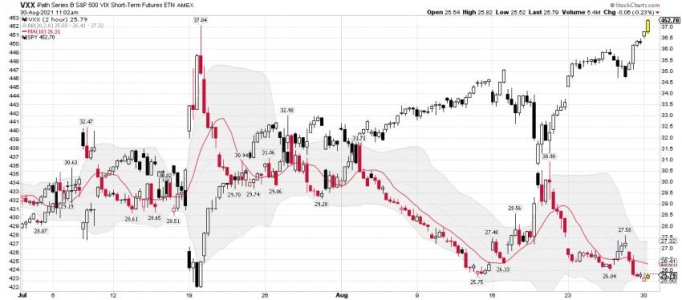
$VIX 2 hour chart: Don't forget that it's Easy Money Monday! Not much bothers the current SPY run higher.

https://stockcharts.com/h-sc/ui?s=VXX&p=120&yr=0&mn=2&dy=0&id=p01957493709&a=1018172567
Bottom Line: The Trend remains up.....

thomas
@VolumeDynamics

6m
Whole World is crumbling and Powell just keeps trotting out the $VIX Crushas... like the solution is all about higher stock prices... all the printing in the World has no impact on Psychology... it may make Wall St. feel good, but Main street doesn't care.
https://twitter.com/VolumeDynamics
 

Attachments

  • a.jpg
    a.jpg
    53.6 KB · Views: 75
LOL...... Someday.....Maybe!

Squawk Box
@SquawkCNBC

2h
"I think we are witnessing a high probability of a policy mistake. Is it going to be as big as the '70s? No it is not. But it is going to be big. I worry that we are going to destabilize both inflation expectations and wage expectation," says
@elerianm
on the Fed.

https://twitter.com/elerianm
 
It seems that way almost everyday: Markets Higher on Negative NYSE and NASDAQ Breadth. Let us not forget about the Hindenburg Omens..... One of these days we will get another market crash, but for now the trend remains up! What happened to the jaws of death pattern? A huge breakout....

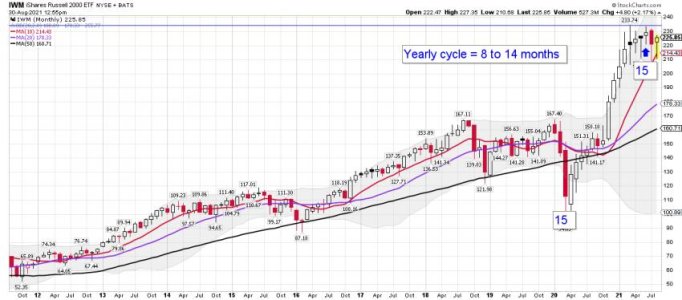
IWM monthly: Taking another shot at a ATH again..... So far another lower high..... Watching this one! So far 6 months of sideways action.

Here Comes the Next Hindenburg Omen, Right on Schedule. Read This Weekend's August 20th Newsletter for the Details.


Patterns tell us that A Stock Market CRASH will start in the next 6 Months, possibly much sooner. Read our U.S. Weekend Market Newsletter, issue no. 4186, for the reasons we believe the Market is communicating this dire warning, how bad it is going to be, and when it will arrive.

https://www.technicalindicatorindex.com/Default.asp
SevenSentinels
@SevenSentinels


SevenSentinels
@SevenSentinels

Markets Higher on Negative NYSE and NASDAQ Breadth
https://twitter.com/SevenSentinels?ref_src=twsrc^google|twcamp^serp|twgr^author
 

Attachments

  • a.jpg
    a.jpg
    55.9 KB · Views: 80
Last edited:
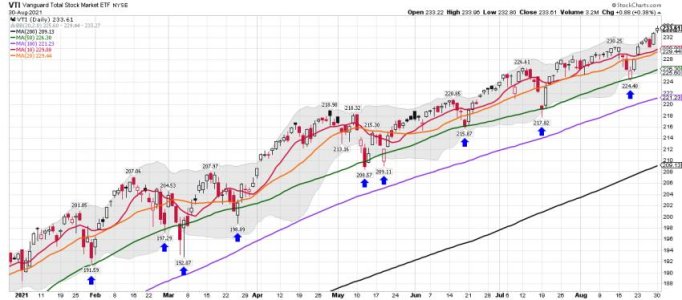
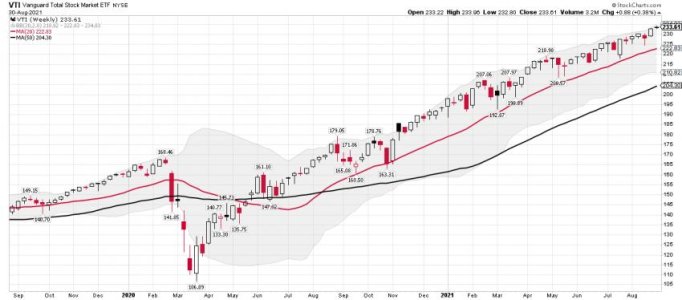
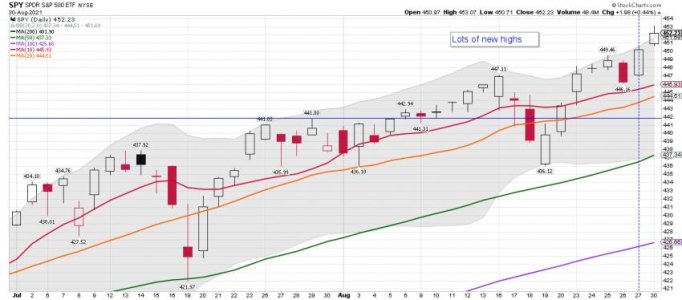
VTI daily and Weekly: As a trend trader how can you not like this run..... ( VTI is the Total Stock Market)

Bottom Line: The trend remains up!

Hard Stop
Posted on August 30, 2021

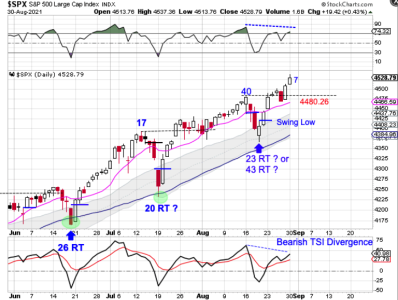
The declines in June, July and now August have not satisfied the usual criteria for a DCL. We are seeing 4 – 5 day declines that are being bought buy “dip buyers”, which is obscuring our timing bands.

At 26 weeks, stocks are due for an intermediate cycle decline. Once again, stocks are becoming stretched above the 10 day MA. Stocks may consolidate to allow the 10 day MA to catch up to price. But a break below the previous daily cycle high of 4480.26 can be used as a hard stop to to avoid a potential ICL decline.

https://likesmoneycycletrading.wordpress.com/author/likesmoneystudies/
 

Attachments

  • a.png
    a.png
    132.4 KB · Views: 73
  • a.jpg
    a.jpg
    57.8 KB · Views: 73
  • a.jpg
    a.jpg
    47.4 KB · Views: 74
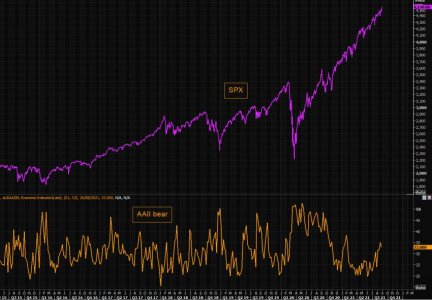
(Still) too many bears around
Last weeks' AAII bear sentiment was no good reading for the bears. We need bears to go back to hibernation before anything meaningful can occur to the downside.
https://themarketear.com/
 

Attachments

  • a.jpg
    a.jpg
    76.7 KB · Views: 76
It looks that way....

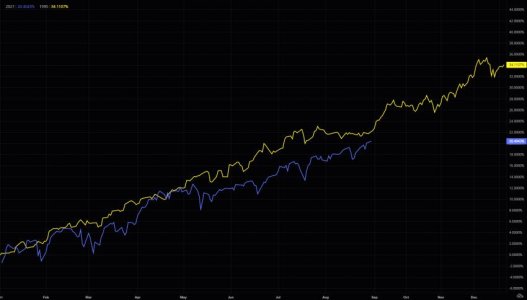
Should we get ready for upside pain part 2?
If we are to follow the SPX 1995 vs now seasonality things could get even more "painful" to the upside...

It looks like upside crashing is the new risk investors need to start pricing.
https://themarketear.com/
 

Attachments

  • a.jpg
    a.jpg
    33.2 KB · Views: 77
An amazing run.....

Carter Braxton Worth
@CarterBWorth
Aug 27
For the month of August we've made 10 new intraday, all-time highs in the $SPX... this hasn't happened in the month of August since 1987. The record number of intraday, all-time highs in the month of August is 11... which happened in 1929.
 

Attachments

  • a.jpg
    a.jpg
    53.4 KB · Views: 81
Back
Top