Bear Cave 2 (Bull Allowed)

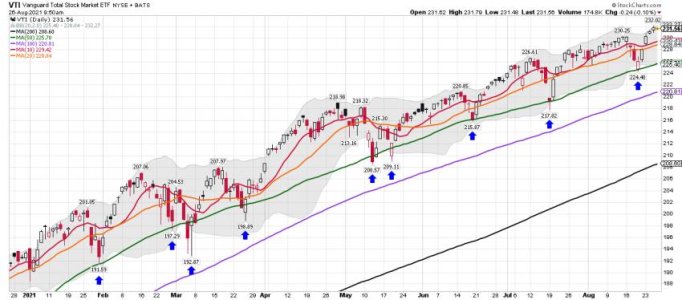
VTI daily: The Total Stock Market..... Just BTD!

Bottom Line: The trend remains up!


Yet Another Breadth Thrust to Frustrate Shorts
Jason Goepfert
Jason Goepfert
Published: 2021-08-26 at 07:30:00 CDT
Just leave it to this market. Unbelievable.

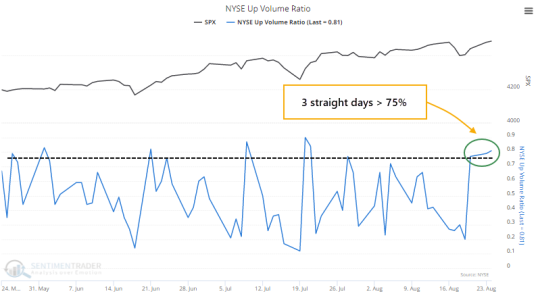
Seemingly whenever something negative triggers, buyers show up immediately. We saw on Monday that the S&P 500's approach to its former high was accompanied by a negative McClellan Summation Index and more 52-week lows than highs on the NYSE.

No matter, stocks continued to rise, and breadth turned around. The switch was dramatic enough that more than 75% of volume on the NYSE flowed into advancing securities. It happened on Monday, too. And Friday.
https://www.sentimentrader.com/blog...l&utm_term=0_1c93760246-0830d77b14-1271291994
 

Attachments

  • a.png
    a.png
    52.8 KB · Views: 55
  • a.jpg
    a.jpg
    57.1 KB · Views: 55
Breadth thrusts have been massively bullish since the COVID drop.

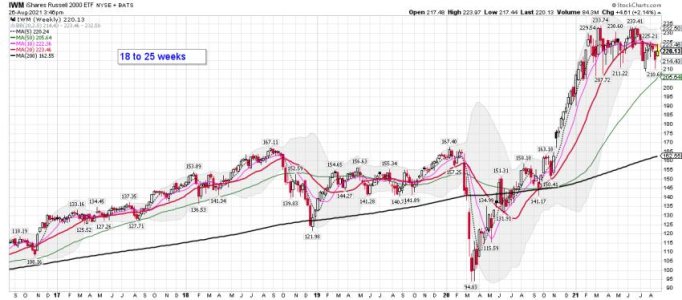
My problem is IWM and TRAN are both in the dumps. Markets will need them to get moving higher.

Retail earnings this week have made market participants unhappy, though most of these stores are in malls that pulled sales forward with discounts in Q1.

Sentiment still nowhere near a buy.
 
IWM weekly: I'm sure looking for move down much closer the the 200 wma in the months ahead.... We shall see how it does during the next YCL and we will have one....

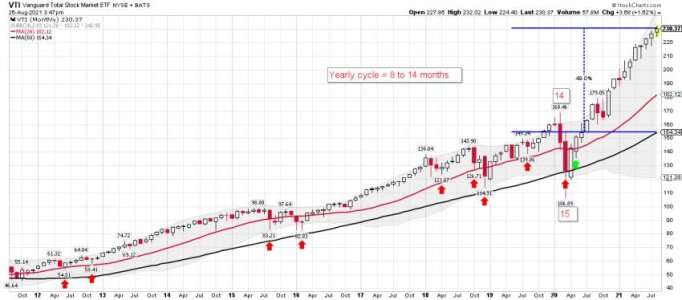
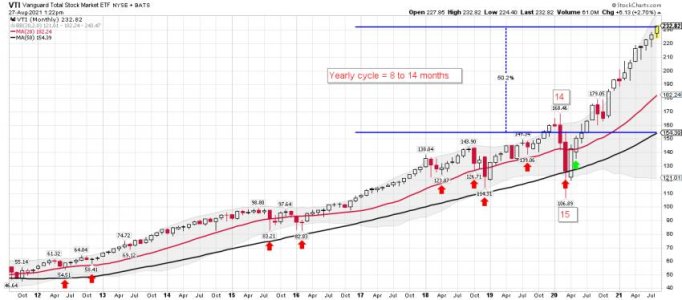
VTI monthly: This cycle is very stretched thanks to the Fed......
 

Attachments

  • a.jpg
    a.jpg
    62.6 KB · Views: 48
  • a.jpg
    a.jpg
    52.2 KB · Views: 48
When the bad news comes, valuations are high and there isn't much downside support. A 10-20% correction could come on very quick.
 
When the bad news comes, valuations are high and there isn't much downside support. A 10-20% correction could come on very quick.

I agree Brother. One can continue to trade from the long side, but I would sure keep it small.
 
https://likesmoneycycletrading.wordpress.com/2021/08/27/simple-silver-plan/

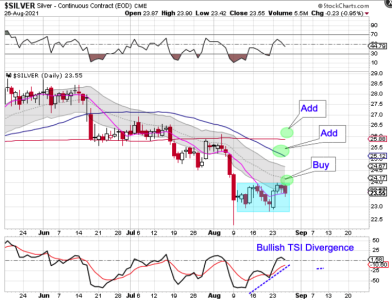
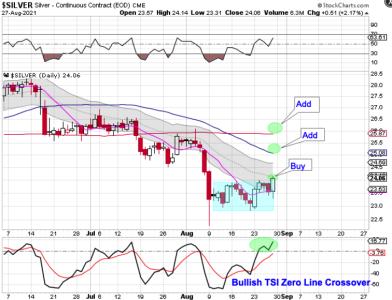
Silver has been consolidating below the 24 level for the past 3 weeks.

slv.png

A bullish break out of consolidation could lead to a trending move. A simple plan would be to buy the break above 24.00. Add on a close above the 50 day MA. Then add again on a close above the 200 day MA. The first stop would be a close back in consolidation. The next would be a close back below the 50 day MA. Then once above the 200 DMA, using that as the stop.
 
Last edited:
https://northmantrader.com/2021/08/26/mistake-2/

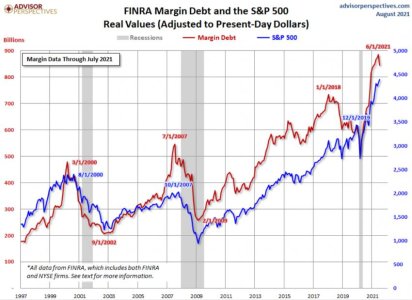
The Fed has failed to heed all the voices of reason and now they’re stuck with a massive asset bubble that can’t afford to break its trend for failure is not an option and Powell needs to maintain confidence in an environment where consumer confidence has already begun to drop, inflation continues to exceed expectations and supply chain constraints are proving to be much more persistent while margin debt having just rolled over, a historic precursor to market roll overs to come.

margin debt.jpg

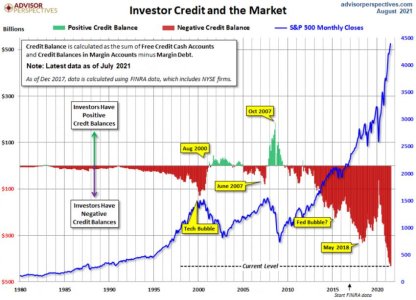
These type of roll overs can have minor or major implications. To be determined but in this age of excess it should come as no surprise that the margin debt debt equation has also taken on historic proportions leaving room for the possibility for a larger unwind to eventually to come than any of us could imagine at the moment.

credit.jpg
 
Last edited:
I'd love to see what Sven really does with his money. He was kind of right about the crash, but has been wrong since April 2020. I stopped following the guy last spring since I just couldn't take it anymore. Every day new evidence of a crash that will happen tomorrow.

People have been calling for rate rises for 20 years. Howard Marks, a genius, said in 2003 that rates have nowhere to go but up. Well, his call was made at the top of the 30 year rate. They've gone down ever since and he's still a billionaire.

Are you talking about this guy?

https://twitter.com/SevenSentinels?ref_src=twsrc^google|twcamp^serp|twgr^author
 
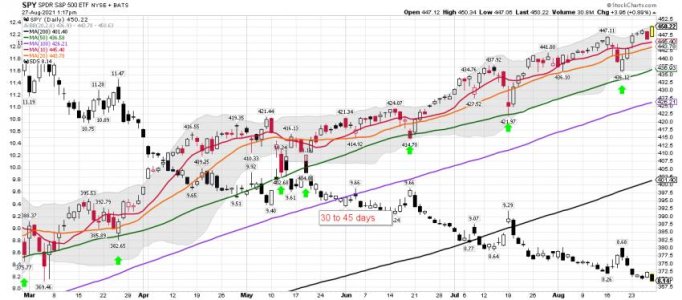
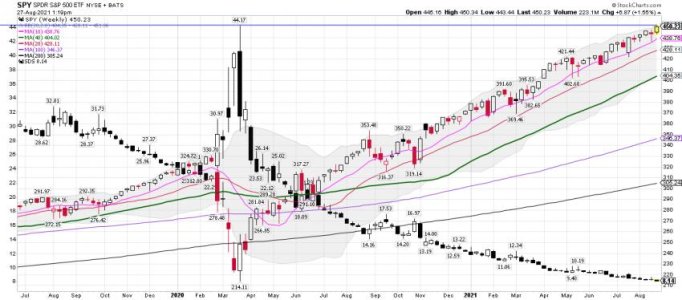
SPY daily: So we have free lunch Friday and Easy Money Monday in play.
SPY weekly: The weekly cycle remains Very stretched....
VTI monthly: Also very stretched but most traders and investors just don't care. Someday we will get a YCL..... LOL.... Maybe a move down around 5%.....
Bottom Line: The SPY and the Total Stock Market trend remains up!
 

Attachments

  • a.jpg
    a.jpg
    67.7 KB · Views: 43
  • a.jpg
    a.jpg
    61.8 KB · Views: 41
  • a.jpg
    a.jpg
    52.9 KB · Views: 41
"Silver has been consolidating below the 24 level for the past 3 weeks."

Red,

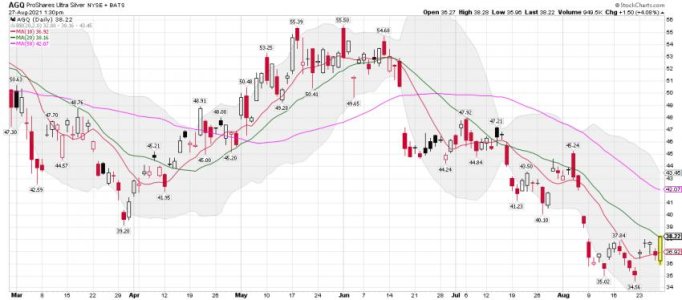
I will be looking to buy some silver - AGQ..... Trading some JNUG today as the dollar takes a hit..... Selling my remaining miner positions with this move up and will reload later.

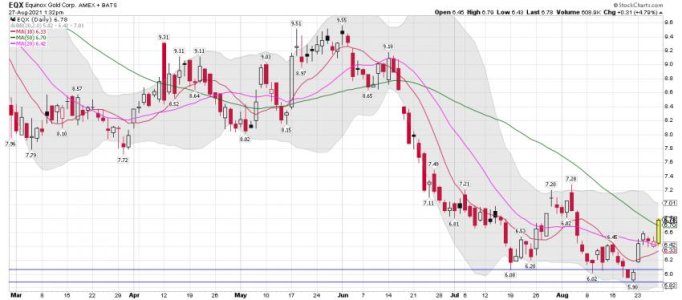
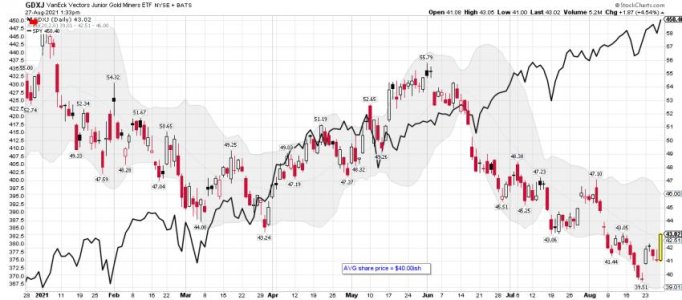
Selling EQX and GDXJ..... ST trading JNUG today ONLY! I will go flat into the weekend.

For the record: A closing move above the 10 dma is a buy signal for me. However, I take it slow in this sector and 100% position for me is only a 10% position in one of my Vanguard accounts. I ST trade JNUG, NUGT, and DUST when I like the setups. I'm a TRADER not an investor in the metals/miner sector.
 

Attachments

  • a.jpg
    a.jpg
    84.8 KB · Views: 45
  • a.jpg
    a.jpg
    50.4 KB · Views: 45
  • a.jpg
    a.jpg
    53.2 KB · Views: 44
  • a.jpg
    a.jpg
    56.7 KB · Views: 44
Last edited:
Red,
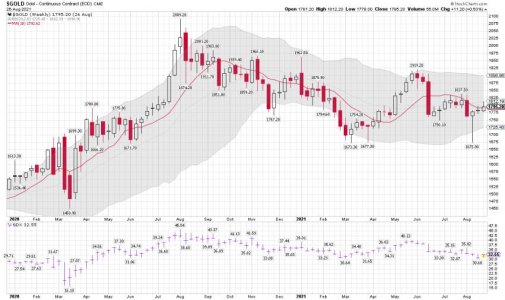
The weekly cycle low for gold "COULD" already be in..... We shall see how this plays out.....

Gold weekly: Waiting!
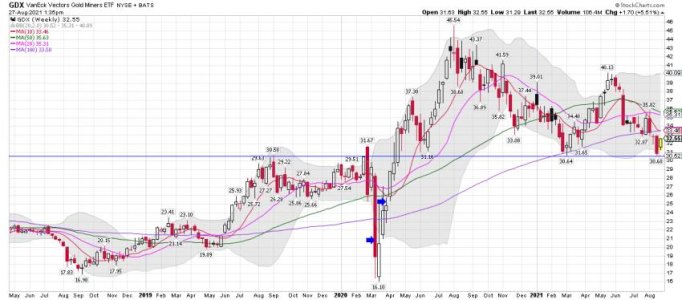
GDX weekly: Two gaps on that chart that COULD fill if the Bankers crush gold down again. Also, a 10% move down for stocks could also smash down the miners...

I remain a ST trader only in this sector. Been doing ok lately in this sector.
 

Attachments

  • a.jpg
    a.jpg
    78 KB · Views: 47
  • a.jpg
    a.jpg
    59 KB · Views: 46
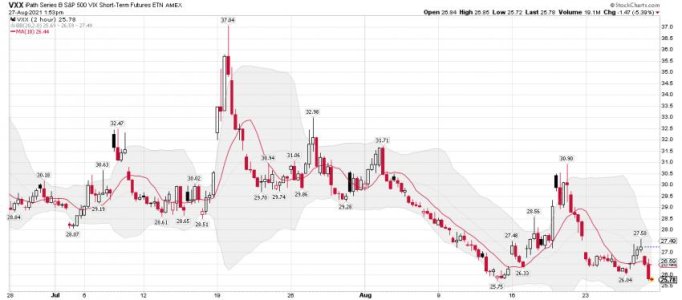
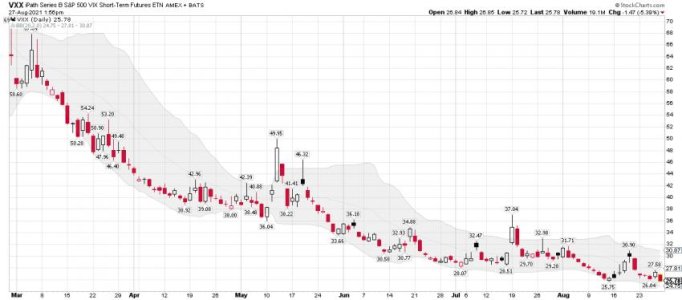
I might place a Beer Money trade using VXX today.....

VXX 2 hour chart: Testing the lows......

VXX daily: We shall see if we are hitting a ST bottom. I decided to take a small position. Buying only 50 shares.... Buy protection when it's cheap. We shall see how it closes....

Long VXX @$25.75..... I might add another tranche later since this is a small trade. Around $25.50ish if we get there and it looks possible.

08/27/2021 Executed VXX BARCLAYS IPATH SER B S&P 500 VIX SHORT TRM FUTURE ETN NEW Buy Limit: $25.75 Day 50.000 $25.75 —
 

Attachments

  • a.jpg
    a.jpg
    44.9 KB · Views: 48
  • a.jpg
    a.jpg
    44.3 KB · Views: 49
Last edited:

No, I actually like Don's stuff even though his time frames are too short for me.

I'm talking about Sven Henrich

https://twitter.com/NorthmanTrader

He caught my eye when he made a few calls about support lines after the crash, but both him and his "sniper" wife thought it would run out of gas around April-May 2020. He's been complaining about fed intervention ever since - and still is to this day.

Perfect example of a tweet from an hour ago: https://twitter.com/NorthmanTrader/status/1431301753698459649

Gotta Brother..... I use to read his stuff too, but haven't lately..... Love it or hate the Total Stock Market Melt-up continues.
 
I got stopped out of a position in yesterday's downdraft that was mostly LT cap gains. It had become a very volatile stock in 2021 and I'm glad to be out of it. Re-invested some back into a treasury ETF, the rest will be used to pay for a recent trip. It's hard not to notice the golden cross in bonds two weeks ago.
 
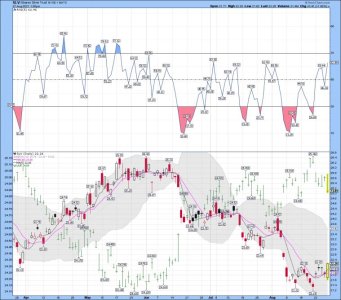
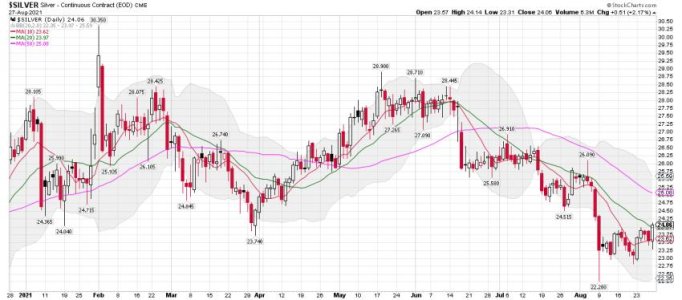
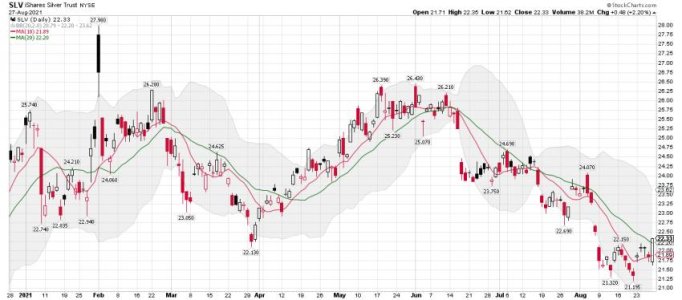
SLV daily: A move above the 10 and 20 dma is a buy, but I need to see a move above the 10 wma and a confirmed ICL. However, nothing wrong with this plan if you are a trader like me. I will be trading AGQ.

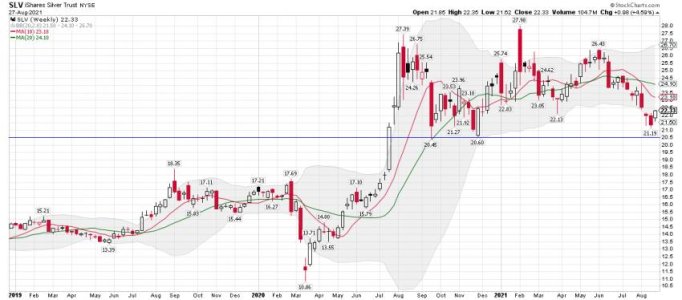
SLV weekly: Remains below the 10 wma.... I'm waiting on the confirmed weekly ICL...... before getting to a 10% position

$Silver daily:

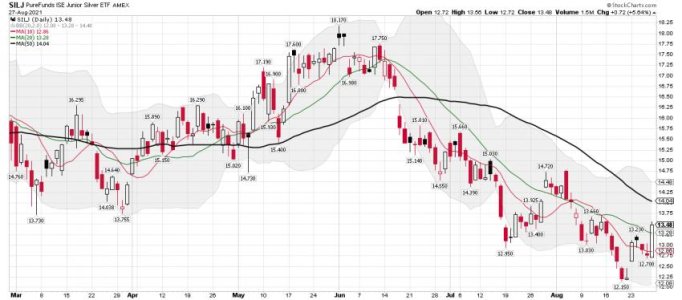
SILJ daily:

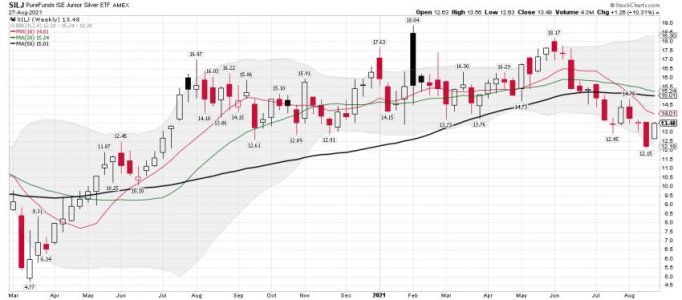
Silj weekly:

Simple Silver Plan – Update

Silver closed above the 24 level on Friday.

Silver has been consolidating below the 24 level for the past 3 weeks. Silver broke above consolidation on Friday, which could lead to a trending move. Closing above 24 was a buy signal. Positions can be added to with a close above the 50 day MA, then again on a close above the 200 day MA. The first stop would be a close back in consolidation. The next would be a close back below the 50 day MA. Then once above the 200 DMA, using that as the stop.
https://likesmoneycycletrading.wordpress.com/2021/08/28/simple-silverplan-update/
 

Attachments

  • a.png
    a.png
    116.5 KB · Views: 43
  • a.jpg
    a.jpg
    58.5 KB · Views: 41
  • a.jpg
    a.jpg
    54.4 KB · Views: 40
  • a.jpg
    a.jpg
    54.7 KB · Views: 40
  • a.jpg
    a.jpg
    53.9 KB · Views: 40
  • a.jpg
    a.jpg
    50.4 KB · Views: 40
Last edited:
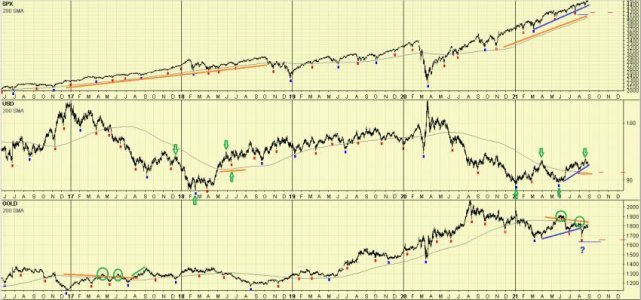
Cycles Chart.

Waiting for ICL in stocks (break of blue trend line).

Dollar close to ICL drop (break of blue trend line). Higher lows and highs so that is positive for dollar but a drop is coming soon.

Gold broke the intermediate (blue) trend line in August so I should mark that as an ICL. We had a couple peeks above the 200 DMA in 2017 before gold broke out. Looks like we are repeating that (albeit weaker this time).

$cycles$.jpg

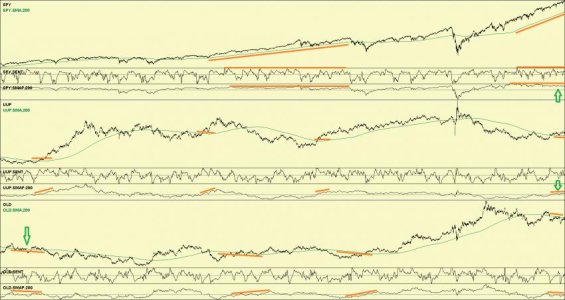
Market Sentiment and 200 DMA charts. For grins I marked the divergence between the 200 turning down and the distance from the 200. Divergence on UUP like prior turns but weaker this time. Divergence on gold similar to weakness seven years ago.

SPY 200 sloped up more and price farther above 200 than last big run in 2017. Sentiment is similarly high. 2017 run ended with lower sentiment and lower 200 stretch which we haven't seen yet. BTFD.

UUP 200 is turning up but stretch from 200 is weak compared to previous turns. Odd.

GLD 200 is turning down but stretch from 200 is weak compared to previous turns (similar to seven years ago). Odd.

Markets.jpg

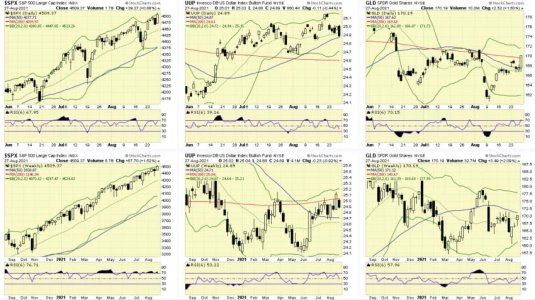
Daily/Weekly market chart. SPX looks strong. UUP weak. Gold strong.

charts.jpg

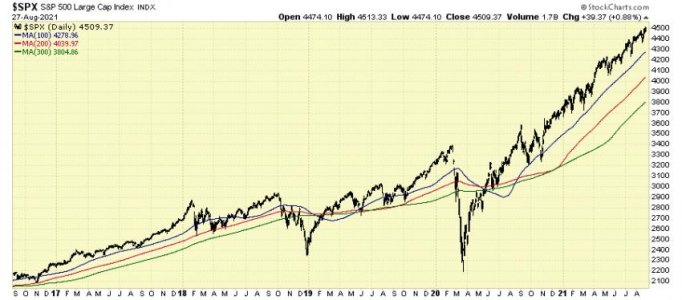
SPY ribbon chart is a powerhouse so BTFD.

ribbon.jpg

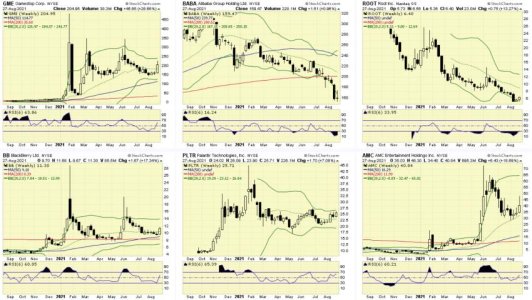
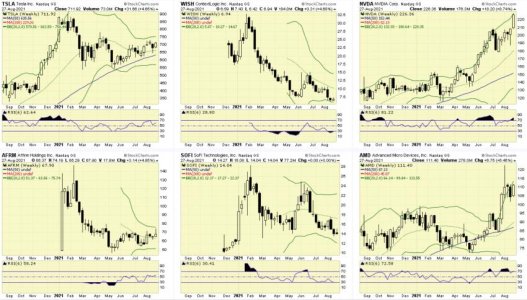
Wallstreet Bets hot stock charts (weekly). BABA, ROOT and WISH look like they are bottoming.

wsb1.jpg

wsb2.jpg

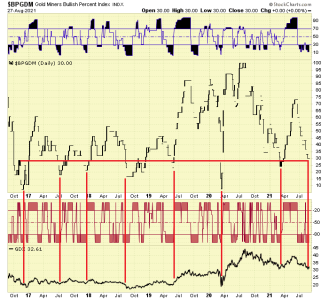
BPGDM chart. Not the usual BPGDM level for a GDX low. I am hoping for one more drop (there is still intermediate cycle time) but maybe that is because I don't own any metals.

bpgdm.png

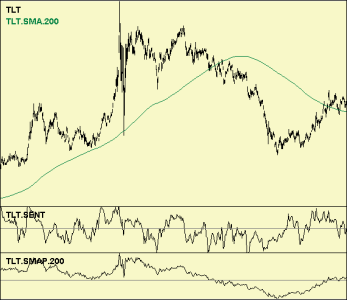
Here is a small TLT chart to check sharpness. The original is 570x493 (9.24KB) and razor sharp. The attachment is displayed at 713x615 (9.24KB). It looks like the images are stored full-size but displayed in a different size which blurs them. I see the need to shrink large images to fit the screen but can the Admin change things so small/normal images are displayed at their actual resolution?

tlt.png

It is tedious to create these large posts. It would be faster if I could upload a document with text/charts which got turned into a post by the system. Also upload files keeps changing to URL. Can it be made sticky so I don't have to keep changing it back to From Computer?

And finally, here is an exclusive video of Powell's speech at Jackson Hole.

 
Back
Top