Bear Cave 2 (Bull Allowed)

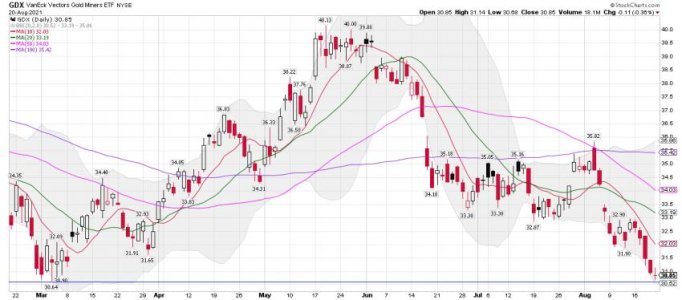
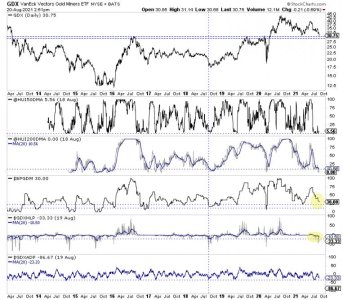
The chart below includes GDX and breadth indicators for the HUI and GDX at the bottom. Significant lows in the sector have occurred with the bullish percentage index (currently at 30%) at 20% and lower. The number of new lows in GDX (smoothed by a 20-day average) is not yet as low as in 2018.

https://thedailygold.com/gold-stocks-breakdown-whats-next/


gdx.jpg

Maximum uncertainty regarding the Fed is sometime between Jackson Hole and the FOMC meeting in September. That coincides with gold's estimated DCL. On the other hand (and to cover my butt) I will mention that Kaplan switched to the "no taper" camp last week so maybe gold already bottomed and we go sideways for a week before heading to the moon.

moon.jpg
 
It all looks like a bullish setup to me. Bull flag/pennant on support with BPI's oversold.

Back when GDX was in the 40's and Buffet bought Barrick, everyone was on board but that is not the case today.
 
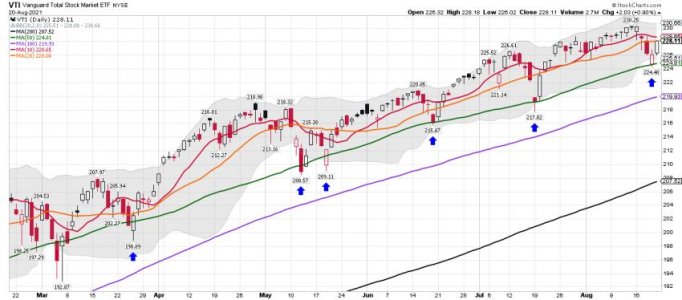
VTI daily: The total stock market. There are a few reasons I like using the Total Stock Market (VTI) at Vanguard. VTI gives you a better picture of the overall stock market.

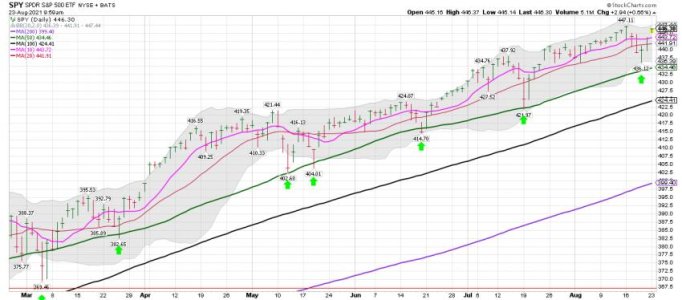
Bottom Line: VTI is back to a cash position and still under the 10 and 20 dma. However, a tag of the lower BB and the 50 dma has been an excellent BTD point. We shall see if the pattern holds next week. I will point out again the week after OPTX can have increased selling pressure.

Bottom Line: If you are using the 50 dma for buy and sell signals you have remained long during this cycle. Did we just start a 5th daily cycle? Amazing because they normally average 3.

For the record: I use the 10 dma, but I have unlimited moves and I can trade anytime during the trading day. I can also trade during early trading and after hours. My point is I can sell after the index price moves below the 10 dma and buy my shares back quickly. Yes, I do get whipsawed sometimes.
 

Attachments

  • a.jpg
    a.jpg
    54.2 KB · Views: 39
U.S. Treasury Secretary Janet Yellen has told senior White House advisers that she supports reappointing Jerome Powell as Federal Reserve chair, according to people familiar with the matter, a move that greatly increases his chance for a second term. President Joe Biden hasn’t made a decision yet and is likely to make his choice around Labor Day, the people said.

https://www.bloomberg.com/news/articles/2021-08-21/yellen-said-to-back-jerome-powell-reappointment-for-fed-chair?cmpid=socialflow-twitter-business&utm_campaign=socialflow-organic&utm_content=business&utm_medium=social&utm_source=twitter

This removes some uncertainty about future Fed policy.

Aha, figured out how to delete attachments. Click manage attachments, hover over the image and click X. Still trying to figure out how to delete a post.
 
Last edited:
It all looks like a bullish setup to me. Bull flag/pennant on support with BPI's oversold.

Back when GDX was in the 40's and Buffet bought Barrick, everyone was on board but that is not the case today.

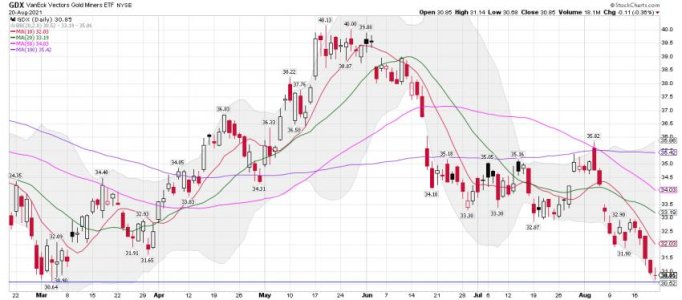
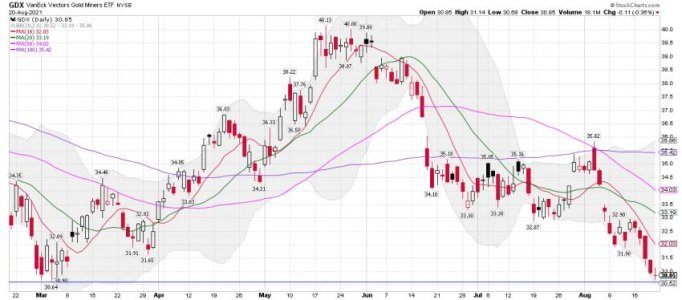
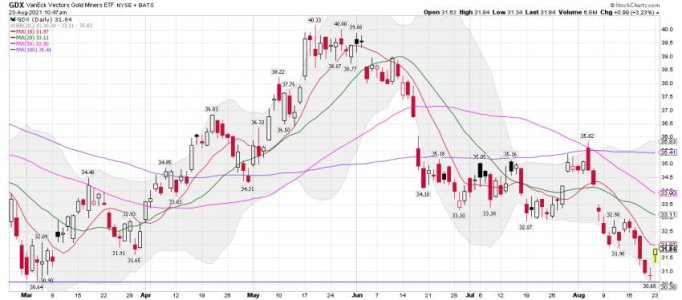
I have been doing the Kaplan thing this selloff Brother. I continue to add shares of the miners in small bites. The $30.64 marker on the GDX chart held last week, and we got a lower high of $30.85. I use the closing prices of these markers. We shall see if it holds or sellers keep moving it lower. Someone bought that level last week. We shall see if they have orders to buy more shares around this area. Again, it's the daily closing prices I will be watching and a possible weekly cycle low in the next few weeks.

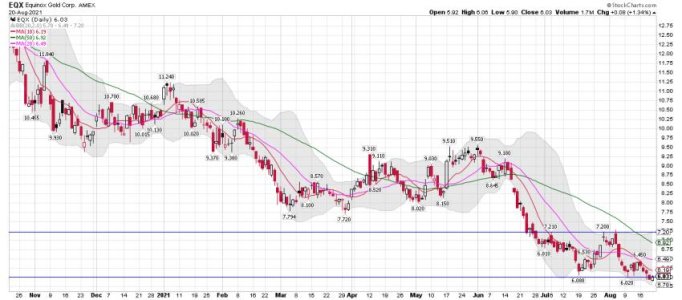
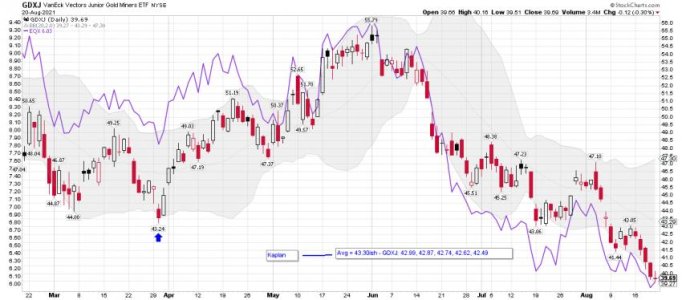
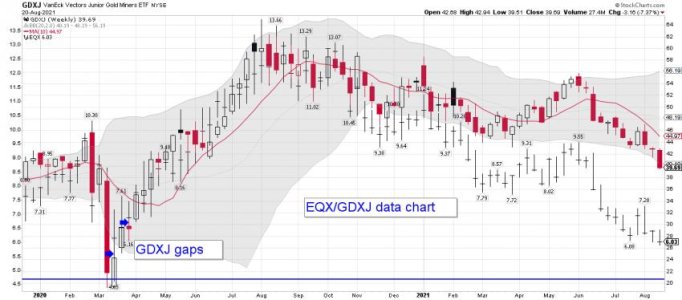
Bottom Line: I'm Long GDXJ and EQX.
 

Attachments

  • a.jpg
    a.jpg
    58.8 KB · Views: 42
  • a.jpg
    a.jpg
    58.1 KB · Views: 42
  • a.jpg
    a.jpg
    54.1 KB · Views: 42
"Sorry about the jumbo image. The only way to get rid of it is to wait an hour. Ack, now there are two of them. How can I delete this entire post?"

You have to do it before the time runs out. Once the Edit Post icon, at the bottom of the post (Edit Post), can no longer be selected it's to late. You only have 30 minutes to make changes. Click the edit button to make changes Brother. If you go to advance like you were adding an image, you just select the image you want to delete, and then click on the x for that image. It's in the top right corner of the image and you will then getting a warning and you just continue with deleting it.

Just delete all of the comments and put deleted.
 
Last edited:
Update:

The $30.64 marker on the GDX chart held last week, and we got a lower high of $30.85.

The post should have read - "a higher low of $30.85."
 

Attachments

  • a.jpg
    a.jpg
    54.1 KB · Views: 48
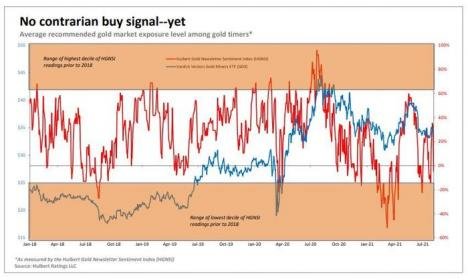
Some opinions on Sentiment and some rambling from me about other indicators: I DO NOT trade or take positions based on Sentiment. However, I use it sometimes to help me determine position size, but lean more toward cycles for that data. Are we deep into the weekly gold/miners cycle or just starting a new one? That is a very important indicator I like to use. Different tools for different folks. I have found sentiment hasn't worked well in a market like this one. LOL... In the stock market for sure.

Market Watch - Note that on BOTH or these articles from a so called Sentiment Expert they both start with opinion. He is good at what he does, but this market hasn't cared much about sentiment. As I always like to say after posting my data, links or charts - NO ONE EVER KNOWS for sure. Especially in the metals/miner sector.
Opinion: American consumers’ gray mood could put the S&P 500 in the green over the next 6 months
Last Updated: Aug. 21, 2021 at 9:33 a.m. ET
First Published: Aug. 17, 2021 at 7:10 a.m. ET

https://www.marketwatch.com/story/a...r-the-next-6-months-11629181914?mod=home-page

Mark Hulbert
Opinion: As gold prices fall, there’s still not enough gloom to trigger a buy signal
Last Updated: Aug. 14, 2021 at 9:40 a.m. ET
First Published: Aug. 9, 2021 at 1:54 p.m. ET

The chart I posted below is from Mark and is part of his sentiment tools he uses for buy and sell signals. Many like to use the COT, but I don't use them as much as I use to anymore.
https://www.marketwatch.com/story/a...ugh-gloom-to-trigger-a-buy-signal-11628531667


However, I do track this guy because he provides above average info about the COT.

Gold Mid-Tiers' Q2'21 Fundamentals
Aug. 21, 2021 1:57 AM ETVanEck Vectors Junior Gold Miners ETF (GDXJ)6 Comments11 Likes

321gold: Adam Hamilton archives
https://seekingalpha.com/article/44...k-0&utm_medium=email&utm_source=seeking_alpha

I'm still a sub with Kaplan and he provides me with some of that data I like to use. He has two weekly Zoom Meetings for his subs and answers most question in the chat room. I still track Fund flows, and insider data which he normally talks about weekly. Some indicators I don't have to look up.

https://twitter.com/TrueContrarian
https://truecontrarian-sjk.blogspot.com/

In a bear market, gold mining shares tend to be among the earliest sectors to complete their bottoming patterns.
Not many investors pay attention to precious metals and their producers, but funds including GDX and GDXJ had completed 7-1/2-year peaks on August 5, 2020, and entered downtrends which persisted for more than one year. During the 2000-2002 bear market, gold mining shares (see HUI) were among the earliest assets to complete their lows on November 15-16, 2000, almost two years ahead of the Nasdaq's October 10, 2002 nadir. Gold mining shares (GDX) later completed an important bottom near the opening bell on October 24, 2008, while the S&P 500 didn't complete its final 666.79 low until March 6, 2009. Last year, both GDX and GDXJ had bottomed on March 13-16, 2020, while most U.S. equities touched their lowest points on March 23, 2020. It is likely that the corrections for GDX and GDXJ, whether they are complete or not, will be followed over the next several months by key intermediate-term bottoms for nearly all equity sectors.

Kaplan

https://seekingalpha.com/article/4450037-bearish-rotation

The bottom line: we have a sector rotation for U.S. equities which closely resembles the early months of several past severe bear markets. Good bargains will tend to occur earliest for those sectors which tend to bottom first, including gold mining and silver mining shares. Caution is warranted since the initial decline is often roughly half of the total bear-market loss and because U.S. stock-market valuations overall have never been higher. Near all 2021 peaks we have experienced both aggressive insider selling relative to insider buying along with all-time record equity fund net inflows, thereby confirming that the risk of being heavily invested today is highest when it is widely perceived to be lowest.

Kaplan


https://truecontrarian-sjk.blogspot.com/
 

Attachments

  • a.jpg
    a.jpg
    23 KB · Views: 45
Last edited:
https://www.bloomberg.com/news/articles/2021-08-21/yellen-said-to-back-jerome-powell-reappointment-for-fed-chair?cmpid=socialflow-twitter-business&utm_campaign=socialflow-organic&utm_content=business&utm_medium=social&utm_source=twitter

This removes some uncertainty about future Fed policy.

Aha, figured out how to delete attachments. Click manage attachments, hover over the image and click X. Still trying to figure out how to delete a post.

One thing is for sure..... The folks in charge DO NOT want the stock market moving lower before the 2022 midterm elections. Please DO NOT make ANY political comments in this thread about red or blue politicians, and which ones are correct. My point is the Fed will TRY and keep the markets happy until that cycle has completed. I don't care who wins as it's all noise to me and I just trade the trend - Up or down!
 
For the record: How I'm trading now is much different from how I use to trade. I have to trade in the current market based on what I'm seeing in real time. I have added many new tools in this market, because some of the old ones just didn't work well anymore. Maybe that will change in the months ahead. If it does then I will too change again I as my old tools remain in my tool box. Trend trading doesn't always work well. But this market is just BTD and watch some indexes like the SPY move higher. That hasn't worked well for IWM and I trade that different. I'm talking about VTI and SPY indexes which many like to call the stock markek.

I trade what I see happening, and not what I think will happen. I went to trend trading and ignored many other indicators because of the current move the market has made since the 2020 low..... LOL..... The weekly Bull Train just keeps moving along......

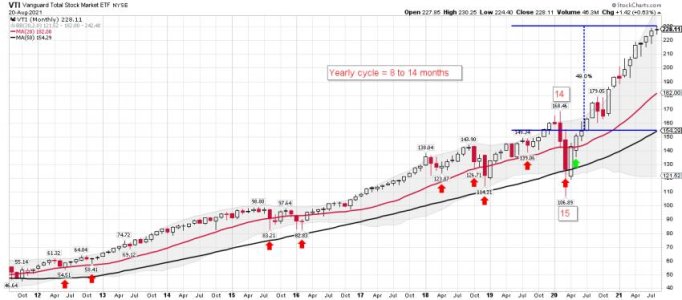
I posted the monthly Total Stock Market chart below to support my comments above: The trend remains up and continues on..... Are you currently on the train? I'm flat stocks and was trading SDS last week. Not sure when I will go long again.

We have all seen this image before even though many are currently worried about the value of the SPY. However, the money flow tells the real story. Money continues to flow into stocks at record levels.
 

Attachments

  • a.jpg
    a.jpg
    52.3 KB · Views: 48
  • a.jpg
    a.jpg
    78 KB · Views: 47
Last edited:
A few folks I follow on twitter:

xTrends
@xtrends

22h
There is a reason most idiots make great money 80% of the time by just following simple big trends. But the problem with this group is, they dont know where to stop and manage risk, usually one market crash in the remaining 20% of the time wipe them out.
https://twitter.com/xtrends?ref_src=twsrc^google|twcamp^serp|twgr^author


@TrueContrarian
True Contrarian identifies the most unanimous consensus in the financial markets, then goes in the exact opposite direction of that consensus.
ManhattanTrueContrarian.comJoined August 2009

True Contrarian’s Tweets
True Contrarian
@TrueContrarian

Aug 20
“It’s not always easy to do what’s not popular, but that’s where you make your money.” --John Neff. see this quote and my own analyses in my latest post, True Contrarian by Steven Jon Kaplan
https://twitter.com/TrueContrarian

SevenSentinels
@SevenSentinels

Aug 21
The McClellan Summation Index For The NYSE Dropped Into NEGATIVE Ground Friday.

thomas
@VolumeDynamics
·
Aug 21
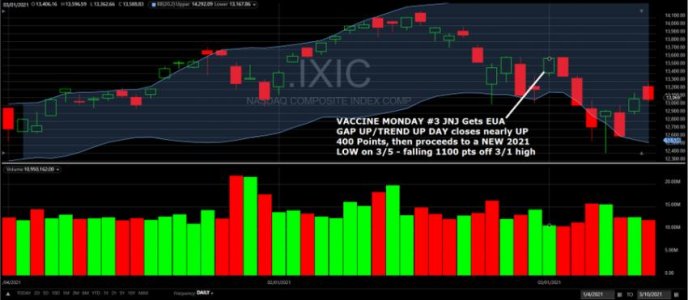
Snatching DEFEAT from the Hands of Victory... VACCINE MONDAY #3 which led to DISASTER..
https://twitter.com/VolumeDynamics
SentimenTrader Retweeted
Jay Kaeppel
@jaykaeppel
·
Aug 9
"The trend is your friend." BUT not everyone plays that game. Some seek to profit from the inevitable reversals. And some perform exceptionally well. But it takes a certain mindset to do so. Read this short piece to see if you have what it takes.
https://twitter.com/SentimenTrader

David Rosenberg
@EconguyRosie
·
Aug 19
Bob Farrell’s Rule #9: “When all the experts and forecasts agree — something else is going to happen.” In other words, this risk-off trade is not about the taper as everyone is saying. It’s something else. Try Delta.
https://twitter.com/EconguyRosie?lang=en
 

Attachments

  • a.jpg
    a.jpg
    49.3 KB · Views: 46
Yes Sir: Lots of warnings signs/indicators out there telling us to stay nimble and trade small. Well, that is what I'm doing.


Flashing red
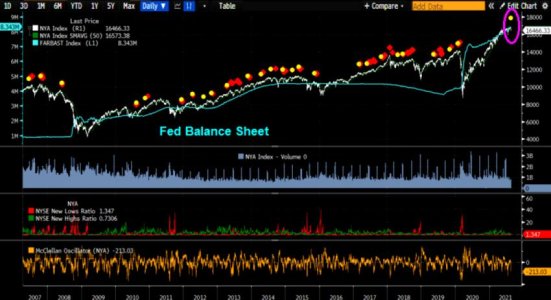
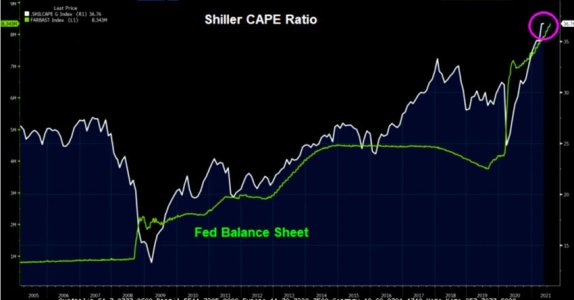
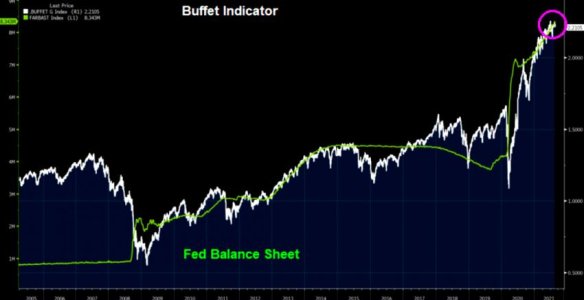
Last week the Hindenburg omen started flashing red. Add the Shiller CAPE indicator as well as the Buffett indicator to the red flashing indicators.

The theme of the past week was the extremely stressed VIX market (here). Given the above mentioned indicators flashing red and Jackson Hole approaching, VIX will most probably remain stressed.

Let´s see if vol opportunities will arise the closer we move to the Jackson Hole event.
https://themarketear.com/
 

Attachments

  • a.jpg
    a.jpg
    58 KB · Views: 54
  • a.jpg
    a.jpg
    33.4 KB · Views: 55
  • a.jpg
    a.jpg
    30.5 KB · Views: 54
If you track the Moon Beams/Cycles and the planets here is some data from BluStar..... I say we shall see, and I don't trade using this data, but read over it when he posts it for free.

In case you haven't heard of it here is a link. LOL.... Also, watch out for the werewolfs. I will be wearing my hat next week to ensure I'm protected.
Moon cycles in the markets
Lunar Phases

Several studies found a connection between full and new Moons and stock market performance. Generally, stocks tend to perform better in the days around the New Moon, while price weakness is more frequently seen in the days around Full Moon. It was also observed that major market crashes have a history of happening about 3 days before a New Moon, typically in 8th or 9th lunar month in the Chinese lunar calendar ( = September or October).

Based on research of stock market data since 1950, we have identified a “Lunar green period”, when stocks tend to do better than average, and a “Lunar red period”, when stocks generally underperform. Green periods start about 3 days after Full Moon, and red periods begin about 3 days after New Moon. The outperformance in green periods is significant, as you can see in this chart (1950 – 2009):


https://lunatictrader.com/moon-cycles-in-the-markets/


A Blustar comment/call.
Posted 20 August 2021 - 01:26 PM

We are short SPX like there is no tomorrow as today's rally has B Wave written all over it! GDX looks to have bottomed and could gap up Monday. I have the next cycle low being Aug 24/25. Could see an 8 to 9% drop next week easily, maybe even 11 to 12%. Something is up with the astros:


Uranus > Rx last night with Jupiter Rx opposing the Sun and WED nights Mer/Mars conj and the full moon conj Jupiter on the 22nd. Bradley turn = Aug 20/22 Geo/Helio. Then Mars and Venus form a Trine/BiQ topping combo to the Saturn Rx/Uranus Rx square Sunday and Monday, plus we are in a 4 TD top.


The next Bradley is Aug 25 Geo. Uranus Rx with the Venus/Mars topping signatures to the Sat/Ura sq. and Jupiter Rx opposing the sun conj the full moon this weekend. Lordy!!

The 4 hr and daily stochs still negative/pointing down, the weekly and monthly STOCH are down. The weekly MACD negative. We also had an A/D failure plus major intermarket divergences!


We short, we short!!

https://www.traders-talk.com/mb2/index.php?/topic/175701-looks-like-a-b-wave-bounce-to-me/
 

Attachments

  • a.jpg
    a.jpg
    82.5 KB · Views: 55
  • a.jpg
    a.jpg
    60.5 KB · Views: 54
Last edited:
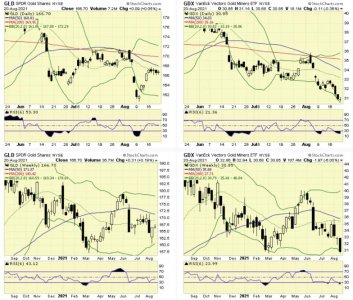
Buying GDX in the pre-market.

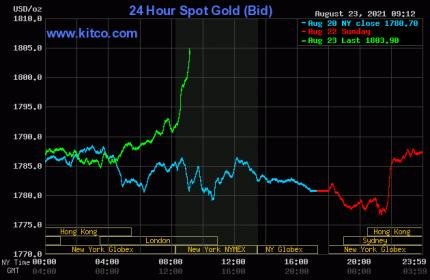
Should have daily swing low on GLD and GDX today. I really wanted to see a lower low this week so the weekly swing would be easier to complete but Kaplan turning dovish and Yellen endorsing Powell over the weekend may have killed that option.

swing low.jpg

Keeping a close eye on GDX as it is still a little early for a gold DCL and the downward sloping 200 DMA is near. Want to have something in case the 200 DMA is just a speed bump.

cycle.png

Somebody thinks they know something.

gold.jpg
 
Last edited:
Red,

Something to watch closer based on this dollar data.
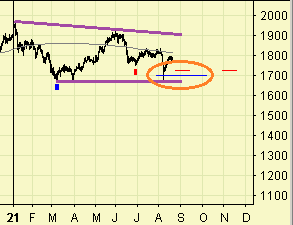
Long - GDXJ and EQX I have NO IDEA how this will play out, but I'm still trading from the long side using a small position. We all wait on the next weekly cycle low....

Bottom Line: GDXJ, GDX and EQX all remain in a downtrend on the weekly chart. GDX still holding above the $30.64 marker - the March low. Also, Kaplan can be waaaay early Brother, and is NOT a trader. I remain a sub, but one must be careful to follow him when he starts buying. His average share price for GDXJ is around $43.00. That's ok for folks wanting to hold for months and don't mind adding on the way down if GDXJ goes down to $30.00.

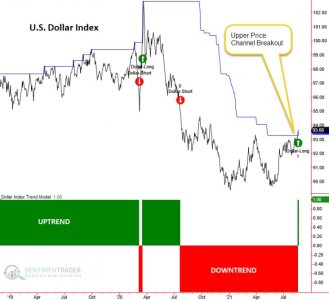
The World's Reserve Currency Just Triggered a Buy Signal
Jason Goepfert

Published: 2021-08-23 at 07:30:00 CDT
The dollar has broken out, and history suggests it will keep going.

The trend following system that Dean uses for the Dollar Index (DXY) is a straightforward one. It's the price channel breakout system created by Richard Donchian, the father of trend following. The original concept became the foundation on which later trend followers like Richard Dennis and the turtles used to capture significant price trends.

A new uptrend was established late last week when the Dollar Index closed above the 133-day price channel high.
Using this system, there have been 23 breakouts in the dollar over the past 50 years. Taking an in-depth look at results going forward, the dollar's returns were solid across all timeframes with several notable z-scores.

Commodity returns look anemic. When the dollar strengthens, commodities generally struggle. That's also why gold returns look weak across the board.
https://www.sentimentrader.com/blog...l&utm_term=0_1c93760246-3f54b21e17-1271291994
 

Attachments

  • a.jpg
    a.jpg
    44.9 KB · Views: 49
  • a.jpg
    a.jpg
    55 KB · Views: 47
  • a.jpg
    a.jpg
    54.1 KB · Views: 48
Last edited:
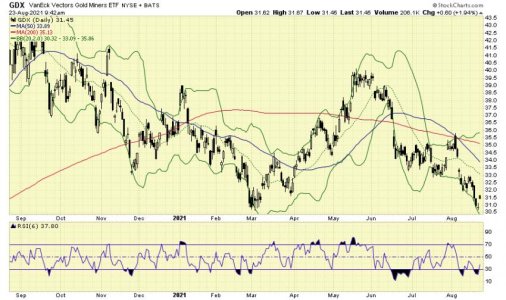
Stopped out for a couple hundred dollar profit. Opening gap fill? Historically I get too fancy trading bottoms and end up missing the boat. Posted so people would look at the charts in case something real was happening.

gdx.jpg
 
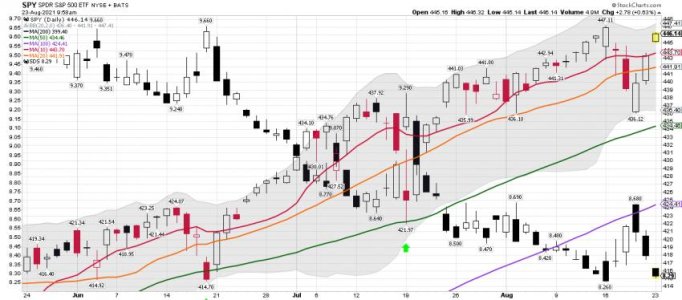
SPY daily: So we start out with a gap up.... LOL.... It's "Easy Money Monday" folks what did you expect. Hmmmmmm.... So is this a rare 5th daily cycle..... We shall see how this plays out.

Red,

I took a small position of SDS and keeping all trades small.

Long - GDXJ, EQX, and SDS...

Good Trading Brother!
 

Attachments

  • a.jpg
    a.jpg
    63.3 KB · Views: 44
  • a.jpg
    a.jpg
    57.3 KB · Views: 44
Red,

Heading out..... We shall see if the Bulls or the Bears are right about the miners..... Waiting on the next weekly cycle low for the miners, and from what price is STBD.

Will the GDX gap up hold into the close? We wait....
 

Attachments

  • a.jpg
    a.jpg
    54.3 KB · Views: 49
Back
Top