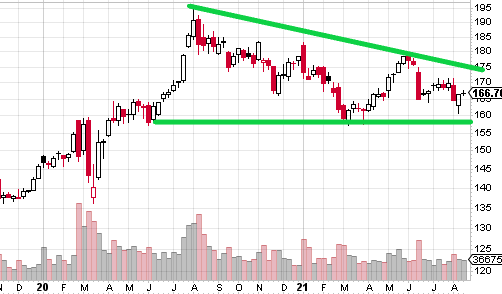
Bear Cave 2 (Bull Allowed)

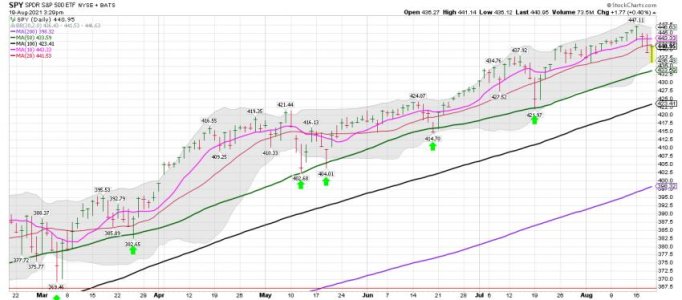
Ok, they be buying the SPY as we head into the close.... You buy going into Friday for Easy Money Monday. We also have the free lunch during OPtx week... We shall see how it all plays out. If it doesn't close back above those ma's I will hold my SDS position. The weekly (MT positions) remains on a hold long positions.

SPY daily: Still under the 10 and 20 dma, but with 30 minutes to go anything can happen.
https://stockcharts.com/h-sc/ui?s=SPY&p=D&yr=0&mn=4&dy=0&id=p18478397494&a=1012298215
 

Attachments

  • a.jpg
    a.jpg
    57.1 KB · Views: 57
Last edited:
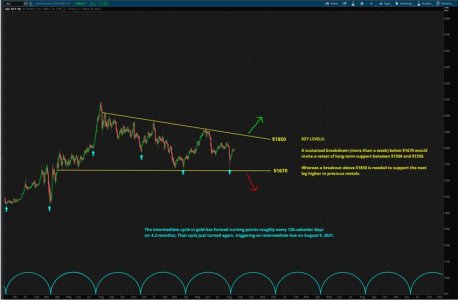
The intermediate cycle in gold (chart below) has formed turning points roughly every 128-calendar days (4.2-months). That cycle just turned again, triggering an intermediate low on August 9, 2021. Gold must now stay above that low to prevent a breakdown to the $1500 to $1550 area.

https://goldpredict.com/archives/31237

cycle.jpg

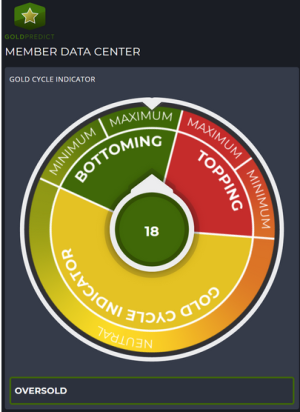
Our Gold Cycle Indicator hit ZERO on Tuesday (8/10/2021), triggering a Portfolio Buy Signal. Currently, the GCI is sitting at 18.

https://goldpredict.com/archives/31166

indicator.PNG

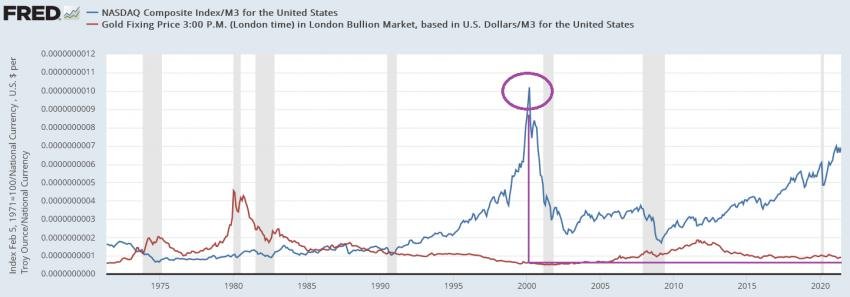
Stocks/M3 could go even higher. Gold/M3 could go even lower. Place your bets.

m3.jpg

I still think the Fed is a paper tiger that will growl about tightening until the election (or at least until Powell is nominated for another term) but will always find a reason to delay it.

tiger.jpg

Jay Powell is no Paul Volcker.

real tiger.jpg

P.S. You know the big players are eyeing $1670. Breaking that would frighten everyone out of gold so they can close their shorts and go the other way.
 
Last edited:
LOL..... Just BTD!


Buy The Dip for the Free lunch tomorrow, and then we have Easy Money Monday.

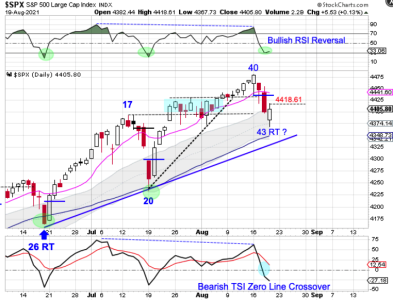
Stocks formed a bullish reversal on Thursday.

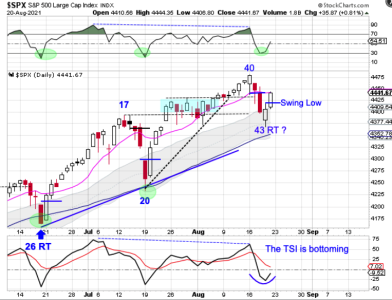
Stocks printed their lowest point on Thursday, following the day 40 peak. Thursday was day 43, placing stocks in their timing and for a DCL. Thursday’s bullish reversal eases the parameters for forming a swing low. A break above 4418.61 will form a swing low. Then a close back above the 10 day MA will signal a new daily cycle. Stocks are currently in a daily uptrend. If stocks form a swing low above the lower daily cycle band then they will remain in their daily uptrend and trigger a cycle band buy signal.

https://likesmoneycycletrading.wordpress.com/author/likesmoneystudies/

In other new/tweets....
One of these days....Hmmmmmm


thomas
@VolumeDynamics

Welp, one of these days, maybe even sooner than we think... $DJIA going to be down 1000 points...

https://twitter.com/VolumeDynamics
 

Attachments

  • a.png
    a.png
    140.1 KB · Views: 48
LOL..... Yes Sir - Never forget the buybacks is right - as insiders continue to sell their shares.

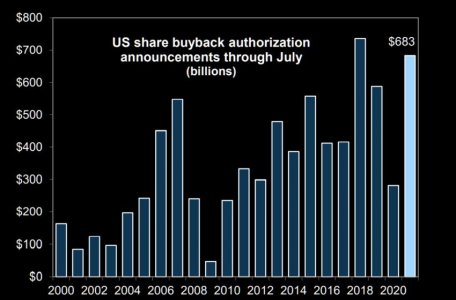
Never forget the buybacks...
Buyback authorizations have surged YTD. Several large-caps have announced new programs (AAPL $90bn, GOOGL $50bn. The bid will be there (almost) every day....
 

Attachments

  • a.jpg
    a.jpg
    55.8 KB · Views: 47
Bearish outlook for gold given the weakness in miners. Rather complicated so I'll have to read it again when I am not tired.

https://www.sunshineprofits.com/gold-silver/gold-trading/ignorance-always-backfires-pay-attention-to-gold-miners/

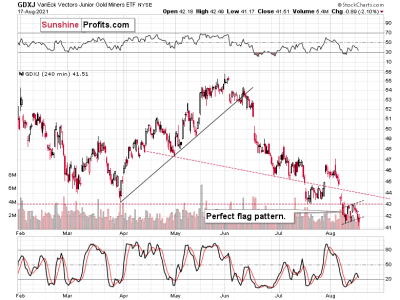
Juniors, as well as senior mining stocks, are very weak compared to gold, which means that they are not reacting to gold’s gains but multiplying gold’s declines instead. This doesn’t just mean that the profits on our short positions in juniors are increasing almost constantly – it also means that the entire precious metals sector is about to fall much further. This kind of underperformance preceded the 2013 slide, and we haven’t seen it – to this extent – in years. This is huge.

flag.png

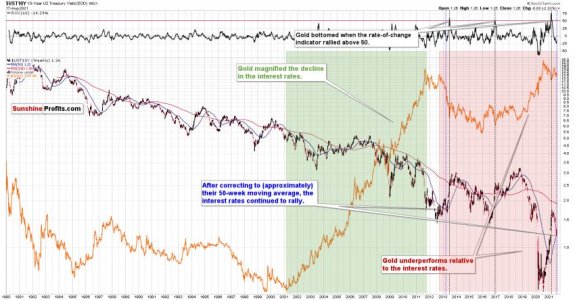
As I described in my previous gold trading analyses, what we are seeing now in gold is very similar to what we saw in 2012-2013, and the above-mentioned super-weak performance of gold stocks confirms it.

roc.jpg

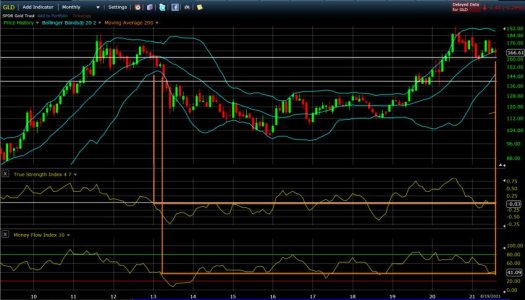
Here is a monthly gold chart for reference. Yes, it could happen but what is the trigger?

monthly.jpg

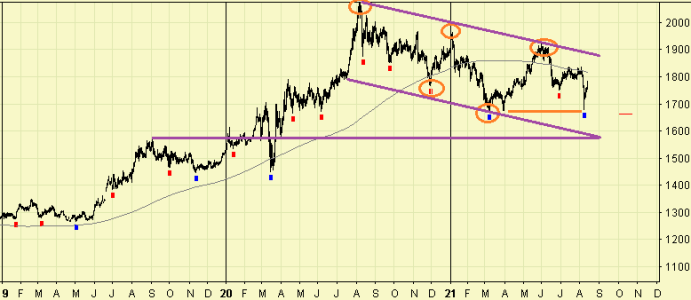
Ah, I thought of something. Gold is in a downward channel (lower highs and lower lows) which everyone is watching. If it breaks 1670 then many would sell because the 200 DMA is sloping down and the channel target/support is $100 lower. Fall is usually when liquidity crises show up and the Reverse Repo is hovering around one trillion with some analysts expecting it to reach two trillion. Maybe somebody goes bankrupt and we get a big flush this Fall (or the Fed really does taper).

channel.png
 
Last edited:
Red,

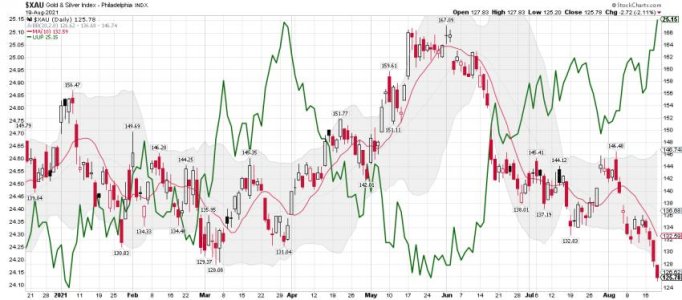
Odds increasing for a cycle low for gold/silver/miners in the next few weeks, and a possible top for the dollar.

XAU/UUP daily chart: Gold/Silver is getting closer to an ICL based on the cycle data.
 

Attachments

  • a.jpg
    a.jpg
    61.7 KB · Views: 52
Last edited:
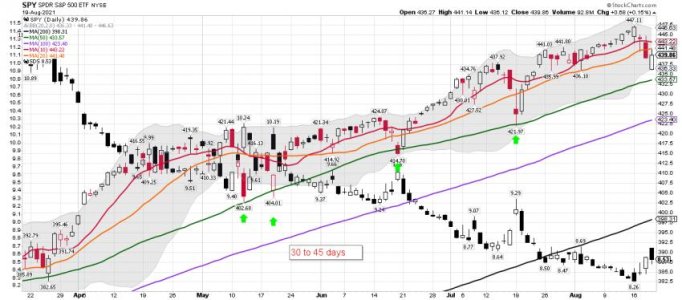
SPY daily: Is the move lower for the SPY about over and it's a 1/2 cycle low? Still holding 1/2 of my SDS position, but the pattern is clear as we get close to tagging the 50 dma. Will it repeat?

I sold 1/2 of my SDS yesterday after the SPY tagged the lower BB.
 

Attachments

  • a.jpg
    a.jpg
    63.7 KB · Views: 52
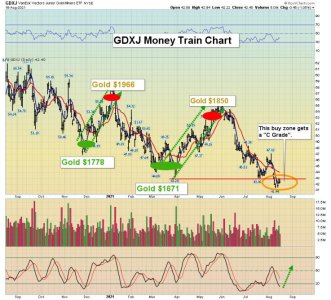
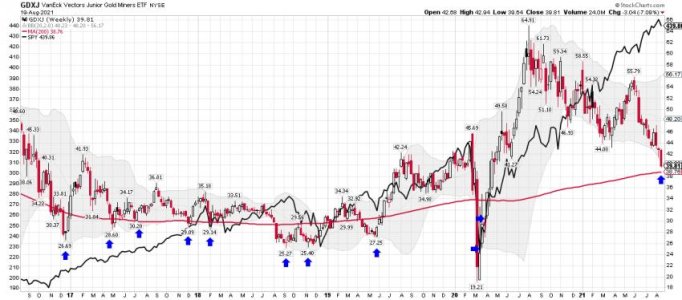
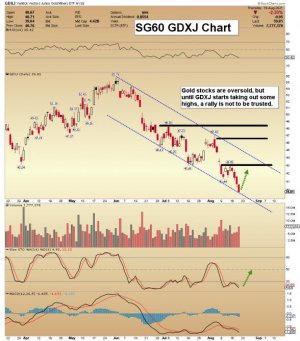
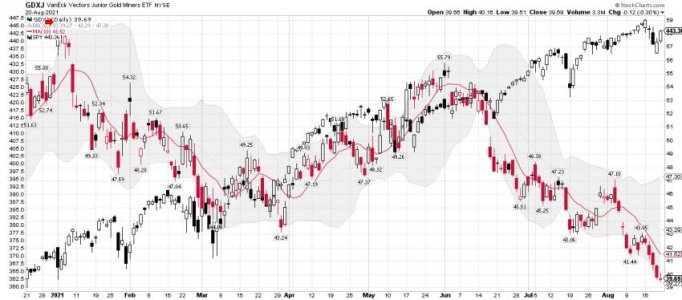
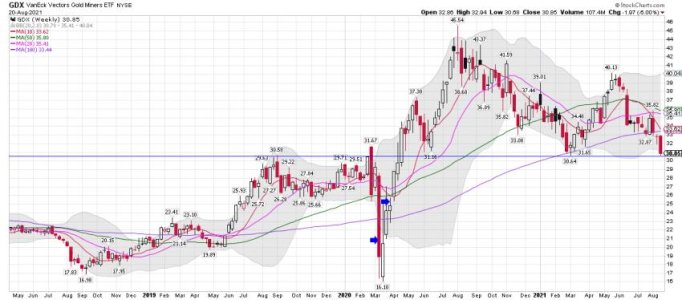
GDXJ weekly: An undercut or a tag of the 200 week moving average (200 WMA thick red line) for GDXJ has been normal during these deep sell-offs. We are getting closer to a possible ICL. LOL.... that is a guess based on the pattern, but these patterns often repeat and can be used for monitoring. Still some gaps much lower for the miners that could be filled if stocks sell-off hard.

Notice how the SPY and GDXJ bottomed close together during the 2020 March smash. You have heard of the baby and the bath water. Nothing says that can't happen again if the SPY sold off hard. Also notice the current huge divergence between the two. That WILL correct ""someday""' and it could be this year. LOL.... That's a guess based on how deep we are in the current yearly cycle for stocks.

Is this move down for the miners a warning indicator for stocks? We shall see....
 

Attachments

  • a.jpg
    a.jpg
    61.6 KB · Views: 50
  • a.jpg
    a.jpg
    6.6 KB · Views: 50
A Shocking Update on Sentiment
Politics is playing havoc with how people are feeling about everyday life, and it's even overriding how they usually feel about topics that aren't necessarily as influenced by our representatives.

Jason Goepfert
Published: 2021-08-20

The preliminary Consumer Sentiment survey for August by the University of Michigan showed a stunning drop. Not only is the survey relatively low, it was the biggest miss in 20 years relative to economists' expectations. Granted, this could change substantially by the time the official reading is released in a couple of weeks.

This is an abnormally low reading given how the S&P 500 has fared over the past year. There is a positive correlation between the 12-month rate of change in the S&P and the Consumer Sentiment readings, and this month really stands out as an outlier.
https://www.sentimentrader.com/blog...l&utm_term=0_1c93760246-caf001c342-1271291994
 
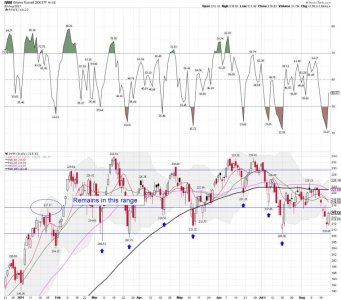
IWM daily: Remains Fughly! BTD if you are trading the trading range..... The BB trade has been ok for a trade - if you bought the lower BB tags and sold the upper BB tags.

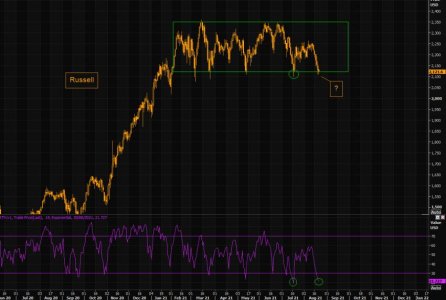
Russell's RSI
Last time Russell futs traded in the lower part of the range and RSI was this low, small caps decided reversing violently higher.

Is this time different, or do you buy the dip?
 

Attachments

  • a.jpg
    a.jpg
    58.4 KB · Views: 42
  • a.jpg
    a.jpg
    84 KB · Views: 42
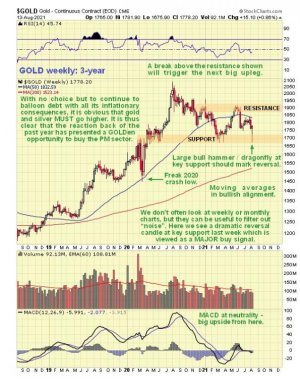
Gold bulls say that gold's corrective phase is over and it will rise to new all-time highs.

https://www.clivemaund.com/gmu.php?art_id=68&date=2021-08-14
bull.jpg

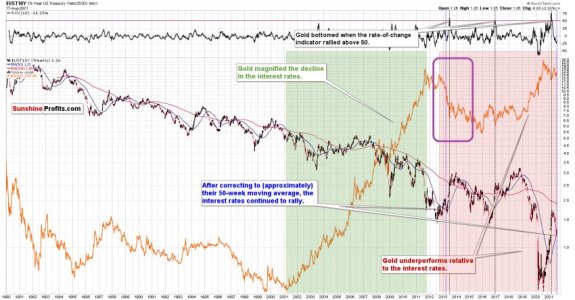
Gold bears say that gold is setting up for a drop similar to 2013.

https://www.sunshineprofits.com/gold-silver/gold-trading/ignorance-always-backfires-pay-attention-to-gold-miners/
bear.jpg

I was leaning towards the bear case given the Fed's taper talk until Kaplan turned dovish today. I expected them to talk tough at least until Jackson Hole. I think a gold crash is off the table.

fed.jpg

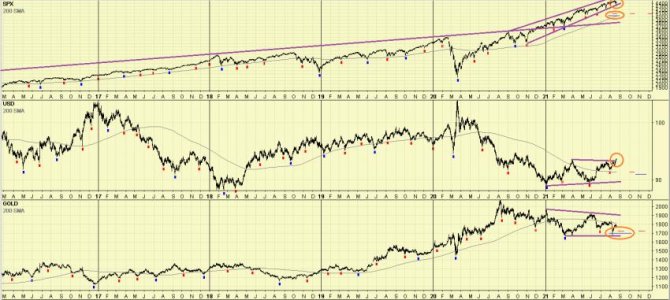
My cycle chart.
SPX 200 DMA is up and stocks are close to breaking down from a rising wedge. DCL/ICL due now. Buy the dip.
USD 200 DMA is turning up and the dollar broke above the previous high. Another week or two to the peak.
Gold 200 DMA is turning down. DCL/ICL due over the next two weeks. Buy the dip.
$cycles$.jpg

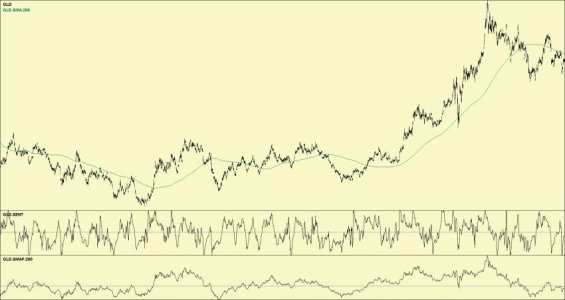
GLD sentiment and SMA Percent is neutral so I don't see an extreme that can lead to a big move.
GLD.jpg

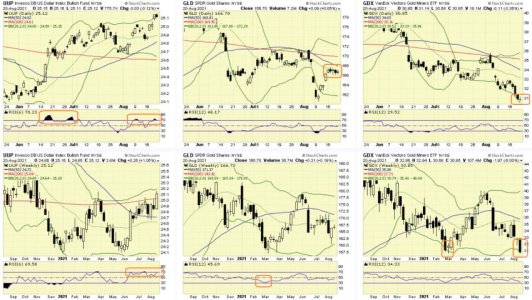
Daily/Weekly chart.
UUP is embedded (trend).
GLD is stuck on the 20 DMA.
GDX has a daily indecision candle but needs a lower low next week to setup an easier weekly turn.
dw.jpg

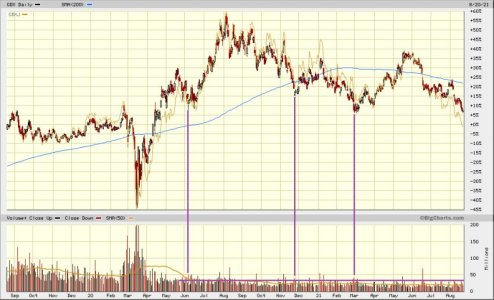
I looked at which mining ETF I want to buy. GDXJ is lagging GDX but should outperform once we get an ICL. Volume is not high enough for a serious low (yet).
lag.jpg

So what is my plan?

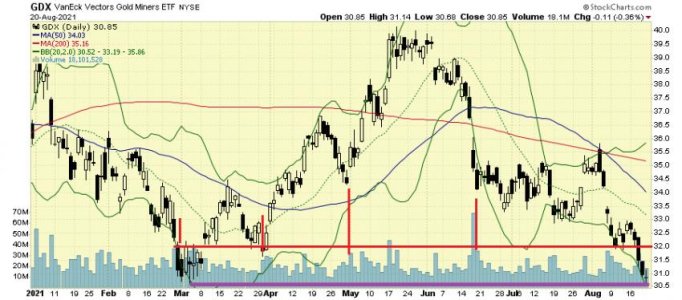
I am looking for a cup and handle and need to watch for a cycle low over the next two weeks using short-term indicators. Accumulating GDX, preferably on a high volume flush that breaks below 30.6. I really want to see the gap at 27 filled which could happen if stocks get a real ICL. But will that happen with the Fed walking back tapering before even talking about it in an FOMC announcement. If I end up buying too early then I have the option of switching to GDXJ for more leverage.
gdx.jpg

This post took way more time than I expected (3 hours). I hit the image limit. Couldn't delete the extra images. When creating a copy of my post I kept getting stretched links in my pasted text. Also, the images are compressed and blurry which makes my eyes tired. It would be nice if I could submit a Wordpad document with text and images that is turned into a post.

Also I really should be adding features to my charting program so I can analyze stocks faster instead of struggling with forum software. Smash that like button if you want to encourage me to put my programming hat back on.

smash.jpg
 
Nice charts Brother. Next week we could see some action in the stock market. LOL.... I hear you on the Gold Bull/Bear debate. I have NO IDEA what will happen next, but I will keep adding small positions while I wait for the next ICL.

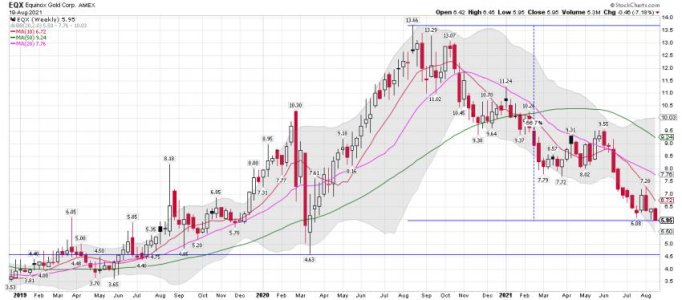
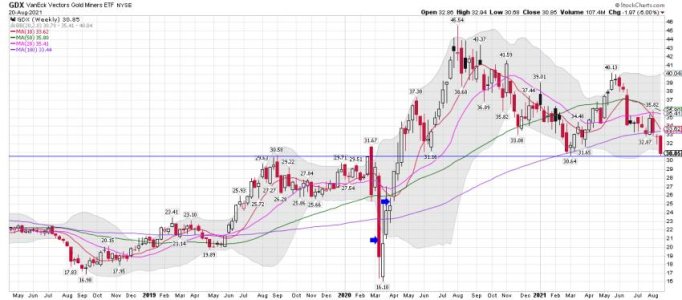
I remain long GDXJ and EQX. My average share prices for both are fairly close to where we are now. I'm with you on those GDX weekly gaps. Will they fill before we get an ICL. We shall see if GDX moves that low before some big players come in buy shares. For now the marker at $30.64 held and we have a higher low. However, it could still get smashed lower next week. I don't know what will happen next, but I wait for a confirmed ICL to take a larger miner position. You just never know in this sector..... Waiting to get the climbers next update, and I have also been tracking Bob Loukas.
https://thefinancialtap.com/free-blog/

Take Care!
 

Attachments

  • a.jpg
    a.jpg
    58.9 KB · Views: 40
Last edited:
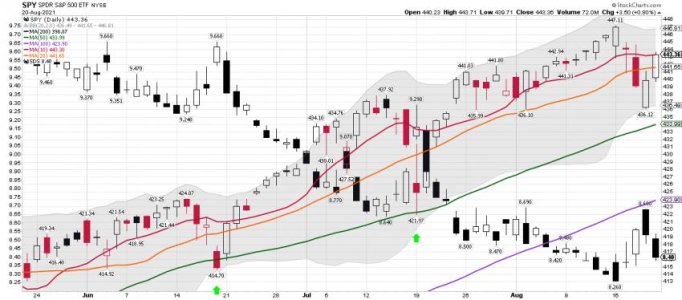
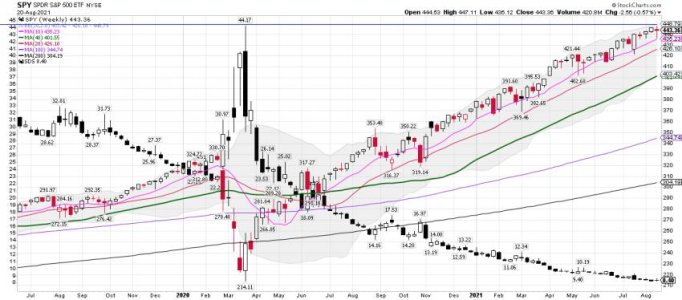
SPY daily: A cycle low and a move back to the 10 dma based on the cycle data...... LOL..... I made a few bucks on my SDS trade using the daily data, but the weekly remains in a uptrend. We shall see how next week plays out. In the old days the week after OPTX would come under some selling pressure. But this is not the market of the old days.

SPX daily cycle data:
SPY daily:
SPY weekly:
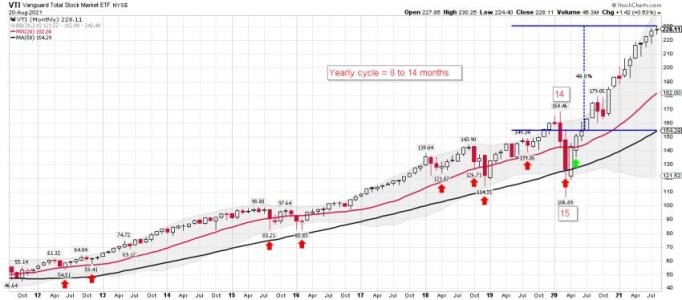
VTI monthly: The total stock market - The trend remains up, but stretched above the mean, and getting deeper into the yearly cycle.


Bottom Line: Still no ICL for SPY, and it looks like the start of a new daily cycle based on the cycle data.

Stocks formed a swing low on Friday.

Stocks printed their lowest point on Thursday, day 43, to place stocks right in the heart of its timing band for a daily cycle low. A close above the 10 day MA will signal the new daily cycle. Stocks are currently in a daily uptrend. Forming a swing low above the lower daily cycle band indicates that stocks will remain in their daily uptrend and triggers a cycle band buy signal.
https://likesmoneycycletrading.wordpress.com/2021/08/21/the-8-21-21-weekend-report-preview/
 

Attachments

  • a.png
    a.png
    134.7 KB · Views: 41
  • a.jpg
    a.jpg
    62.6 KB · Views: 39
  • a.jpg
    a.jpg
    62.4 KB · Views: 38
  • a.jpg
    a.jpg
    52.3 KB · Views: 39
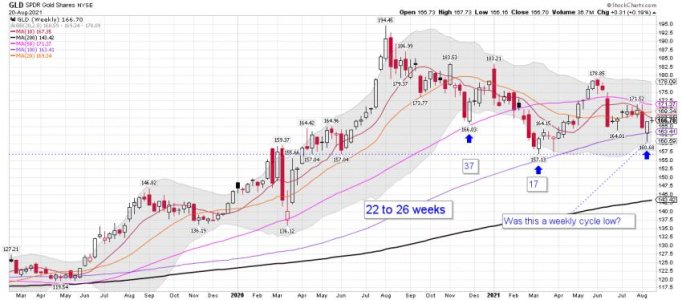
GLD weekly data and the next weekly cycle low: The markers I'm watching.....157.04, 157.04, 157.13, 160.68 and a tag of the 100 wma. Are they support? It depends on who you ask. We shall see in the weeks ahead if we move lower or maybe the 100 wma holds. Sorry, but I don't know. Bulls are getting excited as they always do and Bears are talking about us moving much lower.

Bottom Line: We are getting closer to a weekly cycle low, but nothing has been confirmed yet! Traders continue to point out those gaps on the GDX weekly chart that could fill. Well, they could!
 

Attachments

  • a.jpg
    a.jpg
    60.4 KB · Views: 35
  • a.jpg
    a.jpg
    58.9 KB · Views: 35
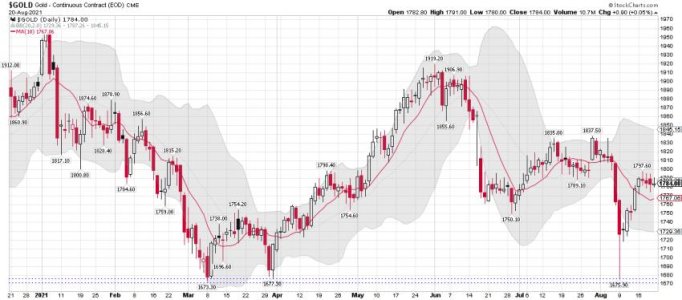
Gold Weekly:
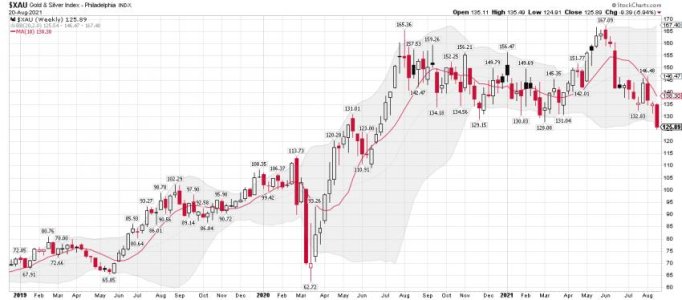
XAU Weekly:
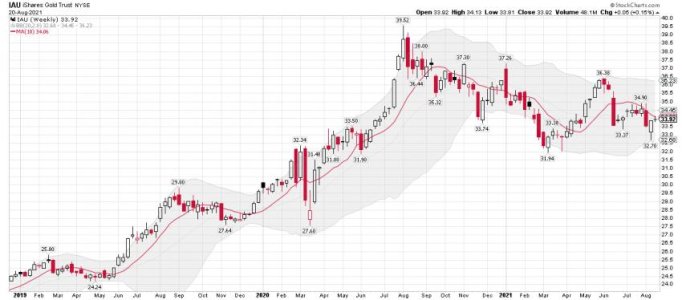
IAUWeekly:
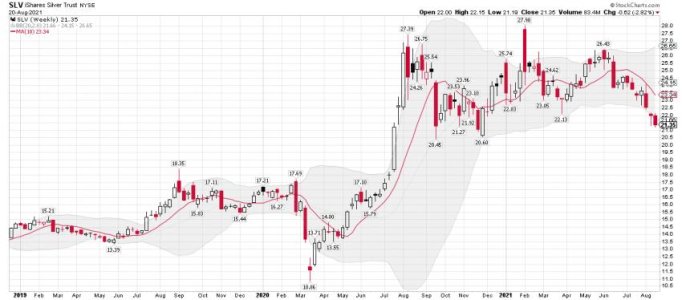
SLV weekly:
Lots of opinions at the link below, Bullish and Bearish about what gold will do next. I try not to post links from 321 gold. Some dudes over there are waaaay out in left field in my opinion. These articles are more professional me thinks.
https://seekingalpha.com/market-outlook/gold-and-precious-metals
 

Attachments

  • a.jpg
    a.jpg
    59 KB · Views: 34
  • a.jpg
    a.jpg
    52 KB · Views: 34
  • a.jpg
    a.jpg
    49.9 KB · Views: 34
  • a.jpg
    a.jpg
    52.5 KB · Views: 33
Last edited:
I don't see many mentions about the multi-month bull flag/pennant in gold (GLD). Maybe people are just tired of talking about it, but it's still intact. Upside would be well into new high territory.

glde334.png
 
Back
Top