Uptrend's Account Talk

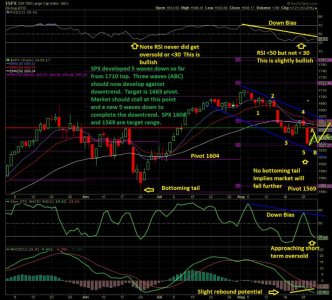
Oops!! Since the SPX price fell below and closed below 1632, the hourly chart has now morphed into a downward sloping channel as shown below. All other patterns are nixed and thrown out the window. That is sometimes the way it is with TA, revise, revise and revise. Some of my model info suggests that the move from 1710 is either halfway over or a little more. The target area for a major reversal is now somewhere between 1570 and 1604. The 1600 area is also a heavy price by volume area, and a 61.8% Fibonacci retracement from the April low, which may give this area extra weight. So don't rush out and buy much right now. Patience is key to investing (and I had to learn this the hard way!). The CNBC talking heads are using the Syrian crisis as an excuse for selling, but I saw this coming last week, and sold all my long positions. Sometimes the market just needs a little push to go over the edge. We could have a "dead cat" type bounce here, but I don't expect much more than 15 points; perhaps to the 1645 to 1649 area tops, and then continue on the free fall to more major support. If you find yourself somehow holding the bag; get out on the next tiny push up. You just can't argue with channels. They go up and they go down. My nonstop trend model continues on the sidelines: please review my post #2872. There have been five previous buy signals this year, and after this carnage is over, there will be another one. Polish your G money in the meantime. View attachment 25039


So far this is dead on! Great job!
 
So far this is dead on! Great job!
Here is a chart with some new ramblings. Also read my blog today for an ominous sign! I believe a rebound is in order. However, my nonstop trend model has not committed to this premise, and it is straddling the fence. The NYSE is ahead of the NASDAQ for the buy trigger. It is a day by day thing; so I will know after the close tomorrow if we have a short term buy, or not. Between cycle theory (in my blog) and what you see on this chart, it appears that a two week uptrend may develop at this time. Market action tomorrow (Friday)should better frame this idea. Don't expect me to post this much info every day, as it is a lot of work.SPX map 08_29_13.jpg
 
There is no change. My nonstop model sits on the sidelines out of the market and is still pointing down , but at a slower rate of change. There is still a decent chance for a reversal in the next several trading days, but less so after that. Meanwhile, sentiment (the way I figure it), is still too bullish (bearish for stocks). The US dollar is close to being in a confirmed uptrend, if not there already. Theoretically, this should be bearish for gold, but other factors are at play, such as demand for physical gold, relative to supply, and a war-time uncertainty. It will be interesting to see if gold can stay above $1400. The rising dollar will put a headwind into stocks. A Fed announcement at their next meeting in September putting a delay in tapering could cause a dollar reversal, and stocks to change course. I think, in part, the dollar is running up in anticipation of less QE. Personally, I don't see how the Fed can stop easing right now; the market is addicted and unemployment is still unconfortably high, and more so in the higher paying jobs. Fridays job numbers could trump any Syria maneuvers. I see the institutions were buying a big chunk of bonds today; guess there are not sure which way the market is going either, or else a fear bet. For example, they were buying AGG and UST which are not particularly oversold (RSI's 41 and 35), so they must have something else in mind. I am sure losing money is not one of them. They were also buying AT&T (T); as it is way oversold and pays a dividend. Gotta love your phone. The bagholders of Nokia (NOK) got rewarded with a 31% price rise, when Microsoft announced it's purchase today. All the research groups were saying that Nokia was a dive (kind of makes one wonder if the research groups knew something and were spouting rhetoric for their clients that were accumulating). I was holding some, but sold a few days ago based on TA. Darn, I didn't see this coming in the charts! So charts are pretty good, but they can't prophesy! Well, I confess, when I relooked at the chart, slow accumulation had been underway for several months. Thanks for reading my ramblings.
 
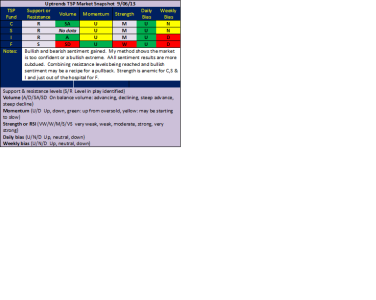
The technical have improved somewhat, but sentiment is way too bullish. So unless the market turns bearish soon, I doubt the advance will gather steam. My non-stop model is on the sidelines. Bonds have gapped down this AM, and both daily and weekly charts show weakness at this time. EFA (tracking the I fund) is nearing overbought in the daily timeframe, while the weekly is undecided, with a down bias. That is my wrap.
 
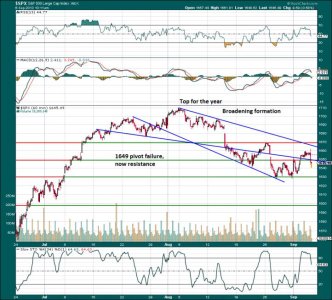
The market fell as expected, as the bullish sentiment was way out of kilter. SPX had a blast below 1649 which will now be resistance as seen on the chart below. No jobs and less looking. So presumably no taper or less taper would be forecast. Bond prices jumped at the news. The top sloping line on the chart can still be touched, but you will notice that it is dropping rapidly with time, and that it won't take long for the market to decline under the 1649 pivot resistance/support area So far we have had a double touch on the top line and a double touch on the bottom line of the broadening formation. spx_09_06.jpg
 
Forget my last chart for now. SPX has suddenly reversed and is testing the 1655 area, so is above the 1649 area. However, it is the close in the daily timeframe that is important. The last post is an hourly chart. Fake-out one way then the other.
 
This friday was confusing day. Postpone making dicision to next monday(09/08/2013). We may expect a big down day. If not, I will put my fund to S for a while.
 
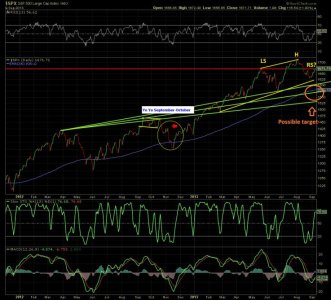
On the SPX chart below we see a right shoulder (RS) that currently could be under development. If the market turns down here, the H&S pattern would project to 1630 from a 1670 neckline, so the downtrend would end in a triangle. In this case the downside is limited, and goes back to where it has already been. We did get a really good Institute Supply Management expansion number last month, and encouraging China data today. As a worst case scenario, I suggest a target range of 1525-1600 based on ray studies from a previous high in March of 2012 (green lines). Within this broad range, we see the 200 ema, currently near 1580. Sometimes these long term ema's act as magnets. As an aside, note that in September 2012, the market was a yo yo followed by a steep decline into October-November, which overshot the 200 ema by a little bit. Does the market need a similar cleansing now? To be fair to the bulls, we see that the accelerated uptrend channel on the SPX is still intact and that the hypothetical RS could be taken out to the upside. However, so far, we see a RSI of a little more than 70 for the development of the LS, while we see a current RSI of 57 for the hypothetical RS, so this could be a negative divergence. Comparing these two points, we see a possible negative divergence for the stochastic and MACD as well. We will have to see how it plays out. Still holding to my Elliot wave count, which suggests that a turning point is at hand, from a small countertrend rally from 1627. Also, bullish sentiment is way too high.SPX_09_09_13.jpg
 
Market is against resistance and could either fail or advance in the coming days. If it does advance , it would trigger a buy signal with my nonstop model trend system. If it fails, we are heading to 1540-1600 area of SPX. Market is currently trying to work off overbought, although there is lag in some sectors topping. For example, the telecommunications sector is hot today. Verizon is still a buy. Gold gapped down today. Mining stocks are looking oversold again, with hollow red candles appearing, which may mark reversals on quite a few gold companies. Might be time to nibble on some gold companies, if you can stomach the risk. ABX, GG, EGO and NGD are my picks.
 
The SPX & EMW are already up against the upper BB. Do you think the C & S Funds could go up from here? I am looking for more sideways action here as it rests from the recent gains.
 
Back
Top