Uptrend's Account Talk

Distribution takes a long time. On balance volume has been declining on SPX since early August and may be topping on EFA. I sold almost all my stocks last week and want to short ETF's , but it's too dangerous to short at the moment as the market direct is indecisive. Took out a small position in SPXU two days ago, and it is going nowhere. Will add if the market can get below 1683 and sell if 1700 is beat. That is the tight trading range the market has been in the last few days: 1700-1688-1700-1683-1690 (right now). Some days an avalanche of trades present themselves, and some days are boring with little opportunities. Time to get the home remolding done.
 
Uptrend,

Your thread has always been on my must read for the last 2+ years. Thank you.

-RMI
Thanks RMI! A short term scalp buy for C, S and possibly I may be at hand. MY very short term SPX indicators are very close to confirming a buy. This is not my trend system however; as it is still on the sidelines . A bit of high stakes gambling here, for the ambitious (or stupid?!). In SPX context, support is near 1648 and then 1640 and resistance is near 1658-1662 and then the 1680 area. The short term pop, if it should occur here, will most likely fade near the 1680 mark, and then head lower. Or the SPX 1636-40 area could be tested first, then 1680, then decline. The direction should become apparent on the open tomorrow (Wednesday, August 21), or sometime in the session. There may be a trade on the I fund as well, as Europe has been mending lately, and I note today that money flow from institutions block trades are +50 millions of dollars into EFA. However, the weekly US Dollar chart (as UUP) is way oversold and could turn without notice, and this would detract from the I funds gains. So, IMO, the I fund trade is a little iffy. Also, my 2 hr., and daily EFA charts have not confirmed a buy, so I am very hesitant to scalp I right now. Just for the record I have seen the institutions get it wrong in the past. Could be too much anticipation of a healing Europe. So the morning may bring sunshine, or rain; we'll see.
 
Getting tired of all the taper talk? Me too. Why is the market so interested in what the Fed says? Why don't the market participants look at fundamentals, rather than fueling off Ben Bernanke jawboning and knee jerk price reactions on rumors from so called market analysts research notes? Anyway (and now stepping off my soapbox), after the close today (Wednesday, 8/21) my TA charts are getting very short term buys for the C fund and the S fund, but not the F or I fund. in fact, the US dollar (UUP) is about to confirm an uptrend, so watch out I fund. For bonds, the $TYX 30-year T-bond yield Index needs to get to the 4.5% resistance zone, before we see a buy on bond prices in a fallback on the yield. The market is now testing the SPX 1640 area, with a 1639 low today. The market reacted by putting in a 17 handle run to 1656 before falling back in the close. There will most likely be a retest of the lows tomorrow AM or survive with a slightly higher low. I have done my due diligence and picked up a number of oversold stocks that are ready to "pop". Looking for a relief rally to the SPX 1680 -1690 resistance zone, and then a lower low. Time to pick up the S fund on the open Thursday.
 
The market this AM looks a little anemic, and I am wondering if the little bounce is over. Moving out of S into F for the very short term trade. Bonds took off in the past several days, so the yields are a little overdone. My trend system is solidly on "sell" or G, as this bounce has not changed the triggers. Gold is still going up, but I am looking for a intermediate top to short it, but not yet. Dust (3x inverse gold) is on support at 21.62, but other internals are still heading down, so I think it goes down more and gold goes up. GLD is nearing resistance however, so gold may fall back soon. Looking to short the small caps as TZA as soon as tomorrow or Wednesday. TZA hit an important short term trendline, so might be time to nibble now.
 
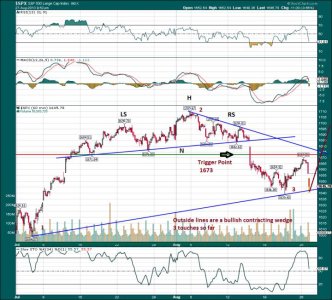
Was not trading much this AM, so thought I would map a short term "roadmap" SPX hourly chart for you. And if you are in the market, but some fate, before you sell, consider this chart. This hourly SPX chart is for the last 2 months. At first glance the H&S pattern pops out. Using the sloping neckline; it measures to 1644, but the market has already exceeded the other day to 1639. If we use the horizontal line through the middle of the large red bar that I have called "trigger point" we measure to 1632 for the downside limit. Now the outside lines on the chart form a bullish contracting formation (wedge) that has been under development since early July. Notice there have been 3 touches so far. If the market drops below the lower line and heads for 1632; the pattern is not invalidated and still in play. Any downside outside of these parameters and, well the upside is over. But, I have seen a lot of these, and if the lower line holds, business to the upside is not finished. A lot of times (rule of thimb that I have noticed), the first large gap down bar becomes resistance and remains that way until breached later to the upside. This area I have labeled the trigger point and it comes in around 1673. I hope you have enjoyed my TA. My TSPtrend system is on "sell" Bonds are topping, and I move to G today out of F for the very short term trade. SPX_08_27_13.jpg
 
Thank you for posting Uptrend. The SPX dipped to 1638 and is now hovering at 1642, just to close for comfort for a break of your lower line...
 
Thanxs uptrend, S and P bouncing off 1631, is this a "bUY" trigger in your current system?
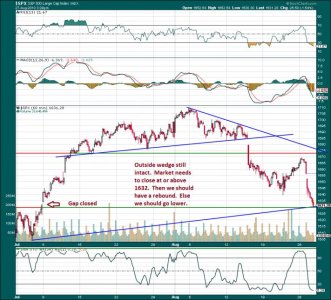
No!!!!! This is not a "buy" trigger for my TSPtrend system. However, it might be a very short term buy (which in coming days could turn into a trend buy). The market needs to hold right here and SPX must close at or above 1632 and bounce up from there in the coming days (1630 at the moment). Slight overshoots are common by the way. A downside scenario could be a bounce and test 1636-1644 as resistance and then fall further. We just don't know at this point. BTW, I have no long positions in stocks, other than some 3x inverse ETF's such as TZA. Here is an update on my chart from this AM. You can also see some gap fill. SPX2_08_27_13.jpg
 
Thanxs again uptrend, i am a rookie, i just want to keep learning as much as i can, i love your charts and explanations, keep up the great work...
 
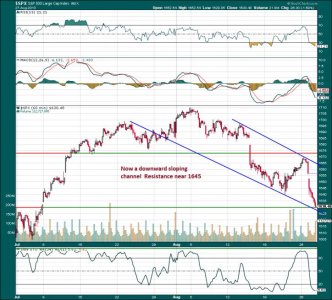
Oops!! Since the SPX price fell below and closed below 1632, the hourly chart has now morphed into a downward sloping channel as shown below. All other patterns are nixed and thrown out the window. That is sometimes the way it is with TA, revise, revise and revise. Some of my model info suggests that the move from 1710 is either halfway over or a little more. The target area for a major reversal is now somewhere between 1570 and 1604. The 1600 area is also a heavy price by volume area, and a 61.8% Fibonacci retracement from the April low, which may give this area extra weight. So don't rush out and buy much right now. Patience is key to investing (and I had to learn this the hard way!). The CNBC talking heads are using the Syrian crisis as an excuse for selling, but I saw this coming last week, and sold all my long positions. Sometimes the market just needs a little push to go over the edge. We could have a "dead cat" type bounce here, but I don't expect much more than 15 points; perhaps to the 1645 to 1649 area tops, and then continue on the free fall to more major support. If you find yourself somehow holding the bag; get out on the next tiny push up. You just can't argue with channels. They go up and they go down. My nonstop trend model continues on the sidelines: please review my post #2872. There have been five previous buy signals this year, and after this carnage is over, there will be another one. Polish your G money in the meantime. SPX_08_28_13.jpg
 
Reference your post 2872. Is there a way to go straight to it? I tried typing it in the search but no luck. I can scroll back to find it but was just wandering if there was an easier way. I appreciate all you do on here.
 
My Nonstop trend model is indicating that a short term trend change is approaching from session data today. I am surprised as anybody, because I did not expect it yet. And it is not for sure. But divergences and other factors are in place that indicate a turning point that could be here by either this Friday or next Wednesday-Thursday. There is no signal yet and no confirmation either; just highly reliable info that acts as a bit of a early warning. One scenario would be one more shot down to SPX 1620-1625 and then lift-off. Another scenario weld be a shock drop to 1600 and then lift. Has all the bad news been factored in? Don't know - just waiting to see what happens next. Nibbled on a few stocks today like KO and T, as they are oversold. Want SBUX but it has pulled back enough. Looking at TNA, but want it to pull back to the 50 area, and then market to reverse. Gold ETF's are too volatile, so leaving alone for now. To play these 3x (NUGT or DUST), IMO must be sitting at your computer with the sell order and your finger on the clicker (or else a very tight stop). I have seen these jump 8% from one way to the other in under an hour.
 
Back
Top