Uptrend's Account Talk

Despite the pop yesterday, the breadth indicators I use are still pointing down. The US dollar (USD) had a drop yesterday, that may have had someting to do with the rally in equities, but now is back to its winning ways. I am kind of cautious on the USD right now, because the market and the dollar were rallying together in March, which is a change. That tells me that the USD is becoming a place to park $ from Europe. What else could one make of it? Also, if the USD continues up, and I think that it will because it has broken some more significant resistance, this should bring down the price of some commodities such as oil. I could sure use a break at the pump.

I am sitting in cash today. Stocks I am watching are: CSC, X, YHOO, AGCO, LOW, HAL EBAY, GOL. I would like to jump on the short side (as TZA), but is too risky right now, unless one wants to sit in front of the computer screen all day and micromanage. It is still difficult to tell market direction at this top. However, my indicators say the market should turn over.
 
Since SPX 1552 was taken out this AM, we are heading down and 1523 is next. The velocity of the drop was steep, which leads me to believe this is the real deal, and start of a wave 4. The target I have for this correction is between 1380 and 1400. My cube is in force, but I will update at the next signal change.
 
As long as the market stays above 1552 it is a buy again for C,S and I. It has the appearence of a big consolidation. Mr. market has been playing with this level for more than a 2 weeks now. I am calling a buy on the cube, but it won't be updated until tonight.
 
Well I have not posted for awhile, because I was concentrating on swing trading my IRA account that I moved several months ago from TSP with the age-based option before retirement. Since I am still working, I cannot day-trade. Swing trading (holding overnight) is going well, and I am getting a very good system down. One thing that will hit you real fast is the increased volatility of individual stocks. If you believe the TA, you hold on, even if you got the entry a little wrong.

Now back to TSP: I am still holding some funds with uncle, so my blog post today is my current market view. My system for TSP is still holding a buy for C,S and I, but that could change real soon; - like tomorrow May 1. Big sell-offs have started on this date for the past two years, and todays close is a classic double "M" top. In my view, it is time to take some profits off the table.

I will try and post more often as the volatility increases, which I expect very soon.
 
I do not have any sell signals at this time for TSP C, S, I and these funds are in hold status. The market appears to be pausing; but my primary indicators are intact. However, the US dollar is trying to bottom in the daily timeframe and this should put pressure on further I fund advances. Also, the C fund is looking stronger than the S fund for a rebound. For SPX, the 1570 area is key support. On one hand I would like to think the top is in, but on the other hand this view is not supported by breadth and thrust, and not enough time and topping pattern has elasped for significant distribution by the institutions either. So, my take is that we may see some knee jerk volatility over the next few weeks, while the market grinds higher.

The gold miner stocks appear to be forming a bear flag and another downdraft IMO is likely. IMO, sell GDX, NEM, ABX on any strength. I do think there will be buying opportunities in several weeks from now, but another killer drop may be ahead, while gold takes a dive to below $1300 or even $1200. The weekly chart of GDX is lining up for a multi-week buy, but is in wait status.

I will not hold FAZ, TZA, SPXU etc overnight at the present time because the market could gap on the opening burning the shorts. The same goes for 3x leverged instruments on the long side.

My swing trade (holding overnight) report:
Stocks bought: NTI, PCLN, UTX

Stocks sold: None

Watch list: FAS, JDSU, S, VZ, QCOM, YHOO, GOL, WFC, BAC, AIG
 
This might be the turning point today, where we see escape velocity to the upside. I will know more after the close. Many of the stocks I follow are now oversold.
 
Ditto! I was happy to see your post today...and I'll take it as boding well for this weeks markets.

Thanks I apologize, but I have been very busy with individual stock trading this spring; trying to get my picks sorted out and a system together.

I have a non-stop model for the NYSE and the NASDAQ and at this time they are oversold and moving sideways. If we have a close above 1648 on SPX, there might be a buy. I will know after the close. These models are good for C & S, but not F and I. It is possible we may get another dive to SPX 1598 (double bottom), but I sort of doubt it. The FED speech this speak this weak will either fuel or flame out the market.
 
The SPX hourly and daily timeframes are overbought, but the weekly stochastic is just starting to turn up, but no cross yet. My nonstop models for the NYSE and NASDAQ are starting to turn, but no "buy" yet. The NASDAQ ia ahead of the NYSE.

Blackberry (BBRY) is rocking up and down the past few days. Yesterday up over 3%, today down over 3%. The stock is heavily shorted with an apparent good earnings that may beat coming up. Various opinions and research reports are moving it; some may be protecting clients and their short positions, or else they are accumulating.
Glad you are posting again.:)
 
Glad you are posting again.:)

Thanks! My nonstop models are pointing straight down again. The rate of change (ROC) is turning up in the hourly timeframe, but the daily sto is only halfway down on the SPX. SPX 1536 may be the target in the coming days, before any kind of sustained bounce. No safety in bonds either.
 
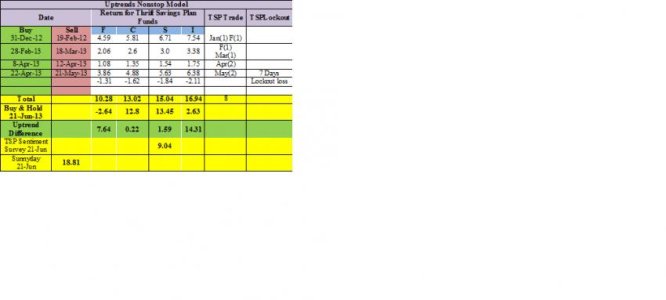
Here is my Nonstop model that has been about five years in the making. I certianly did not get it right for a while and had some flubs. The market is extremely difficult to get a grasp on. The summary is based on a trend system. The first trade in January really started in late December 2012, but I started on December 31 (to start calculating returns on January 3) to be comparable with other systems. There have only been four trades so far this year, and the system is currently on a sell. The one short trade in April, caused a lockout for seven trading days, as a new trade started on April 22. In other words, if you did the first trade in April, there are no more IFT trades and one is locked out. The system assumes you take the trades when they come. It operates in the daily timeframe. You can see the system has few trades and very good returns. The system thus far has not been tested for a bear market. The returns are beating buy and hold, the Sentiment Survey system, but not Sunnyday! The system had very good returns for F (10.28%) and I (16.94%), and this was a surprise to me. S and C are not that much different from buy and hold, so far. Calculations are for actual closing day prices.

I will post the day of the next buy. Hopefully this chart is readable or else I can post it larger.


Summary_6_21.jpg
 
Markets still pointing down, but some divergences are appearing. Am thinking we open red tomorrow in the AM and then after a little more selling, a rally to a little over SPX 1600, and then decline to the 1525-1540 area to end the correction. End of quarter window dressing should cause some buying pressure through Friday.

My nonstop model is on "sell" and out of the market as has been the case since May 21.

Hold a Blackberry position and still think there is a possibility for a short squeeze, as it has huge short interest on it (the non-believers). The weekly chart shows IMO a "classic" cup and handle pattern that is playing out to a tee. This pattern price projection is to around $30. Friday is when BBRY reports earnings which I think will beat and the stock should gap up to the $18 area. Today closed at $14.10. If there is a big run-up before Friday, I may sell half my position to protect "sell the news" This stock is a traders delight.
 
Blackberry is moving up as expected this AM. Targets are 15.30, 15.55 and then 16.48. It is a screaming buy in the short term, and I think longer.

As for the market, SPX has cleared the 1560 area and that is good. However, we need a higher low to ensure we are really in wave 4, and in that case a target near SPX 1613 in the coming sessions. However, the downtrend is not over based on EWT wave structure, as we need a wave 5 down. For the daily timeframe that TSP trades, there is no buy here, other than a scalp strategy.
 
My nonstop trend model is in sell status. There are divergences, but that is about it. No real traction here - so far The US dollar is getting toppy. Gold is going through the floor, which tells me a turn is not far away. At some point, I might be brave and buy a little leverged gold on the long side: NUGT; this might not be a bad entry point, but the chart tells me it is still a little early and it has dropped over 11% today! My blackberry trade is going fine - up up and away looking for 15.60 first with an ascending triangle.
 
Back
Top