Uptrend's Account Talk

Hey Uptrend - Haven't heard from you in a while, just popping in to see if you're around and what you're thinking.
HAPPY NEW YEAR! The market is overbought but my nonstop model is on buy. So that is my position 100% S Will post changes as they occur, usually about 6 to 10 signals each year.
 
1) Nonstop model is on "buy." Works best for C and S funds. Ignores day to day volatility.

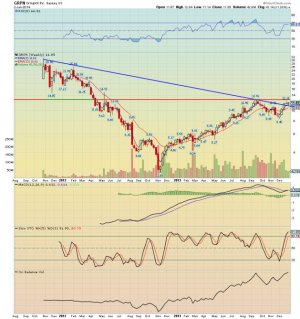
2) I fund using EFA as surrogate is rising.

3) Bonds have little direction at the moment.

4) My screaming stock pick. Note: this is a cup and saucer pattern that measures to $22.92. That is nearly a double!
You can see the blue line has been breached. May slide along above this line, in a downtrend fashion, for a little bit before take-off. Breakout level is $12.76
 

Attachments

  • grpn_01_02_14.jpg
    grpn_01_02_14.jpg
    71.1 KB · Views: 334
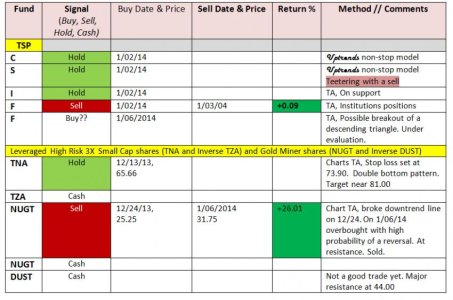
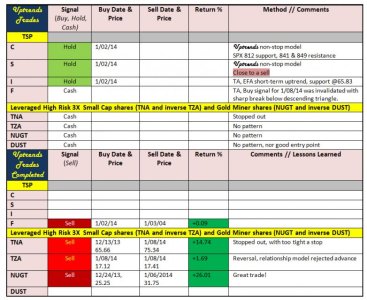
Signal update for week ending 1/03)14. To coincide with the tracker, all TSP funds start on 1/01/14. Small cap and gold miners leveraged instruments (TNA, TZA, NUGT, DUST) are tracked as well. Signals are either determined by my non-stop model or by TA. Trade at your own risk.


Fund

[TD="width: 102"]
Signal

(Buy, Sell, Hold, Cash)
[/TD]
[TD="width: 120"]
Buy Date & Price
[/TD]
[TD="width: 120"]
Sell Date & Price
[/TD]
[TD="width: 72"]
Return %
[/TD]
[TD="width: 186"]
Method
[/TD]

[TD="width: 55"]
TSP
[/TD]
[TD="width: 102"][/TD]
[TD="width: 120"][/TD]
[TD="width: 120"][/TD]
[TD="width: 72"][/TD]
[TD="width: 186"][/TD]

[TD="width: 55, bgcolor: transparent"] C, S
[/TD]
[TD="width: 102"]
Hold
[/TD]
[TD="width: 120, bgcolor: transparent"] 1/02/14
[/TD]
[TD="width: 120, bgcolor: transparent"][/TD]
[TD="width: 72, bgcolor: transparent"][/TD]
[TD="width: 186, bgcolor: transparent"] Uptrends Non-stop model
[/TD]

[TD="width: 55, bgcolor: transparent"] I
[/TD]
[TD="width: 102"]
Hold
[/TD]
[TD="width: 120, bgcolor: transparent"] 1/02/14
[/TD]
[TD="width: 120, bgcolor: transparent"][/TD]
[TD="width: 72, bgcolor: transparent"][/TD]
[TD="width: 186, bgcolor: transparent"] Charts TA
[/TD]

[TD="width: 55, bgcolor: transparent"] F
[/TD]
[TD="width: 102"]
Sell
[/TD]
[TD="width: 120, bgcolor: transparent"] 1/02/14
[/TD]
[TD="width: 120, bgcolor: transparent"] 1/03/04
[/TD]
[TD="width: 72"] +0.09
[/TD]
[TD="width: 186, bgcolor: transparent"] Charts TA, Institutions
[/TD]

[TD="width: 655, colspan: 6"] Leveraged High Risk 3X Small Cap shares (TNA and Inverse TZA) and Gold Miner shares (NUGT and Inverse DUST)
[/TD]

[TD="width: 55, bgcolor: transparent"] TNA
[/TD]
[TD="width: 102"]
Hold
[/TD]
[TD="width: 120, bgcolor: transparent"] 12/13/13, 65.66
[/TD]
[TD="width: 120, bgcolor: transparent"][/TD]
[TD="width: 72, bgcolor: transparent"][/TD]
[TD="width: 186, bgcolor: transparent"] Charts TA
[/TD]

[TD="width: 55, bgcolor: transparent"] TZA
[/TD]
[TD="width: 102, bgcolor: transparent"]
Cash
[/TD]
[TD="width: 120, bgcolor: transparent"][/TD]
[TD="width: 120, bgcolor: transparent"][/TD]
[TD="width: 72, bgcolor: transparent"][/TD]
[TD="width: 186, bgcolor: transparent"][/TD]

[TD="width: 55, bgcolor: transparent"] NUGT
[/TD]
[TD="width: 102"]
Hold
[/TD]
[TD="width: 120, bgcolor: transparent"] 12/24/13, 25.25
[/TD]
[TD="width: 120, bgcolor: transparent"][/TD]
[TD="width: 72, bgcolor: transparent"][/TD]
[TD="width: 186, bgcolor: transparent"] Chart TA, broke downtrend line
[/TD]

[TD="width: 55, bgcolor: transparent"] DUST
[/TD]
[TD="width: 102, bgcolor: transparent"]
Cash
[/TD]
[TD="width: 120, bgcolor: transparent"][/TD]
[TD="width: 120, bgcolor: transparent"][/TD]
[TD="width: 72, bgcolor: transparent"][/TD]
[TD="width: 186, bgcolor: transparent"][/TD]
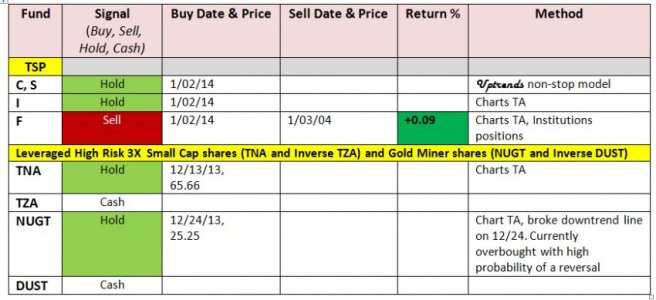
 
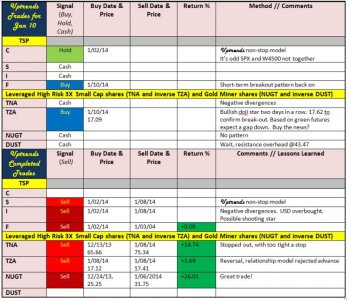
Lets try this view. Post #2944 threw it all over the page. These are my signals and will post when they change. I am mostly trading individual stocks, but will show my signals for TSP funds as well as some leveraged ETFs and individual stock picks. The SPX market and I fund shows signs of weakening, but is not breaking down. The US dollar is set to rally and this is a concern for the I fund. The F fund is on sell. The gold miners have been up for the past to weeks, but gold is near resistance an another down-leg could be near. The buy dates for the TSP funds was set at 01/02/14 to be in step with the tracker.
 

Attachments

  • Signals_01_03_14A.jpg
    Signals_01_03_14A.jpg
    57.6 KB · Views: 325
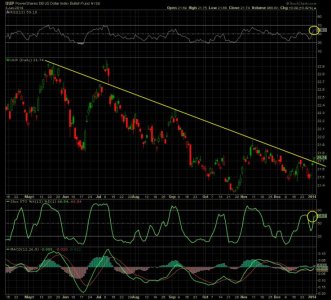
Before you get too excited about the I fund, consider this US Dollar Index bullish fund chart (UUP). Fridays session has pushed above the downtrend line. If price stays above for three sessions or so, we have a bullish breakout. I think this will happen because the weekly chart is trending up and is very much not overbought. Also note on the daily chart below that stochastic and RSI are not overbought. Europe could be on the mend, but the US dollar will provide headwinds, and take away some potential gains. Also the gold miners may reverse, and reverse violently, so luck out NUGT.
 

Attachments

  • UUP_01_04_14.jpg
    UUP_01_04_14.jpg
    88.1 KB · Views: 364
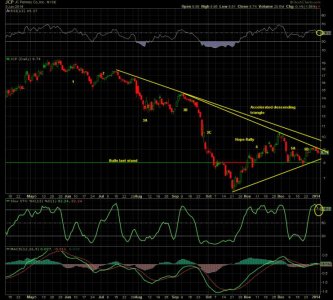
Update on post #2938 JCP. This high risk trade is over. If you are holding, might be a good time to sell. We see a classic descending triangle that is accelerating. Wave 4 is what I called the "hope rally" and this was the sweet spot. Christmas is over and the retailer should struggle; at least this is what the chart is telling me. I sold in early December and do not hold a position. The $8.00 level is the bulls last stand. This stock is now a loser IMO. Also see my other two new posts below. Thanks for reading!
 

Attachments

  • JCP_01_04_14.jpg
    JCP_01_04_14.jpg
    87 KB · Views: 383
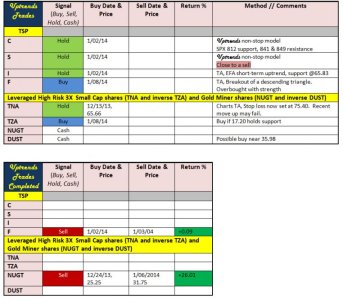
Exited the NUGT gold trade @ 31.75 due to resistance and overbought. No DUST at this time. In cash. See post #2945
 
Congratulations on making it to the top of the AutoTracker. I got a feeling LAT hacked the website and put himself on top. But I know you are the real leader. :)
 
Congratulations on making it to the top of the AutoTracker. I got a feeling LAT hacked the website and put himself on top. But I know you are the real leader. :)

Yeah LAT probably shops at Target and has all our SSN, drivers licenses, debit card # etc

Today SPX looks like a bullish harami candlestick forming. Don't know if it will hold up.

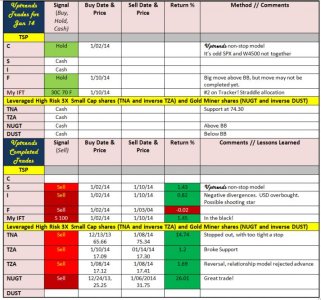
Signal_01_14_14.jpg
 
Back
Top