Uptrend's Account Talk

There is a weak wave 4 underway this AM. I expect one more push down, as explained in my blog "Counting waves", and then a more substantial counter rally of about 30 points on SPX. Then a more severe drop should follow. Bonds have been quite choppy and the VIX as well for the last few days, but both are trending up. Gold is down again this AM, after a 2 day bounce being rejected by the 5 ema. The trend on gold is still solidly down.

I see there is quite a bit of interest in some ETF pairs, such as TNA/TZA. TNA should have been sold last Wednesday. TNA is on a small bounce, but the trend is down, so if bought as a scalp play, should be sold when the 15 min charts roll over. TZA trend is up from a buy last Wednesday.
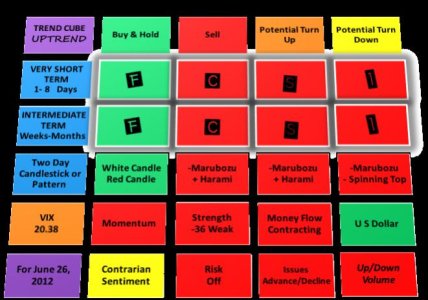
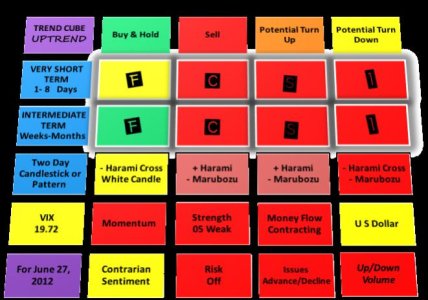
cube_06_26_12.jpg
 
I have been watching the Euro/USD currency pair and it still points dwon this AM. The pop on SPX was more than expected, but is running into resistance. My view has not changed, as I think minor wave 5 lies ahead to end near 1300-1290 and complete intermediate wave one, with a turn date projection of July 2.

cube_06_27_12.jpg
 
Harami - a thin cut of beef
Marubozu - a buzz-style haircut

Ha Ha! I heard Harami and Marubozu were two rappers in a punk rock band.

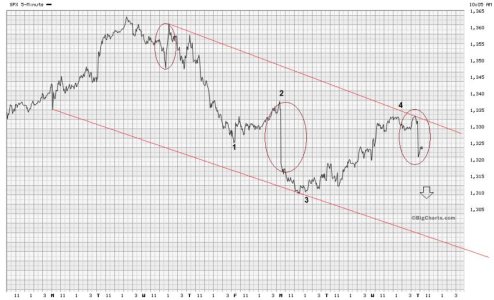
Here is a minute wave chart for today. Look like wave 5 underway to me. Notice the downtrending channel and impulse move down that are circled.

spx_06_28_12.jpg

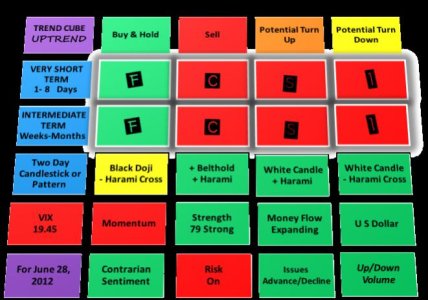
Today's cube (being in the daily timeframe) is a bit out of synch in the bottom 3 rows with what is going on in the market this AM. We have an increase in volatility (VIX) with a freefall move, as viewed in the chart above. Perhaps all this will reverse by the close, but the trend line still appears down.

The short term trading model in row 1 did not trigger on Monday, 6/25, because threshold criteria were not met, but was close. So it passed on the trade. The way it is set right now is filtering out the mariginal small pops. Of course you should know TA criteria is not always right, but has a higher probability of being right compared to just guessing.

c ube_06_28_12.jpg
 
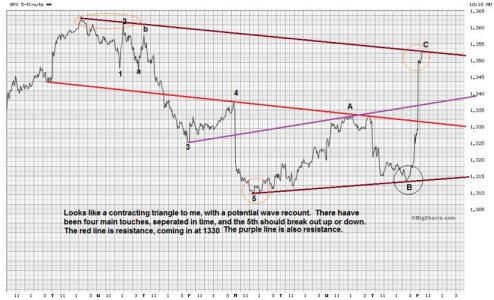
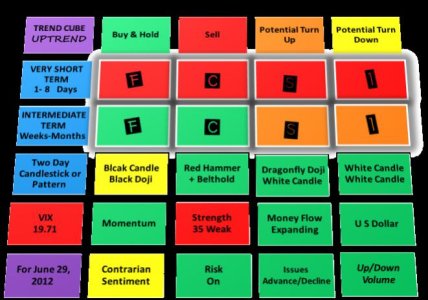
The upward thrust was a surprise. Looks like a contracting triangle could be forming, as viewed on the chart. The surge to SPX 1355 a few minutes ago still does not change this chart. Pullback range is near 1340 and then 1330 and 1315. The market is very overbought short term. Bonds are holding up rather well, despite this rally, so there may be distrust. The intermediate signal on the cube flipped green for SPX, but would wait for the next minor pullback to enter. S and I should follow by the next session. Risk is on. Strength. will improve by the next session. A flash or something more is the question.

spx_06_30_12.jpg

cube_06_29_12.jpg
 
Today the ISM manufacturing report took a big drop, the worst in two years; 49.7 from 53.5 in May. The longer term effect of this can't be good, but am not sure what the short term would bring. The market barely moved.

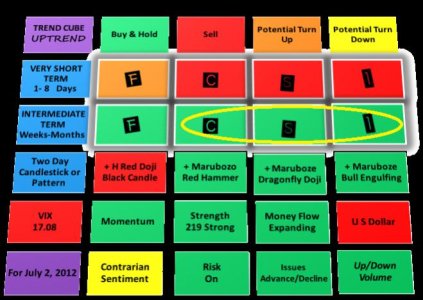
My cube trend system has now flipped buy for the intermediate term (C, S and I). However, when it flips buy for the intermediate term, one should wait for a minor pullback to enter. That may occur later this week; perhaps Friday with the monthly jobs report? There is a possibility that this is a fake-out, but will evaluate over the next few sessions. Going forward, I should be the strongest fund, if the US dollar slides against the Euro. Bonds have had intra-day reversals two trading sessions in a row. The US dollar is slightly up against the Euro today. So we probably will have minor weakness in the near term.

cube_07_02_12.jpg
 
SPX has just topped 1371 this AM and is ripe for a pull back. The 1370 area should have resistance. The international fund, tracked as EFA ETF, shows a 3 white soldier candle breakout, but has some serious gap fill to do down the chart. Seasonality appears to be strong. Bullishness is going crazy and contrarian sentiment has turned down.

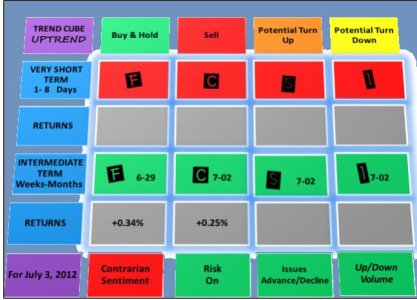
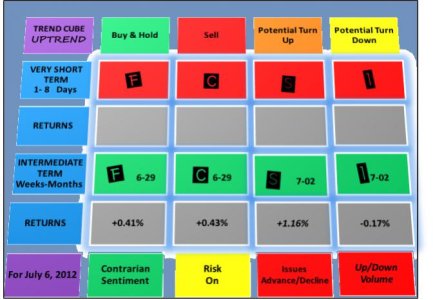
I am now tracking returns on the cube, from July forward, so I have dropped some of the daily metrics. However, four very important ones are still shown. Dates are shown when the trade began or ended, and returns appear one day later, because of the IFT lag time. If more than one short term trade occurs in a month, a T1 and T2 will appear. (Ok- my goof -I see one correction; the C trade in the intermediate term started on 6-29, not 7-02, and that is why a return is shown for yesterday).

cube_07_03_12.jpg
 
Took a position in ETF TZA @16.82. Took position earlier today in ETF FAZ @ 21.67. These are short term swing trades (held overnight). Now I wait. Let the fireworks clear. There are big gaps up the charts to fill.
 
Took a position in ETF TZA @16.82. Took position earlier today in ETF FAZ @ 21.67. These are short term swing trades (held overnight). Now I wait. Let the fireworks clear. There are big gaps up the charts to fill.

I also bought some TZA @ 16.81. Hopefully we can make a quick buck after the 4th. :)
 
The EFA chart is down today (-1.45%), but the European charts don't support the move. Greece ($ATG) is up almost 5%, and the rest of them are only down a fraction.

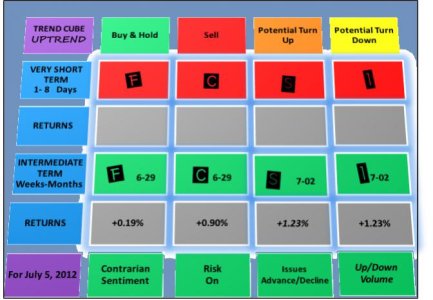
cube_07_05_12.jpg
 
The SPX had the breakdown of a bullish rising wedge. Looks like 1340-1350 is the target area for perhaps a higher low. More this weekend.

cube_07_06_12.jpg
 
Sold FAZ @ 23.11. Bought @ 21.67 on 7-03 +6.6% trade Met my short term trade criteria. Have not sold TZA yet.
 
Sold FAZ @ 23.11. Bought @ 21.67 on 7-03 +6.6% trade Met my short term trade criteria. Have not sold TZA yet.

Thank you for the update Uptrend! Do you plan on selling your TZA today or are you going to let it ride out until Monday?
 
Nice trade! I'm thinkin' about sellin at least part of my TZA this afternoon.

I was considering selling TZA also, but the RSI is not overbought on the 60 min chart like it was on FAZ, and the sto and roc are still going straight up. Depending on positon size, one can sell a portion in case the trade goes against you. Take off the table in increments as they say.
 
It makes great sense, but it always pisses me off. If I sell half the position the the etf continues rising, I'm mad b/c I could have left 100% on the table. Otherwise if it drops, I wonder why I didn't sell the whole position. Of course one could think, "man am I glad I sold half", just not how I think.

A win is a win. I don't mind selling half if unsure, cuz it protects the win. Also, 3x levereged ETF'ssuffer slow deterioration the lonbger you hold them.

I just sold TZA @17.57. Bought on 7/3/12 @ 16.82. Gain is +4.4%
 
Back
Top