Uptrend's Account Talk

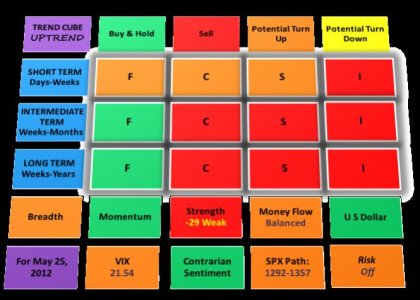
cube_05_25_12.jpg

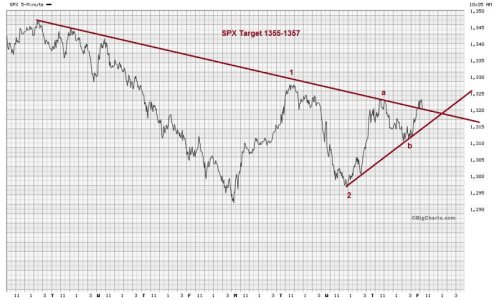
The market cannot decide, and it is in nuetral. The bias is up forming a wave on SPX to the 1355-1357 area and then down towards 1260 nad perhaps as low as 1227. This should play out by the end of June. The short term cube signal is very close to flipping green, and it could even do it intra-day. But, it could all fall apart, as the US dollar stays strong.

SPX_05_25.jpg
 
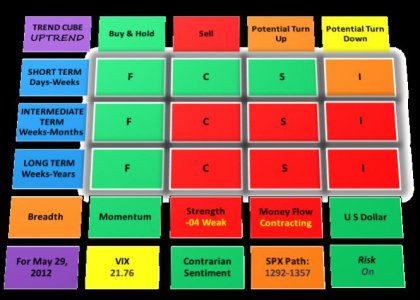
Hope everyone had a good extended weekend. Today bonds are maintaining an uptrend with F on buy, while the C and S funds flipped to short term buys. Risk is also on. But bonds are out of synch with equities and the VIX is actually rising this AM. So, this move for C & S is not to be trusted, and IMO may be sujected to a whipsaw. The intermediate term trend is still on sell for all funds (other than F).

cube_05_29_12.jpg
 
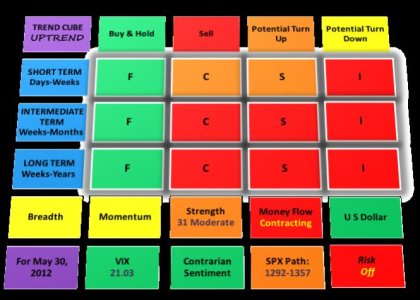
Todays cube C and S should be yellow. Still not happy with the short term signals, and will slightly change parameters for the next cycle.

cube_05_30_12.jpg
 
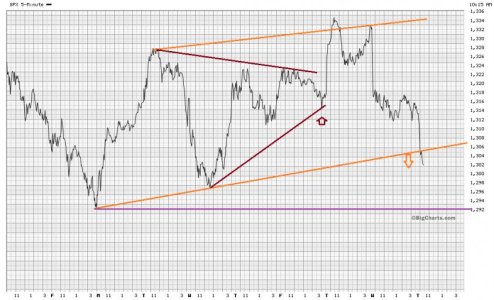
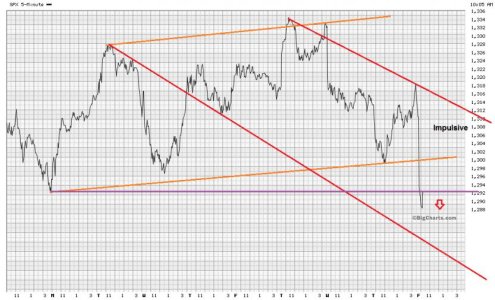
Today on SPX channel support appears to have been busted at 1305, as seen on the chart. I guess it is back to the lows and more. Bonds are going crazy, and USD is strong.

SPX_05_31_12.jpg

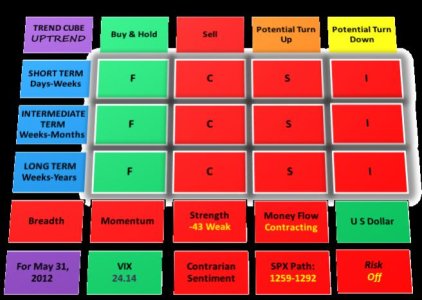
cube_05_31.jpg
 
On SPX we had an impulsive move down that broke the prior lows. Still bouncing around in the 1286-1292 pivot area however. Note the red downtrending channel on the chart below. Note also that the downtrending channel has a greater slope than the previous uptrending orange channel. SPX 1260 area is in the cards now, and perhaps even a shot at 1207. More on a weekend blog. I am seeing a few divergences, but most everything including STO is heading lower. Bonds volume yesterday was HUGE.

SPX_06_01_5m.jpg

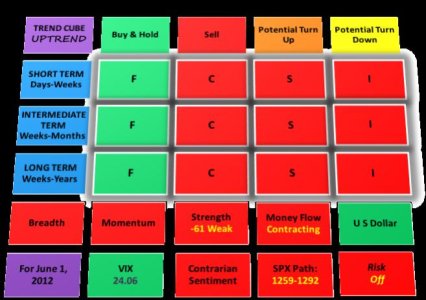
cube_06_01_12.jpg
 
Do you think we may get a wave 2 bounce if wave 1 completes in the 1270 area, or do you think we go past 1270?

spx30.png
 
Do you think we may get a wave 2 bounce if wave 1 completes in the 1270 area, or do you think we go past 1270?

It will depend on in part what the US dollar is doing. It needs to trade above 82.484. Also, based on the decline from 1422 or 1415, if you accept we had a failed intermediate fifth wave, the fibonacci numbers point lower. Any bounce at the 1270 level would probably not trade past the 1289-1296 area pivot.
 
It will depend on in part what the US dollar is doing. It needs to trade above 82.484. Also, based on the decline from 1422 or 1415, if you accept we had a failed intermediate fifth wave, the fibonacci numbers point lower. Any bounce at the 1270 level would probably not trade past the 1289-1296 area pivot.

I don't think 1270 would be a bounce point with any significance. I was looking for a bounce from the mid 1250's area...but when? At some point I am looking at making a quick in and out but can't decide if tomorrow is the best buy in day or if that would be too soon. Rolling the dice if I do...staying in capital preservation mode if I don't. One more hour to decide!

Thoughts?
 
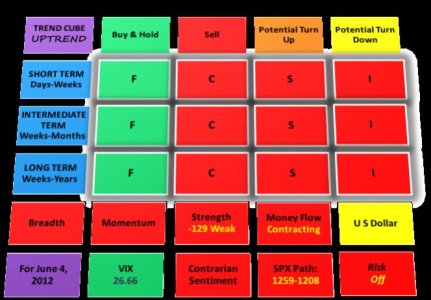
Trend cube today. Since the SPX is now below the 200 ma the trade of choice for TSP now becomes the short term trade. All rallies should be suspect and sold until the SPX climbs back above the 200 ma currently at 1284.94 and the 200 ema currently at 1313.67. Important support/resistance levels are in the 1292, 1303 and 1313 areas. I have changed the short term trend triggers to respond quicker when a momentum change occurs, than when the cube was first deployed. The downside is that you may take a short term gain, and give up your monthly IFT while doing so, when a larger move may come later in the month. That is whly identifying support/resistance levels is so important and potential wave retracements. Based on time analysis, I think a larger bottom is coming later this month in the June 18-22 area and that is whly I may not trade any earlier move, unless it clears 1313.

cube_06_04_12.jpg
 
I don't think 1270 would be a bounce point with any significance. I was looking for a bounce from the mid 1250's area...but when? At some point I am looking at making a quick in and out but can't decide if tomorrow is the best buy in day or if that would be too soon. Rolling the dice if I do...staying in capital preservation mode if I don't. One more hour to decide!

Thoughts?

From 1415, wave A down to 1292 was 123 points. Wave B was 1292-1335=43 points. If C=0.618(A), then C would end at 1335-76=1259. However, I think the move may be a lot lower to the low 1200's for reasons stated in my weekend blog.
 
From 1415, wave A down to 1292 was 123 points. Wave B was 1292-1335=43 points. If C=0.618(A), then C would end at 1335-76=1259. However, I think the move may be a lot lower to the low 1200's for reasons stated in my weekend blog.

I agree with the move lower in the intermediate term but was hoping for a short term bounce sometime over the next week. Thanks for the response and I'll read your blog again!
 
For what it is worth, I stayed F for now. I can't justify the risk of going in for about 2% when I think we are on the cusp of another 6% or so drop. If I see something that will give the markets a brief run up then I might try to time it...but for now I am playing safe.
 
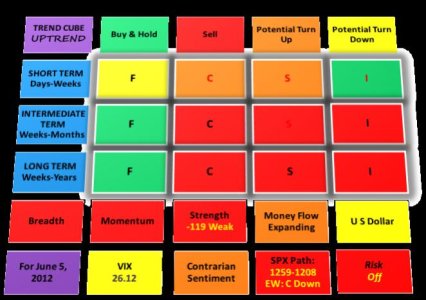
Todays cube. Under SPX Path, I added EW for Elliott Wave. These are the intermediate waves; not the minor or minute. In an uptrend 1,3 and 5 advance, while 2 and 4 go against the trend. In a downtrend it is reversed. However, we should be still in an uptrend, but major IV wave down; which unfolds in three intermediate waves A, B and C. If we are in wave C, it is downtrending, even if the minor waves uptrend (like today). Waves A and C should not be traded in the TSP system. Sure, there is a very short term trade, but very hard to time. Basically you would trying to catch the mnor waves of 1-2%, but with the one day delay, you might miss. So, the C, S or I is colored red in the short term box, showing that if the orange or green color indicates a possible trade, it is high risk, because the wave structure is likely to go against you. (The black S should be in the intermediate term box).

cube_06_05_12.jpg
 
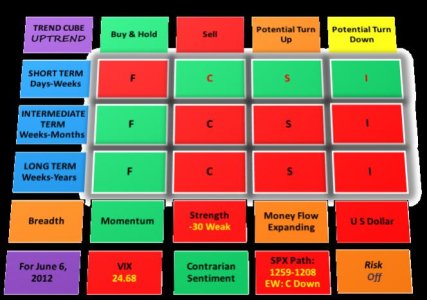
Todays cube. The surge today is more than expected. This brings a question up if the Elliott wave count is correct; that is if SPX 1415 is a broken 5th wave, or if 1422 is the 5th wave high. Another scenario is that the market is tracing out a triangle, where this wave fails below the 1313 pivot and has a downside target between 1267 and 1259. A 0.618 fibonacci retracement of the last wave set down from 1335 shows a target of 1309. It has passed the 0.50 fib at 1301. At any rate the intermediate trend is not buying it -yet. The red lettering on C, S and I mean that these short term trades have a high risk of failure, because they are in conflict with the assumed wave count.

cube_06_06_12.jpg
 
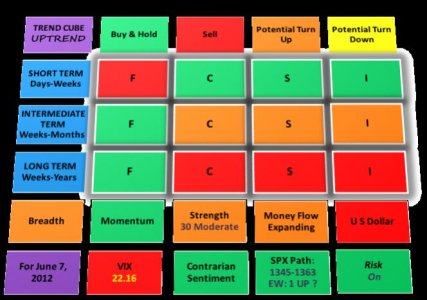
This rally was a surprise to me! Too far too fast. Not sure if major wave IV has ended. Part of the problem has to do with how intermediate wave 5 of major wave III ended: at 1422 or 1415 as a failed wave. 1422-1357-1415-1292-1335-1267, is a five downer. 1415-1292-1335-1267 is ABC. But major II correction wave from 1371 to 1075 appears to have been a 5 downer instead of a simple ABC; 1371-1258-1356-1102-1231-1075. So if the first 5 down count is correct from 1422, we have seen the bottom and a target is around 1614 for major wave V. But if a failed wave at 1415; by assumed symmetry we may have a five downer and not seen the bottom yet as some kind of flat is developing? So far we have as of this AM: 1415-1292-1335-1267-1329 and then -68(symmetry with wave 3)=1261 target?? (This assumes that 1329 is the top of wave 4). I am sure which count is correct, but we will find out soon enough.

cube_06_07.jpg
 
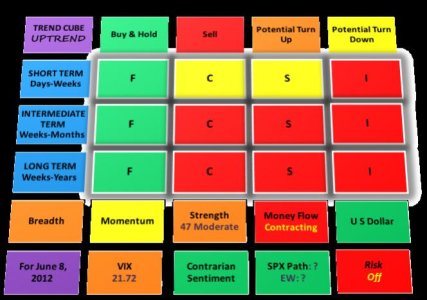
The market needs to exceed SPX 1335 and put in a higher low to confirm that the trend is up. Otherwise the downtrend may not be over, as there are several possibilites for ending waves. Bonds today are saying the equities downtrend is not over, and the US dollar is saying the same thing (up). So I still expect that 1267 will be tested again in the coming days.

cube_06_08_12.jpg
 
Below is the Uptrend cube with another redesign. Why? Because although some of the trend information was interesting, you just can't trade it with our limited TSP 2X month IFT's. So here is what I did.

The first trade is very short term, usually 1-8 (max) days. The triggers are set for oversold market bounces. Further, the sell signal can arrive while the market is still rising. However, by repeating this trade over and over has shown really good results. It works in bull and bear markets, but would be more risky in the latter. Time in the market is minimal, as you would be on the sidelines most of the time. The objective would be a gain of 1-5% per trade (except for the F fund). You can't really call it a trend.

The second trade is the intermediate term trend as before. Nothing has changed. This trade only come around 2-5 times a year, and holds for weeks to months. It has not shown up since I introduced the cube in March. The last occurence was late December 2011 to early February 2012. This trade has longer hold times in the market, and therefore carries more risk. However, you are not laying down in fromt of the train (what it feels like) as in the short term trade. In other words, buying while the market is declining under certian conditions. When the intermediate trend is in force, it is the one to follow, unless it does not meet your time in market risk tolerance levels.

I have added a 2 day candlestick and pattern line. For each for the F,C,S and I funds above, the respective AGG, SPX, Wilshire 4500, and EFA charts show the last 2 days of candlesticks and or the last multi-day pattern and the color interpretation of what it could mean. If not a pattern, the bottom candlestick is the most recent.

Advance/decline and volume have been added. That is part of breath.

I really don't wish to tweak this much more in the future, but am results orientated, so let's see what happens. After a month goes by, I will start posting the results.
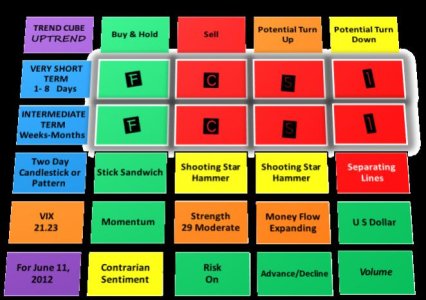
cube_06_11_12.jpg
 
Uptrend am I reading this correct, you cub says to hold "F"?

Taller

Yes For example, the F fund intermediate trend has been in on since April 9. When the intermediate term trend trade is on, one should play that rather than the very short term oversold trade. Of course the C,S and I funds have larger gains for a very short term trade or an intermediate trend trade, and when that occurs, one may want to do that.

I have reduced the cube to two trading styles. The short term trade was removed because although it is an extension of the oversold trade,it is subject to frequent whipsaws. In other words, by the time the trend is detected, one should be selling fairly soon, as a pullback may arrive shortly. The long term trend was was for reference only and has nothing to do with trading, so it was removed.

Tonight for example futures are way up and very short term trade is sell (red) for C, S and I. Tomorrow will probably be an up day. But by the trading rules for that trade, the sell was issued Friday. It does not matter that it cannot catch all of the move, as it attempts to catch the lions share. Occasionally there will be a miss, but it is a repeatable system that counts. Just follow this cube for 2-3 months without trading it at all and see what it does.
 
Back
Top