Uptrend's Account Talk

Uptrend,
Thank you very much for all of your hard work educating all of us!
I have been studying your new cube and am confused as to why C/S/I are all red/sell, but Risk is green/risk on and many others of the lower half of the cube look to be positive?
Thanks again.
 
Uptrend,
Thank you very much for all of your hard work educating all of us!
I have been studying your new cube and am confused as to why C/S/I are all red/sell, but Risk is green/risk on and many others of the lower half of the cube look to be positive?
Thanks again.

Risk On/Off is based on currencies and carry trades. That is turning down this morning. Remember that the cube operates in the daily timeframe, so a slight lag time can develop. Also, (this is important!) the very short term trade (not a trend) often goes against the prevailing trend, and will often be in conflict. The intermediate term trend will be in synch with the technicals when it flips or before, but right now the sustainability is just not there for that trade.

I am just as clueless as you what might happen next in the market, but if I had to guess based on my studies, I think a retest of the SPX 1290's area might happen to put in a higher low. Or a retest of the lows and/or a lower low is not off the table. Looks like the Spain bailout was priced in last week and "sell the news" today.

Okay, let's see if I got this straight in my horse head now. Because the short term trade is for 1-8 days it will whipsaw red-green-red with the market for those that want to try to pick up a quick hitter and get back out. It changes as the waves crest and trough up and down. The intermediate trade is for weeks to months and therefore doesn't concern itself with the waves but follows the tidal flows in and out as it is for a longer time frame trend trade. The bottom indicators are looking at an even longer time frame and indicate that the market continues to be in a bull market/uptrend until it is not. Or to keep with the nautical theme, it is looking at sea level rise/fall due to climate change.
How'd I do?

Ok The very short term trade is for 1-8 days, is a quick hitter, but does not whipsaw. It really does not establish much of a trend and works off oversold conditions. The short term trend is subject to whipsaws, so I don't track it on the cube anymore. The intermediate term trend trade continues for weeks/months and triggers when the market gets strong enough for it to sustain. It's kind of like a fire; there needs to be enough heat to keep it going. All the indicators below the very short term and the intermediate term rows are for reference. The candlesticks and patterns go with the TSP funds above, and that is why the row header is blue (showing you read across). But the climate change is a little far out LOL. Anyway, hope that helps.

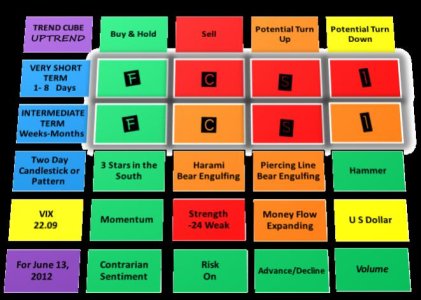
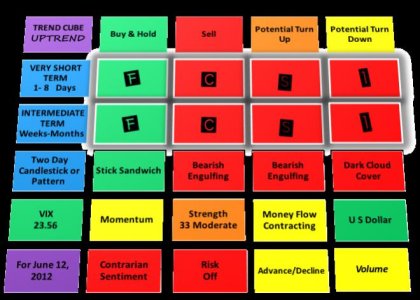
Here is todays cube.


cube_06_12_12.jpg

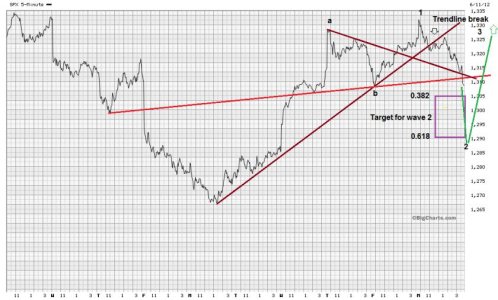
Also, here is an idea for a higher low scenario on SPX. Target box is between 1305 and 1291. After wave 2 completes, wave three could go as high as 1405. My long ago time projection for a turning point is next week June 20-22. but it may happen sooner.

spx_06_11_12.jpg
 
Ok The very short term trade is for 1-8 days, is a quick hitter, but does not whipsaw. It really does not establish much of a trend and works off oversold conditions. The short term trend is subject to whipsaws, so I don't track it on the cube anymore. The intermediate term trend trade continues for weeks/months and triggers when the market gets strong enough for it to sustain. It's kind of like a fire; there needs to be enough heat to keep it going. All the indicators below the very short term and the intermediate term rows are for reference. The candlesticks and patterns go with the TSP funds above, and that is why the row header is blue (showing you read across). But the climate change is a little far out LOL. Anyway, hope that helps.

Here is todays cube.


View attachment 19205

Also, here is an idea for a higher low scenario on SPX. Target box is between 1305 and 1291. After wave 2 completes, wave three could go as high as 1405. My long ago time projection for a turning point is next week June 20-22. but it may happen sooner.

View attachment 19206

Wait, you no longer track very short term, but then you put it in your "Cube" for today?:worried:
 
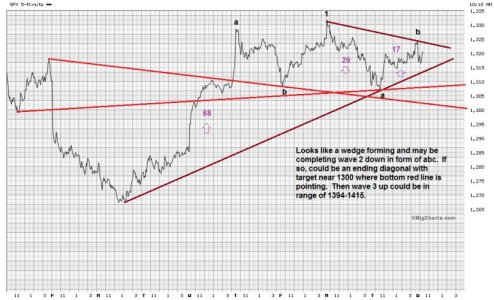
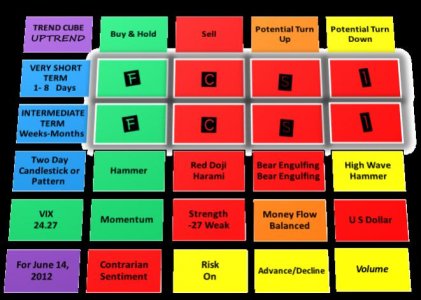
Here is todays cube. I am still looking for the currnet move to end near SPX 1300 and then a rise to 1360 area. If the inverse H&S plays out the move could extend to the 1400 area. Also see my blog today. No buy signals at this time other than F that is green.

cuber_06_14_12.jpg
 
SPX double top on an ending triangle. Very hard to read what is going on right now. A cash (G) position might be a safe play, until we see how the Greece situation plays out. The technicals are showing compression on most of the charts, so a big move is coming up or down. This is one set-up that is gambling, as as TA does not show much direction.

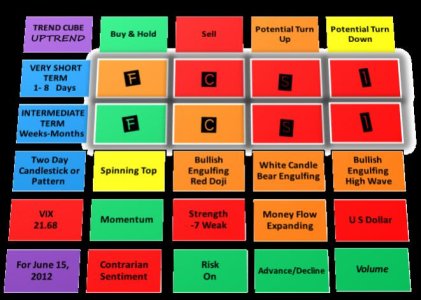
cube_06_15_12.jpg
 
Uptrend, you short term F Fund, did you mean to put Yellow in the box instead of Orange?

It's been green the past few days, now it's turned Orange of a possible turn up? I thought Green
was up? I am thinking a possible down turn short term as you mention cash (G) might be the best option
until after Greence this weekend.
Your right I meant yellow. I am traveling but will update Sunday evening.
 
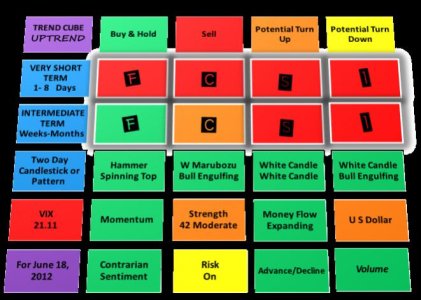
Today the market is starting out sluggishly, so Europes concerns apparently are still on the front burner. Also, there is a heavy resistance line on SPX, as I have shown on my blog, as many battles have been fought in this area. The US$ is looking like it wants to change direction up, so that line might be a lid. Then there is Microsoft with some secret announcement today that has unkown potential. A cycle turn date is due to arrive Wednesday-Friday, but polarity cannot be determined (up or down). Will the Fed announce some more QE Wednesday when they meet? All questions to ponder.

As for the cube, the very short term trade for the F fund is a sell. It should have gone to sell last Friday, but I was traveling, and could not post. The intermediate term trade is sitting on the fence. Sideways markets below heavy resistance are probably not worth the risk/reward, but that is an individual decision.


cube_06_18_12.jpg
 
I thought Microsoft's event was on June 20th. Where did you see something about it being today? Thank you.

EDIT - I guess they have a "super secret media event today"? lol
 
Last edited:
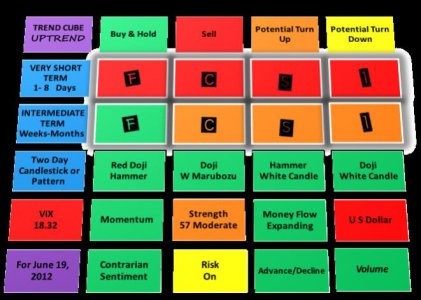
Good morning. The market is very overbought, so it needs to cool off. Bernanke and the FOMC could move the market today. The advance is coming upon a decision point for a real rally or a fake and fail. Cycle theory shows a turning point today through Friday. Wait for a pullback.

cube_06_20_12.jpg
 
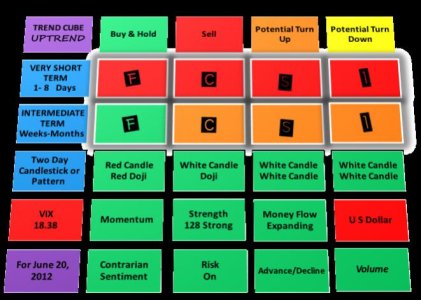
The international fund, I, as EFA is leading the parade today-down. EFA gapped down and is currently off about 3%. Not a good payday. Remember, I talked about cycles and turning points in several of my posts and mentioned that June 20-22 was the window? Well, I think we are on the turn. The US dollar is climbing as well as bonds, again. I expect SPX 1344 to be tested and give way, then 1336, 1307,1292 and 1267. Apparently things just are not fixed in Europe, and the drag on the US continues. The VIX is lagging a little this AM which seems odd; it's currently up only up about 2% after a huge high wave yesterday touching the 8 ema. This suggests that the fear is creeping back (the high wave) and foreshadows a turn. So, I expect one.

I am not a bear; just reading the TA, and can change my mind & position if the TA changes. But at the moment short term equities plays or bonds seem appropriate.

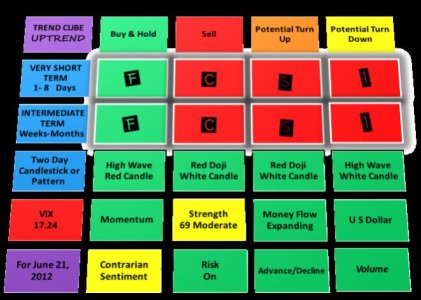
cube_06_21_12.jpg
 
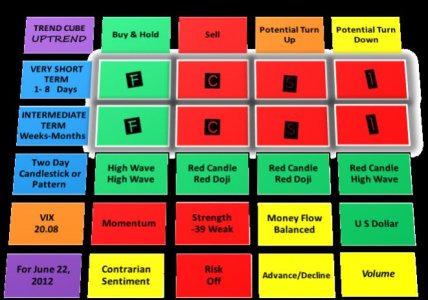
Risk is off, but on the edge, and in the back test mode. The US dollar has re-established an uptrend. Money flow has not turned that negative yet, but starting to this AM. The way I figure volume and A/D line shows that they are starting to turn negative. A short term buy should be arriving in a few days.

cube_06_22_12.jpg
 
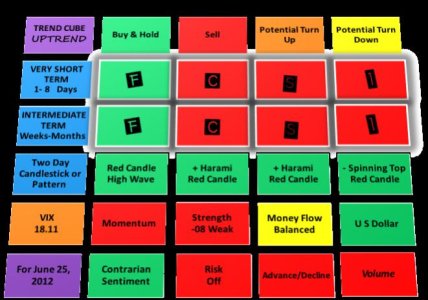
A down day is underway. I expect a turn early next week. After reviewing some data over the weekend, I may not be convinced the correction and the C wave is back in force, unless SPX 1292 is broken. A stall above this area, and there is still a chance for a shot back up to 1263-1400. Dollar strength is driving this decline, but moeny flow on the dollar is declining (US Index Bullish Fund, UUP) this AM , so am watching to see if the gap up was an exhaustion gap or not. One would expect the money flow to be expanding with the dollar rise, so this is a tell of overbought, and that is what the Stochastic also says as it is approaching 90. However, overbought can continue for days, so this will need monitoring.

cube_06_25_12.jpg
 
Back
Top